| Param | Original file | Final file |
|---|---|---|
| Filename | modeM0/AS1A08_003T08_9000003638cztM0_level2.fits | modeM0/AS1A08_003T08_9000003638cztM0_level2_quad_clean.evt |
| Size (bytes) | 243,213,120 | 239,443,200 |
| Size | 231.9 MB | 228.4 MB |
| Events in quadrant A | 1,485,592 | 1,455,638 |
| Events in quadrant B | 1,447,576 | 1,478,759 |
| Events in quadrant C | 1,438,086 | 1,364,061 |
| Events in quadrant D | 1,231,808 | 1,191,177 |
| Mode M0 | |||
|---|---|---|---|
| Quadrant | BADHDUFLAG | Total packets | Discarded packets |
| A | 0 | 58081 | 0 |
| B | 0 | 53294 | 0 |
| C | 0 | 58884 | 0 |
| D | 0 | 72418 | 0 |
| Mode SS | |||
|---|---|---|---|
| Quadrant | BADHDUFLAG | Total packets | Discarded packets |
| A | 0 | 522 | 0 |
| B | 0 | 522 | 0 |
| C | 0 | 522 | 0 |
| D | 0 | 522 | 0 |
| Mode M9 | |||
|---|---|---|---|
| Quadrant | BADHDUFLAG | Total packets | Discarded packets |
| A | 0 | 22 | 0 |
| B | 0 | 22 | 0 |
| C | 0 | 22 | 0 |
| D | 0 | 22 | 0 |
| Quadrant | Total seconds | Saturated seconds | Saturation percentage |
|---|---|---|---|
| A | 25609 | 974 | 3.803350% |
| B | 25609 | 560 | 2.186731% |
| C | 25609 | 942 | 3.678394% |
| D | 25609 | 1868 | 7.294311% |
Noise dominated data is calculated using 1-second bins in cleaned event files. If a bin has >2000 counts, and if more than 50% of those come from <1% of pixels, then it is considered to be noise-dominated and hence unusable.
| Quadrant | # 1 sec bins | Bins with >0 counts | Bins with >2000 counts | High rate bins dominated by noise | Noise dominated (total time) | Noise dominated (detector-on time) | Marked lightcurve |
|---|---|---|---|---|---|---|---|
| A | 27789 | 25609 | 0 | 0 | 0.00% | 0.00% |  |
| B | 27789 | 25609 | 0 | 0 | 0.00% | 0.00% |  |
| C | 27788 | 25606 | 0 | 0 | 0.00% | 0.00% |  |
| D | 27789 | 25603 | 0 | 0 | 0.00% | 0.00% |  |
Top three noisy pixels from each quadrant. If the there are fewer than three noisy pixels in the level2.evt file, extra rows are filled as -1
| Pixel properties | Quadrant properties | ||||||
|---|---|---|---|---|---|---|---|
| Quadrant | DetID | PixID | Counts | Sigma | Mean | Median | Sigma |
| A | 0 | 29 | 1379 | 10.61 | 386 | 360 | 96.1 |
| A | 7 | 110 | 1152 | 8.24 | 386 | 360 | 96.1 |
| A | 9 | 19 | 1108 | 7.79 | 386 | 360 | 96.1 |
| B | 2 | 9 | 1212 | 10.92 | 381 | 362 | 77.9 |
| B | 3 | 17 | 989 | 8.05 | 381 | 362 | 77.9 |
| B | 2 | 8 | 982 | 7.96 | 381 | 362 | 77.9 |
| C | 12 | 241 | 1071 | 7.31 | 379 | 352 | 98.3 |
| C | 3 | 126 | 1004 | 6.63 | 379 | 352 | 98.3 |
| C | 9 | 209 | 1002 | 6.61 | 379 | 352 | 98.3 |
| D | 3 | 14 | 903 | 6.09 | 351 | 318 | 96.1 |
| D | 10 | 189 | 892 | 5.97 | 351 | 318 | 96.1 |
| D | 4 | 160 | 881 | 5.86 | 351 | 318 | 96.1 |
Histogram calculated using DETX and DETY for each event in the final _common_clean file
| Quadrant A |  |
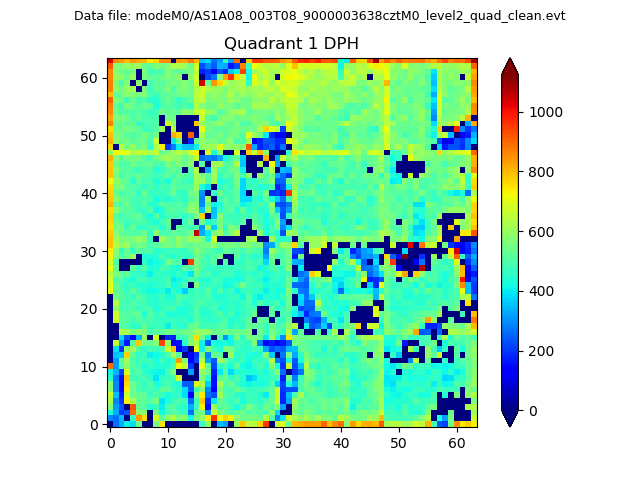 |
Quadrant B |
|---|---|---|---|
| Quadrant D | 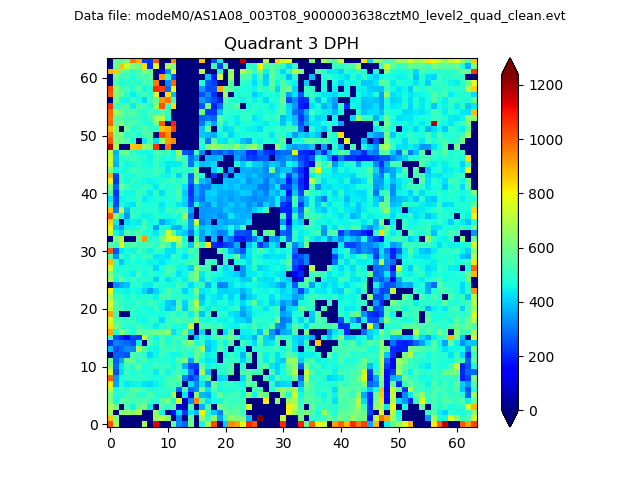 |
 |
Quadrant C |
| Plot type | Count rate plots | Images |
|---|---|---|
| Comparison with Poisson distribution Blue bars denote a histogram of data divided into 1 sec bins. Red curve is a Poisson curve with rate = median count rate of data. |
 |
 |
| Quadrant-wise count rates Data is divided into 100 sec bins |
 |
|
| Module-wise count rates for Quadrant A Data is divided into 100 sec bins |
 |
 |
| Module-wise count rates for Quadrant B Data is divided into 100 sec bins |
 |
 |
| Module-wise count rates for Quadrant C Data is divided into 100 sec bins |
 |
 |
| Module-wise count rates for Quadrant D Data is divided into 100 sec bins |
 |
 |
| Parameter | Plot |
|---|---|
| CZT HV Monitor |  |
| D_VDD | 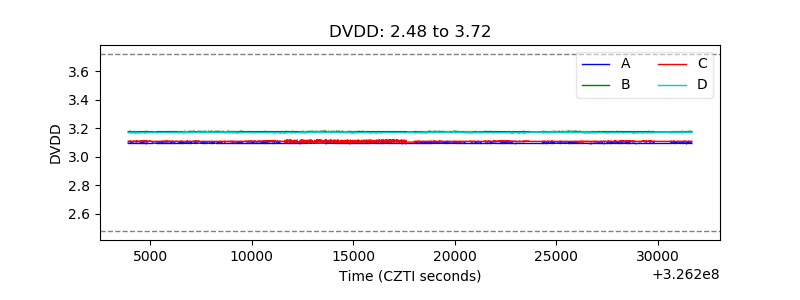 |
| Temperature 1 |  |
| Veto HV Monitor |  |
| Veto LLD | 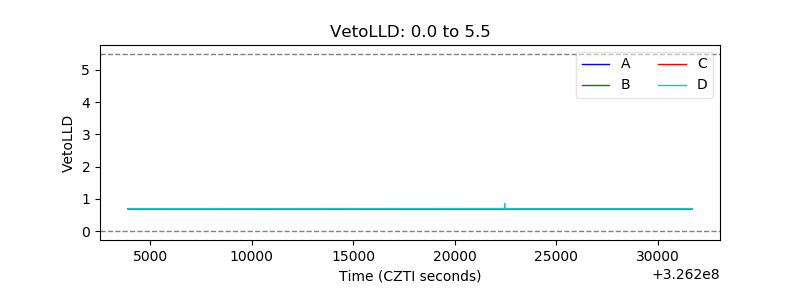 |
| Alpha Counter |  |
| _CPM_Rate |  |
| CZT Counter |  |
| +2.5 Volts monitor |  |
| +5 Volts monitor |  |
| _ROLL_ROT |  |
| _Roll_DEC |  |
| _Roll_RA |  |
| Veto Counter |  |