| Param | Original file | Final file |
|---|---|---|
| Filename | modeM0/AS1A08_003T08_9000003638_24858cztM0_level2.evt | modeM0/AS1A08_003T08_9000003638_24858cztM0_level2_quad_clean.evt |
| Size (bytes) | 639,630,720 | 93,139,200 |
| Size | 610.0 MB | 88.8 MB |
| Events in quadrant A | 4,016,629 | 599,303 |
| Events in quadrant B | 3,839,897 | 609,830 |
| Events in quadrant C | 3,852,793 | 572,240 |
| Events in quadrant D | 7,138,449 | 501,669 |
| Mode M0 | |||
|---|---|---|---|
| Quadrant | BADHDUFLAG | Total packets | Discarded packets |
| A | 0 | 16808 | 2 |
| B | 0 | 16154 | 2 |
| C | 0 | 16117 | 2 |
| D | 0 | 26329 | 2 |
| Mode SS | |||
|---|---|---|---|
| Quadrant | BADHDUFLAG | Total packets | Discarded packets |
| A | 0 | 156 | 0 |
| B | 0 | 156 | 0 |
| C | 0 | 156 | 0 |
| D | 0 | 156 | 0 |
| Mode M9 | |||
|---|---|---|---|
| Quadrant | BADHDUFLAG | Total packets | Discarded packets |
| A | 0 | 2 | 0 |
| B | 0 | 2 | 0 |
| C | 0 | 2 | 0 |
| D | 0 | 2 | 0 |
| Quadrant | Total seconds | Saturated seconds | Saturation percentage |
|---|---|---|---|
| A | 7723 | 238 | 3.081704% |
| B | 7724 | 236 | 3.055412% |
| C | 7724 | 248 | 3.210772% |
| D | 7724 | 1301 | 16.843604% |
Noise dominated data is calculated using 1-second bins in cleaned event files. If a bin has >2000 counts, and if more than 50% of those come from <1% of pixels, then it is considered to be noise-dominated and hence unusable.
| Quadrant | # 1 sec bins | Bins with >0 counts | Bins with >2000 counts | High rate bins dominated by noise | Noise dominated (total time) | Noise dominated (detector-on time) | Marked lightcurve |
|---|---|---|---|---|---|---|---|
| A | 7903 | 7724 | 27 | 27 | 0.34% | 0.35% | 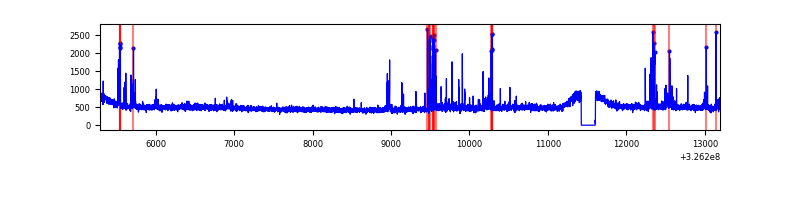 |
| B | 7904 | 7725 | 0 | 0 | 0.00% | 0.00% | 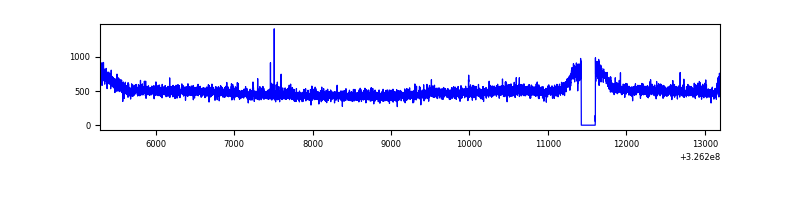 |
| C | 7904 | 7725 | 0 | 0 | 0.00% | 0.00% | 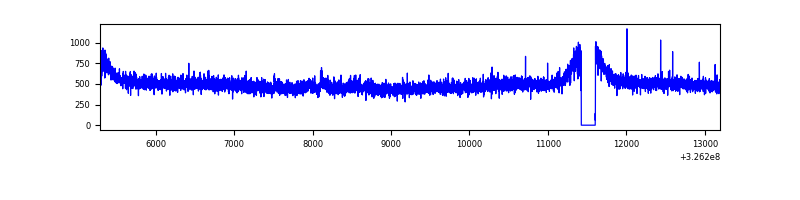 |
| D | 7904 | 7725 | 1117 | 1117 | 14.13% | 14.46% | 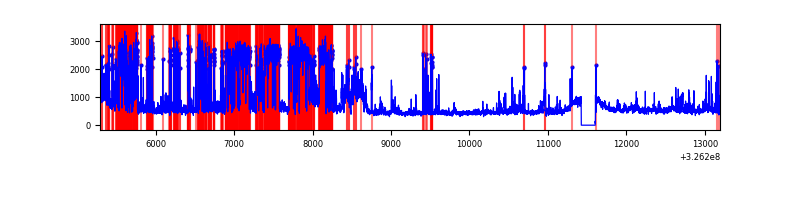 |
Top three noisy pixels from each quadrant. If the there are fewer than three noisy pixels in the level2.evt file, extra rows are filled as -1
| Pixel properties | Quadrant properties | ||||||
|---|---|---|---|---|---|---|---|
| Quadrant | DetID | PixID | Counts | Sigma | Mean | Median | Sigma |
| A | 6 | 16 | 244779 | 1236.44 | 976 | 953 | 197.2 |
| A | 13 | 254 | 11746 | 54.73 | 976 | 953 | 197.2 |
| A | 3 | 137 | 9683 | 44.27 | 976 | 953 | 197.2 |
| B | 7 | 202 | 26023 | 133.39 | 968 | 941 | 188.0 |
| B | 12 | 111 | 24009 | 122.68 | 968 | 941 | 188.0 |
| B | 11 | 111 | 22149 | 112.79 | 968 | 941 | 188.0 |
| C | 14 | 238 | 149497 | 673.62 | 932 | 934 | 220.5 |
| C | 7 | 247 | 60448 | 269.85 | 932 | 934 | 220.5 |
| C | 13 | 61 | 6546 | 25.45 | 932 | 934 | 220.5 |
| D | 1 | 52 | 3201919 | 14704.88 | 885 | 856 | 217.7 |
| D | 12 | 218 | 523510 | 2400.94 | 885 | 856 | 217.7 |
| D | 8 | 195 | 59998 | 271.68 | 885 | 856 | 217.7 |
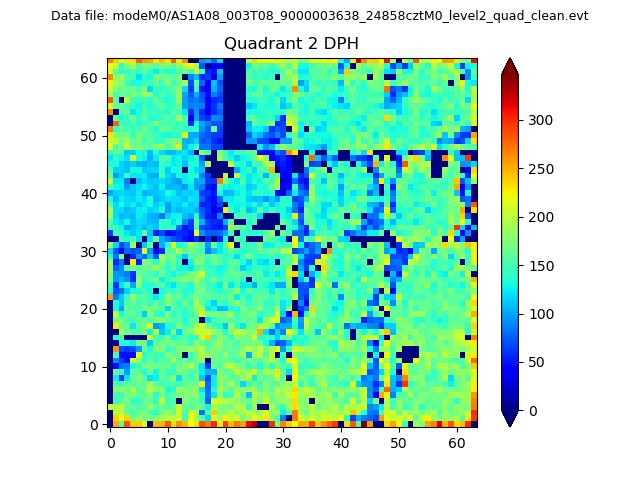
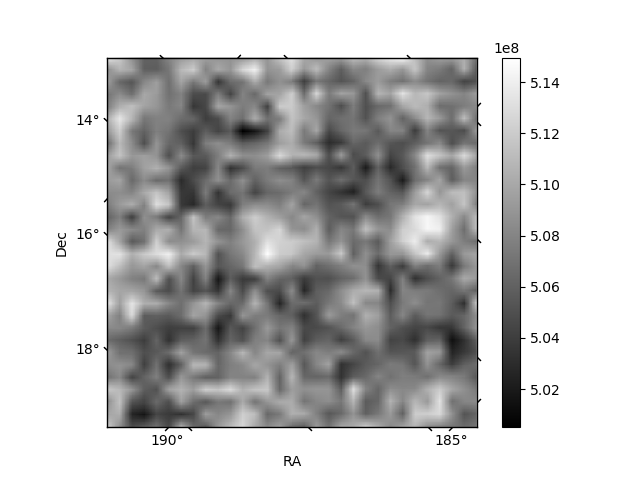
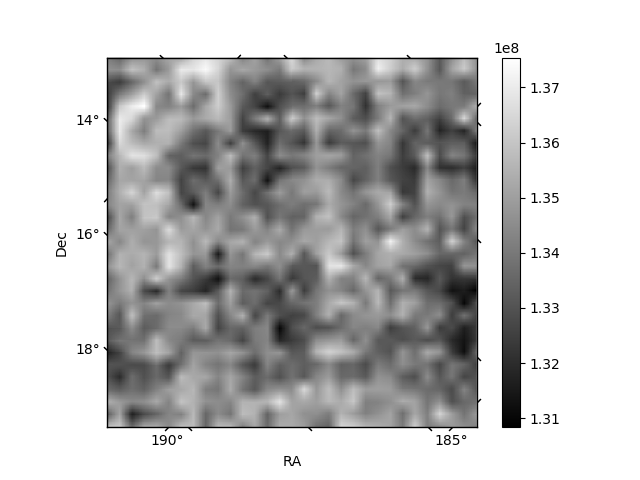
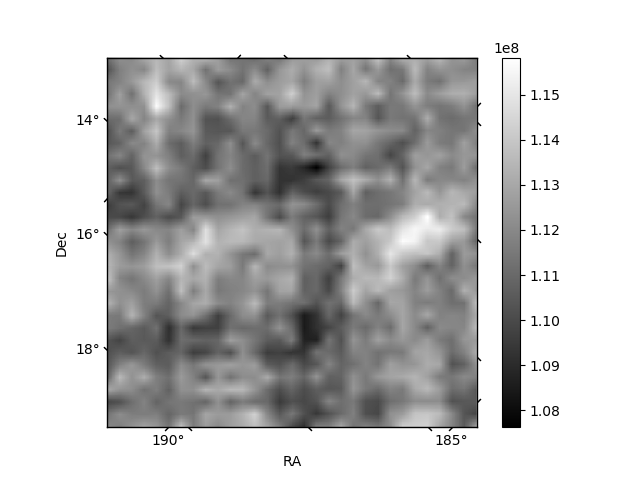
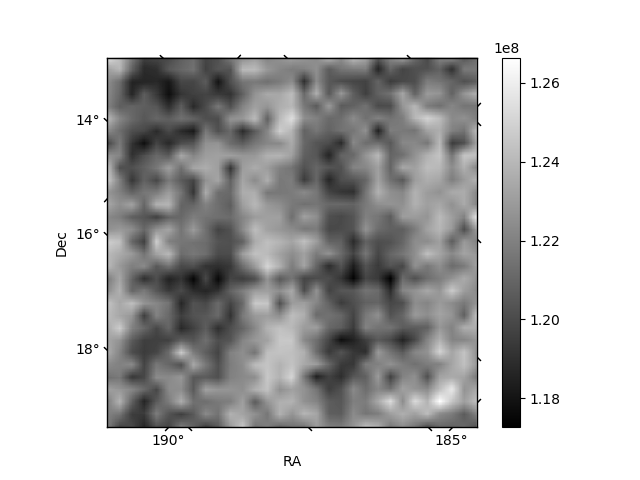
Histogram calculated using DETX and DETY for each event in the final _common_clean file
| Quadrant A | 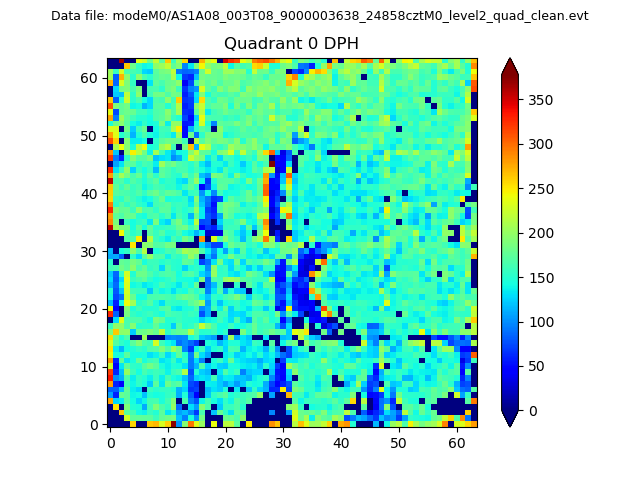 |
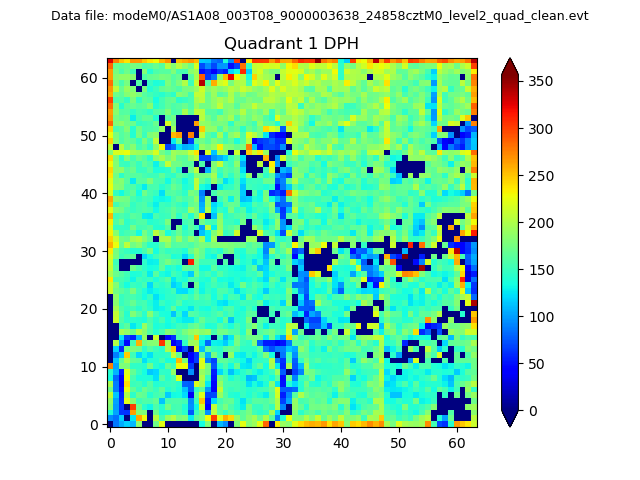 |
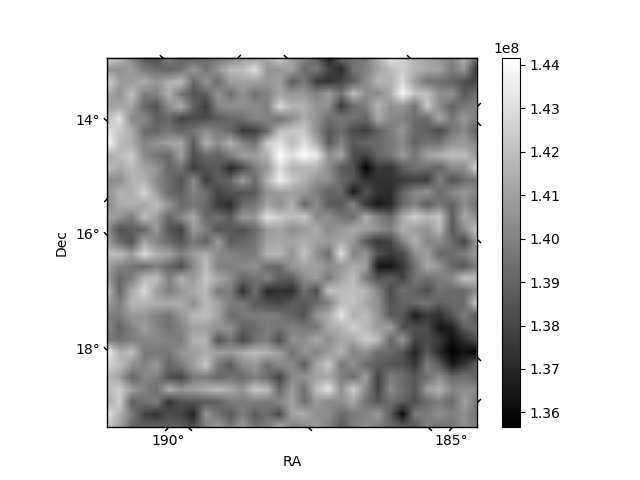
Quadrant B |
|---|---|---|---|
| Quadrant D | 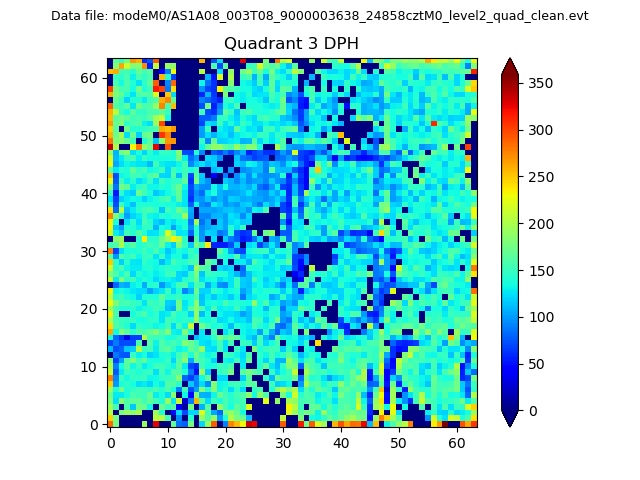 |
 |
Quadrant C |
| Plot type | Count rate plots | Images |
|---|---|---|
| Comparison with Poisson distribution Blue bars denote a histogram of data divided into 1 sec bins. Red curve is a Poisson curve with rate = median count rate of data. |
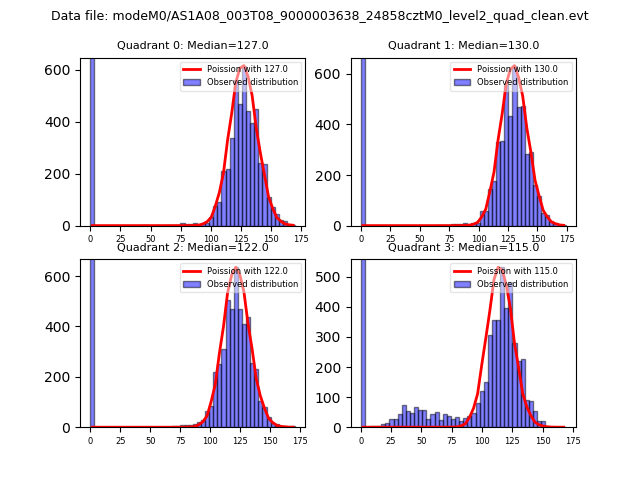 |
 |
| Quadrant-wise count rates Data is divided into 100 sec bins |
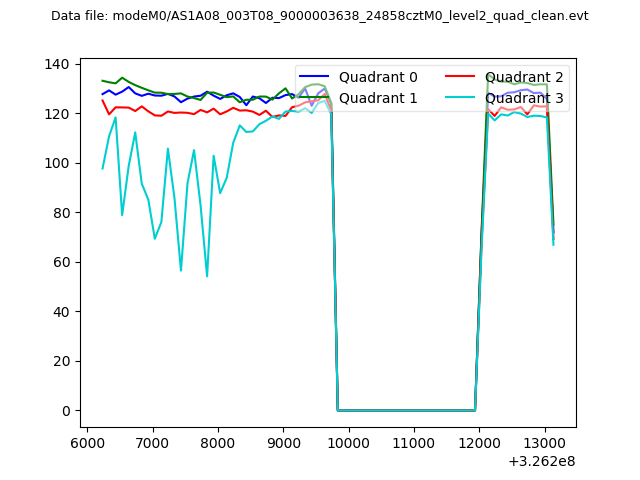 |
|
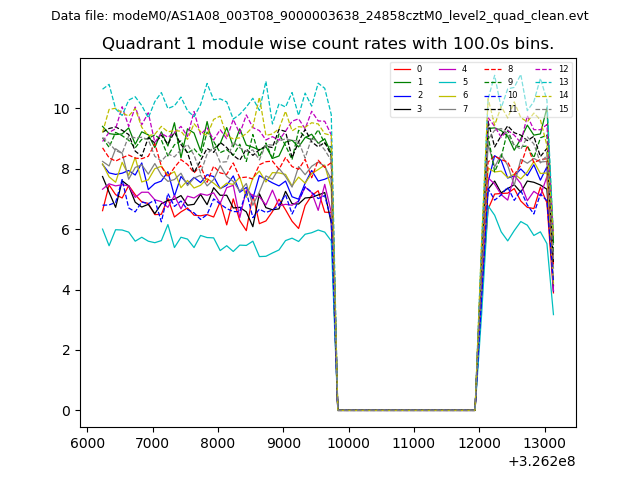
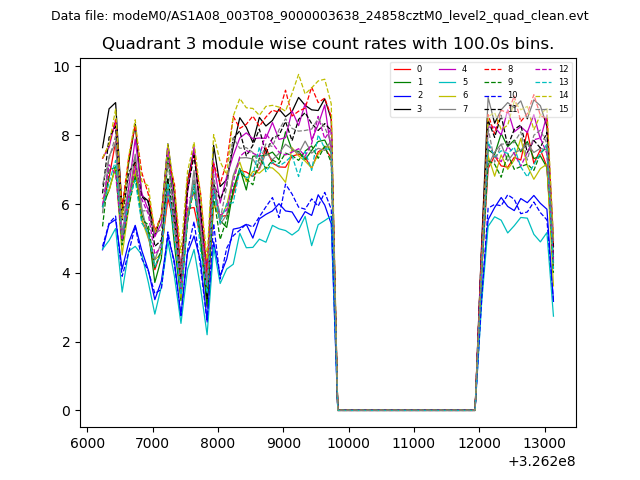
| Module-wise count rates for Quadrant A Data is divided into 100 sec bins |
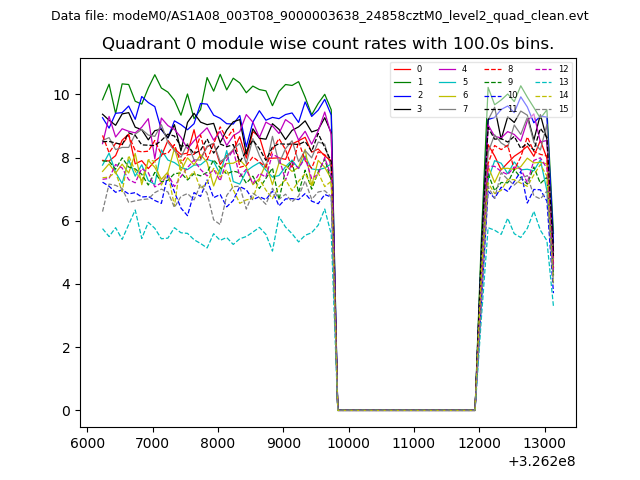 |
 |
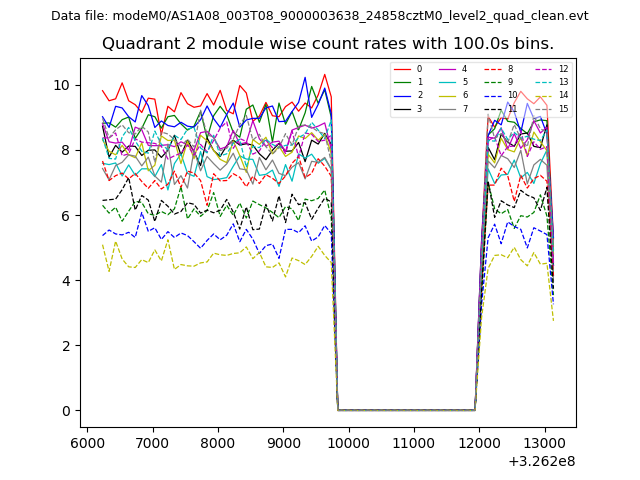
| Module-wise count rates for Quadrant B Data is divided into 100 sec bins |
 |
 |
| Module-wise count rates for Quadrant C Data is divided into 100 sec bins |
 |
 |
| Module-wise count rates for Quadrant D Data is divided into 100 sec bins |
 |
 |
| Parameter | Plot |
|---|---|
| CZT HV Monitor | 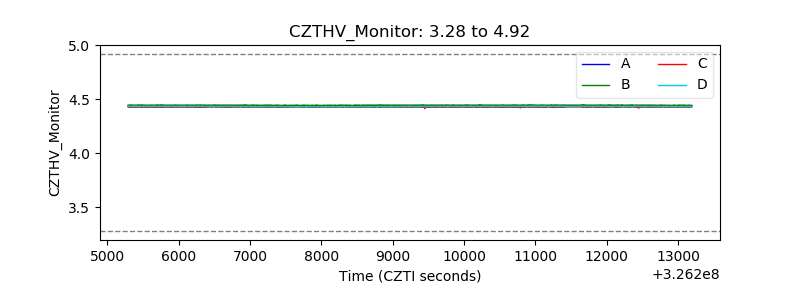 |
| D_VDD | 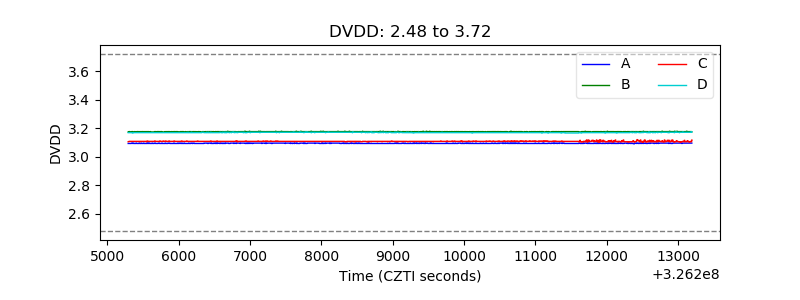 |
| Temperature 1 | 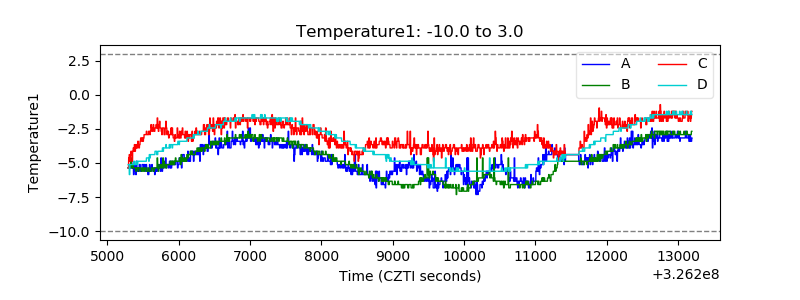 |
| Veto HV Monitor | 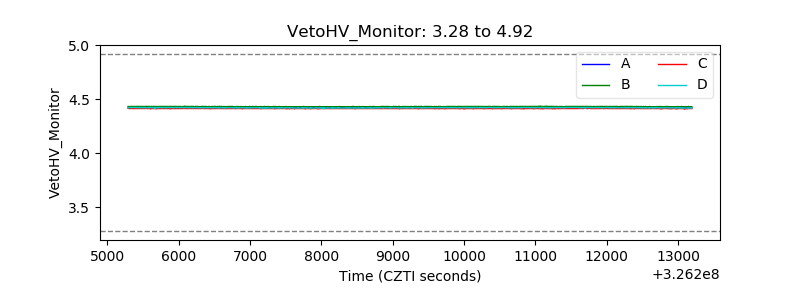 |
| Veto LLD | 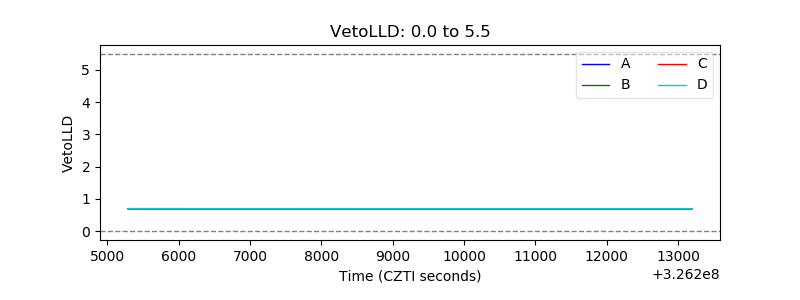 |
| Alpha Counter | 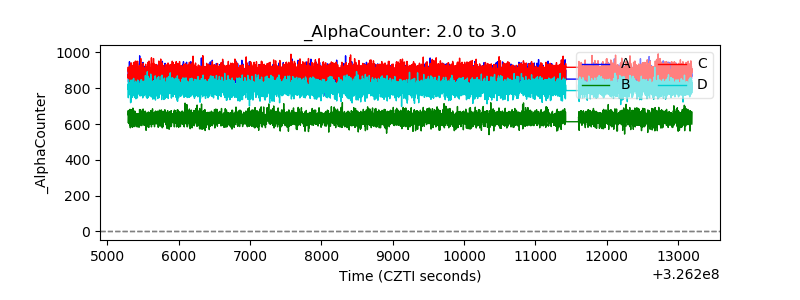 |
| _CPM_Rate | 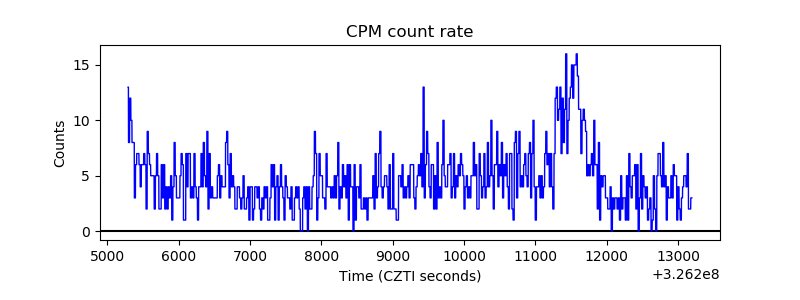 |
| CZT Counter | 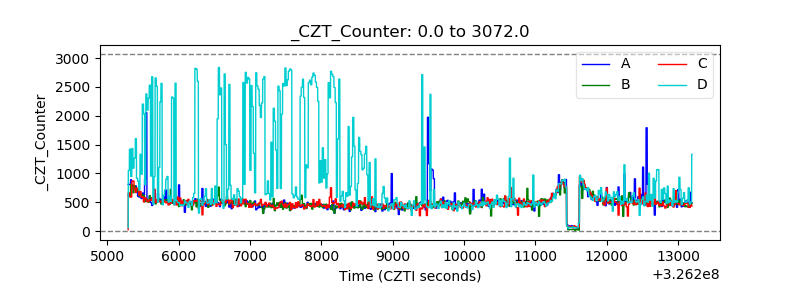 |
| +2.5 Volts monitor |  |
| +5 Volts monitor | 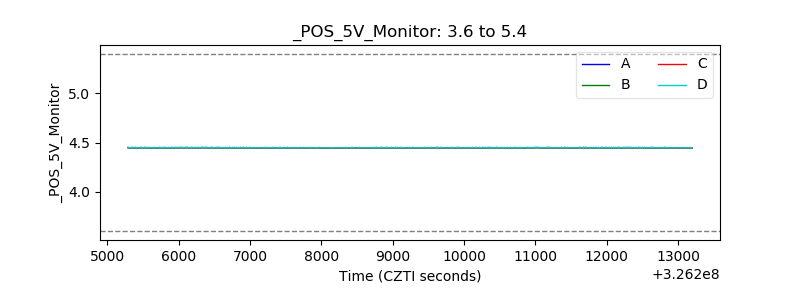 |
| _ROLL_ROT | 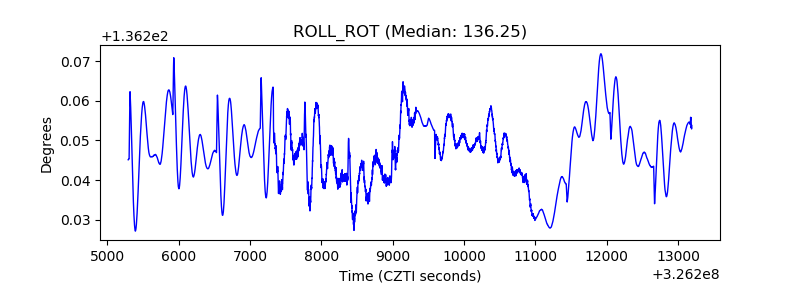 |
| _Roll_DEC | 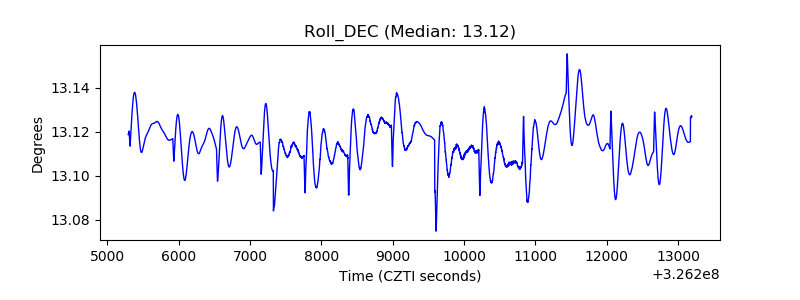 |
| _Roll_RA | 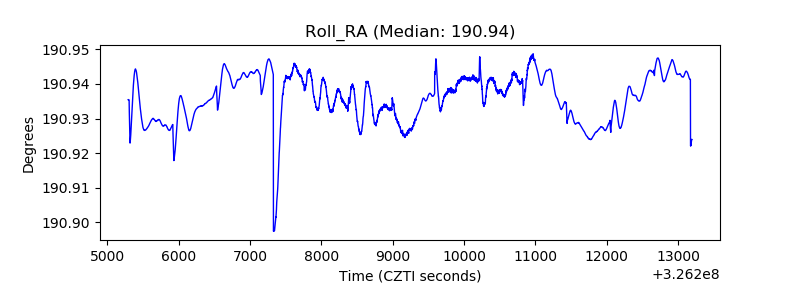 |
| Veto Counter | 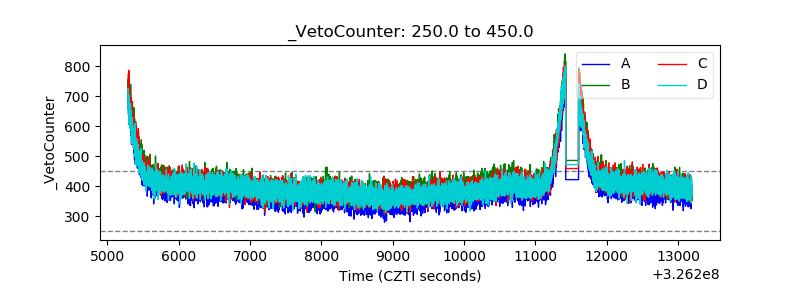 |