| Param | Original file | Final file |
|---|---|---|
| Filename | modeM0/AS1A08_003T08_9000003638_24862cztM0_level2.evt | modeM0/AS1A08_003T08_9000003638_24862cztM0_level2_quad_clean.evt |
| Size (bytes) | 940,852,800 | 154,350,720 |
| Size | 897.3 MB | 147.2 MB |
| Events in quadrant A | 6,728,464 | 972,432 |
| Events in quadrant B | 5,886,661 | 999,839 |
| Events in quadrant C | 7,606,029 | 934,923 |
| Events in quadrant D | 7,448,131 | 924,082 |
| Mode M0 | |||
|---|---|---|---|
| Quadrant | BADHDUFLAG | Total packets | Discarded packets |
| A | 0 | 27895 | 2 |
| B | 0 | 25229 | 2 |
| C | 0 | 30673 | 2 |
| D | 0 | 30139 | 2 |
| Mode SS | |||
|---|---|---|---|
| Quadrant | BADHDUFLAG | Total packets | Discarded packets |
| A | 0 | 248 | 0 |
| B | 0 | 248 | 0 |
| C | 0 | 248 | 0 |
| D | 0 | 248 | 0 |
| Mode M9 | |||
|---|---|---|---|
| Quadrant | BADHDUFLAG | Total packets | Discarded packets |
| A | 0 | 14 | 0 |
| B | 0 | 14 | 0 |
| C | 0 | 14 | 0 |
| D | 0 | 14 | 0 |
| Quadrant | Total seconds | Saturated seconds | Saturation percentage |
|---|---|---|---|
| A | 12196 | 384 | 3.148573% |
| B | 12196 | 107 | 0.877337% |
| C | 12196 | 425 | 3.484749% |
| D | 12196 | 230 | 1.885864% |
Noise dominated data is calculated using 1-second bins in cleaned event files. If a bin has >2000 counts, and if more than 50% of those come from <1% of pixels, then it is considered to be noise-dominated and hence unusable.
| Quadrant | # 1 sec bins | Bins with >0 counts | Bins with >2000 counts | High rate bins dominated by noise | Noise dominated (total time) | Noise dominated (detector-on time) | Marked lightcurve |
|---|---|---|---|---|---|---|---|
| A | 13571 | 12198 | 284 | 284 | 2.09% | 2.33% | 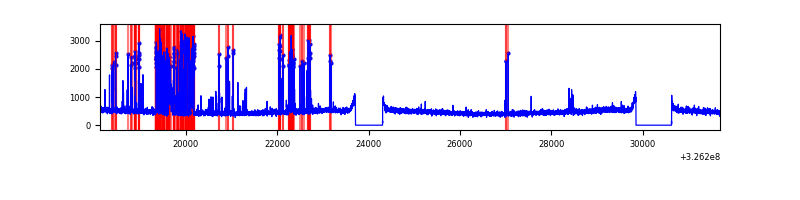 |
| B | 13571 | 12198 | 2 | 2 | 0.01% | 0.02% | 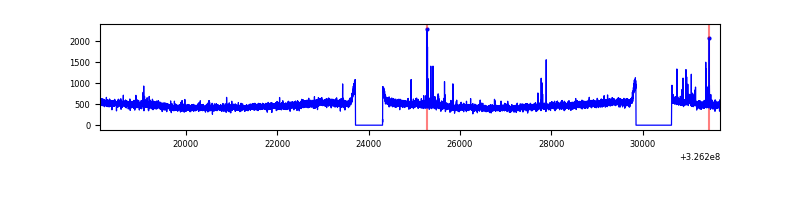 |
| C | 13571 | 12198 | 85 | 85 | 0.63% | 0.70% | 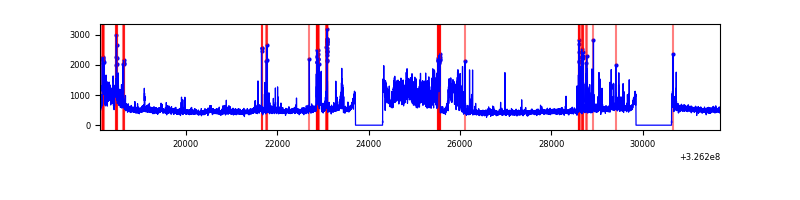 |
| D | 13571 | 12198 | 145 | 145 | 1.07% | 1.19% | 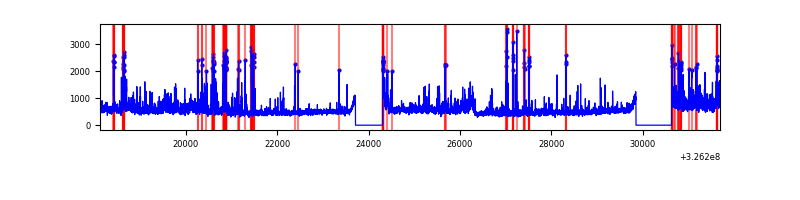 |
Top three noisy pixels from each quadrant. If the there are fewer than three noisy pixels in the level2.evt file, extra rows are filled as -1
| Pixel properties | Quadrant properties | ||||||
|---|---|---|---|---|---|---|---|
| Quadrant | DetID | PixID | Counts | Sigma | Mean | Median | Sigma |
| A | 6 | 16 | 1050175 | 3557.23 | 1469 | 1436 | 294.8 |
| A | 13 | 254 | 17904 | 55.86 | 1469 | 1436 | 294.8 |
| A | 3 | 137 | 14019 | 42.68 | 1469 | 1436 | 294.8 |
| B | 0 | 190 | 47103 | 160.24 | 1469 | 1431 | 285.0 |
| B | 7 | 202 | 38065 | 128.53 | 1469 | 1431 | 285.0 |
| B | 12 | 111 | 35903 | 120.94 | 1469 | 1431 | 285.0 |
| C | 7 | 247 | 1319334 | 4000.71 | 1407 | 1416 | 329.4 |
| C | 2 | 16 | 555454 | 1681.85 | 1407 | 1416 | 329.4 |
| C | 14 | 238 | 222127 | 670.0 | 1407 | 1416 | 329.4 |
| D | 1 | 52 | 824603 | 2349.48 | 1432 | 1389 | 350.4 |
| D | 12 | 218 | 682606 | 1944.21 | 1432 | 1389 | 350.4 |
| D | 10 | 199 | 218886 | 620.74 | 1432 | 1389 | 350.4 |
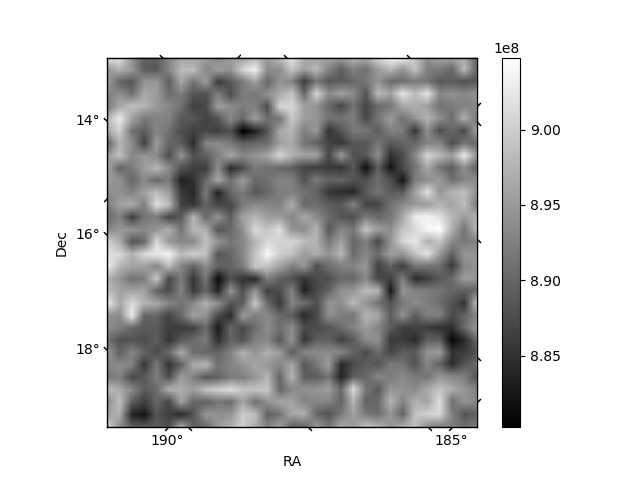
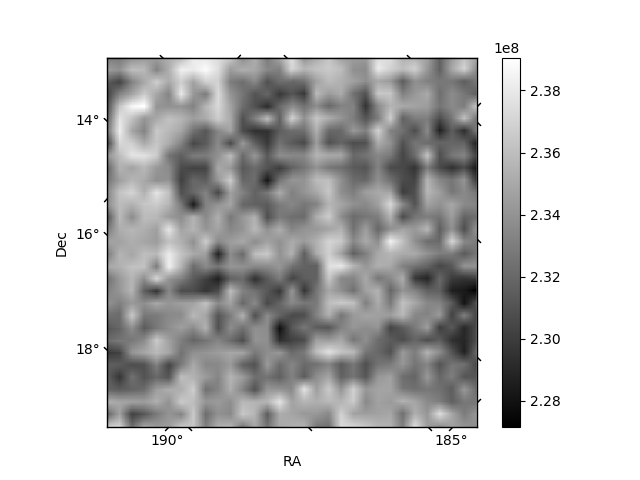
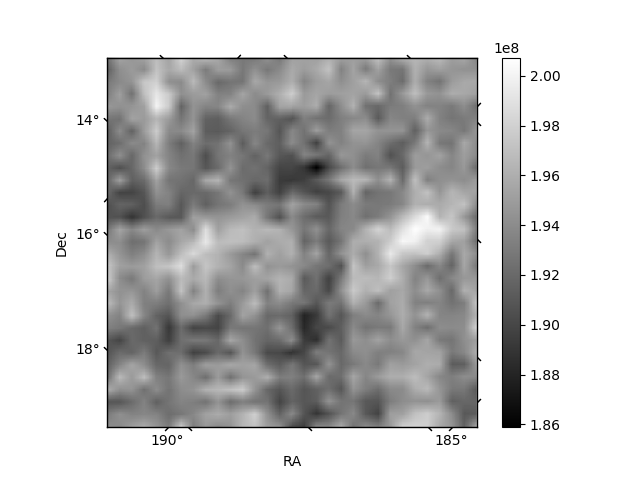
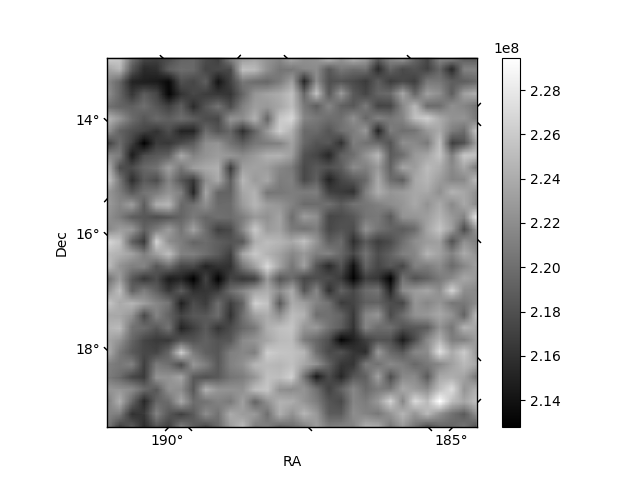
Histogram calculated using DETX and DETY for each event in the final _common_clean file
| Quadrant A | 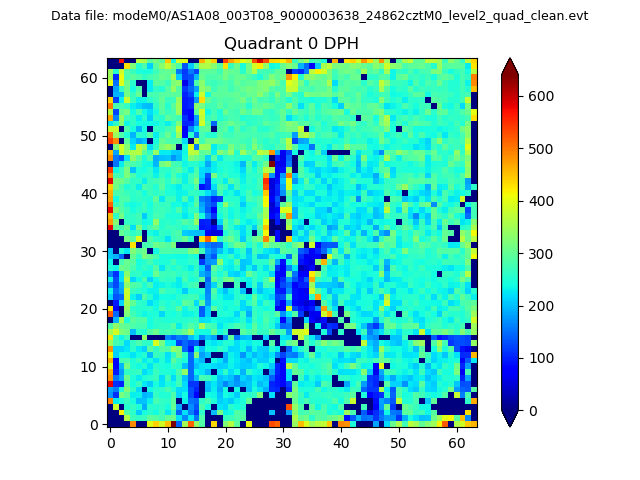 |
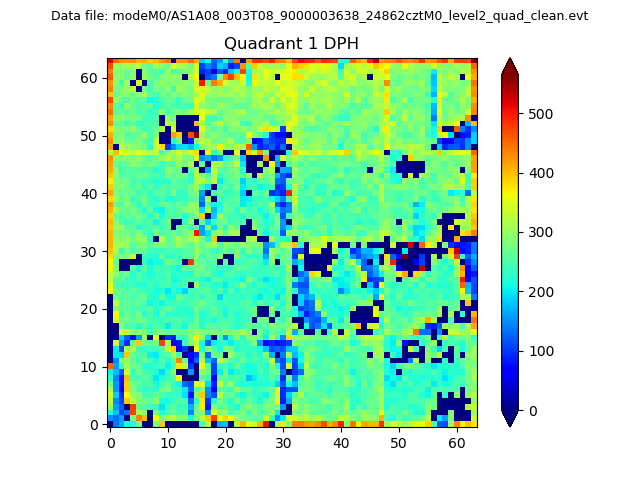 |
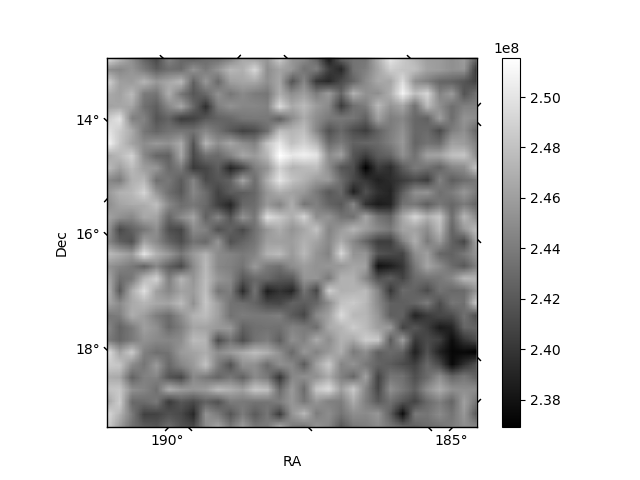
Quadrant B |
|---|---|---|---|
| Quadrant D | 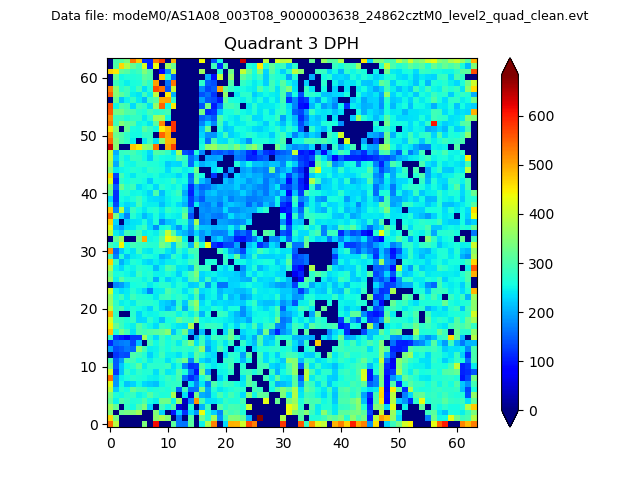 |
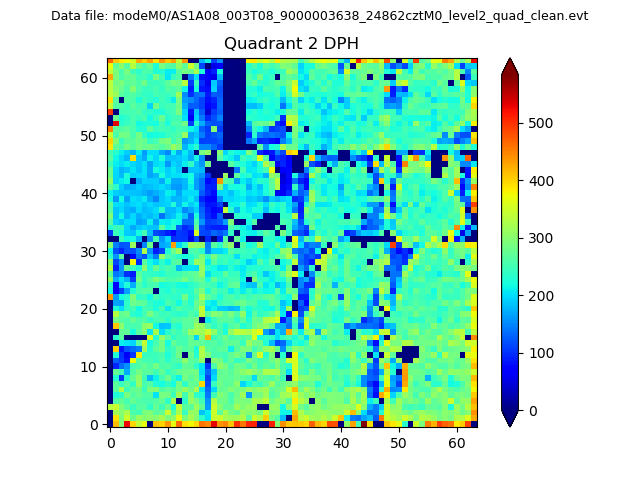 |
Quadrant C |
| Plot type | Count rate plots | Images |
|---|---|---|
| Comparison with Poisson distribution Blue bars denote a histogram of data divided into 1 sec bins. Red curve is a Poisson curve with rate = median count rate of data. |
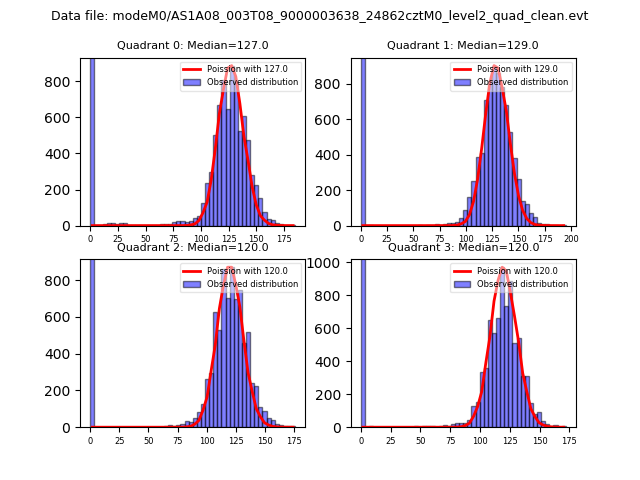 |
 |
| Quadrant-wise count rates Data is divided into 100 sec bins |
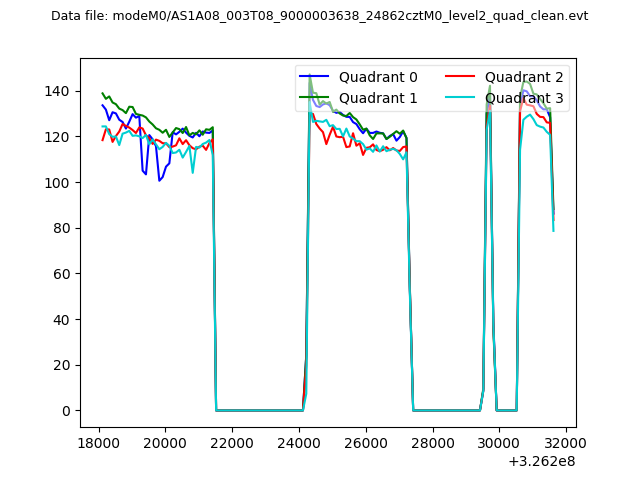 |
|
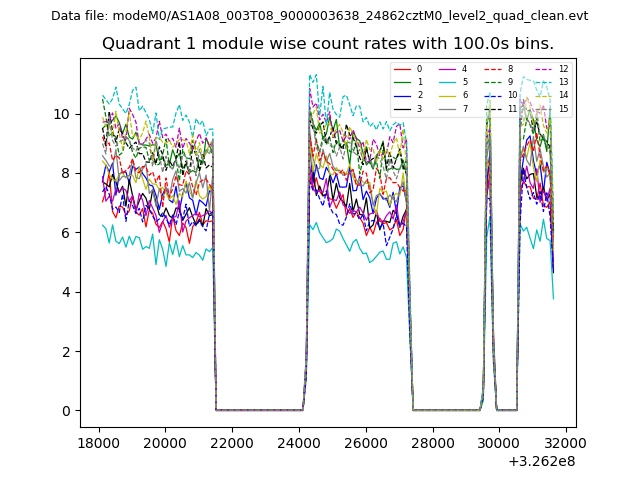
| Module-wise count rates for Quadrant A Data is divided into 100 sec bins |
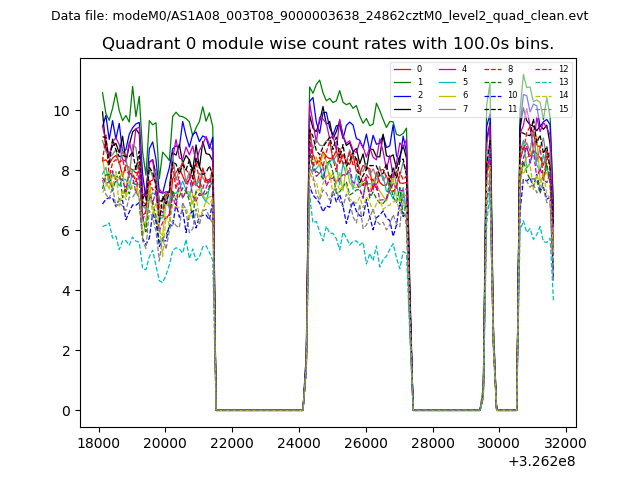 |
 |
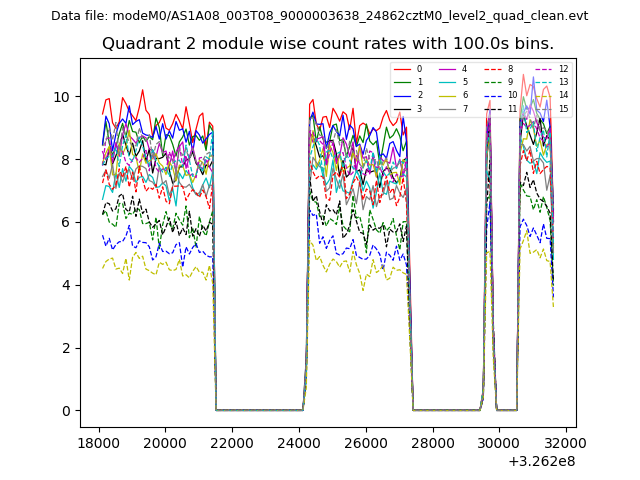
| Module-wise count rates for Quadrant B Data is divided into 100 sec bins |
 |
 |
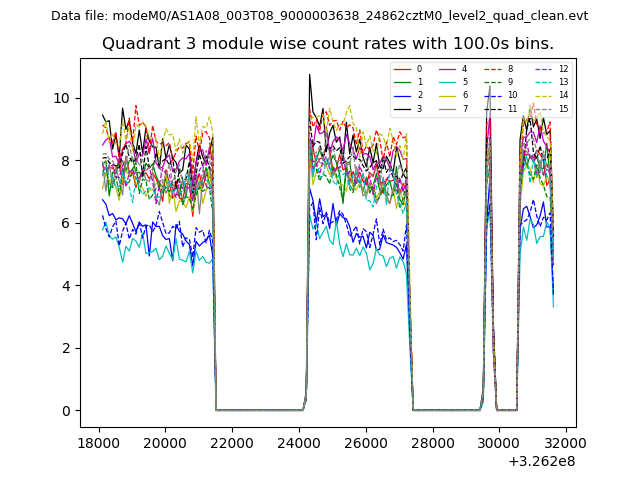
| Module-wise count rates for Quadrant C Data is divided into 100 sec bins |
 |
 |
| Module-wise count rates for Quadrant D Data is divided into 100 sec bins |
 |
 |
| Parameter | Plot |
|---|---|
| CZT HV Monitor | 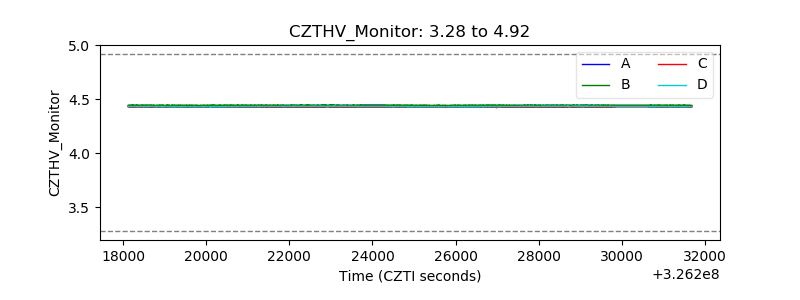 |
| D_VDD | 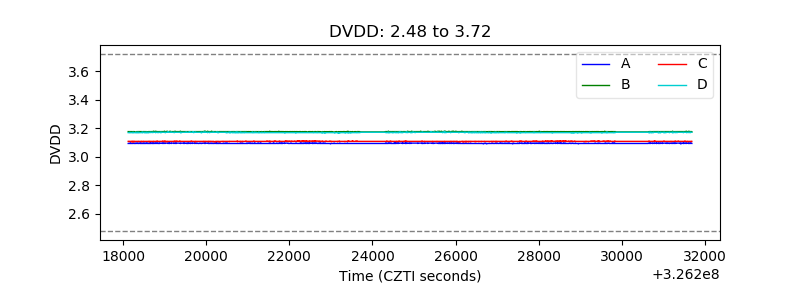 |
| Temperature 1 | 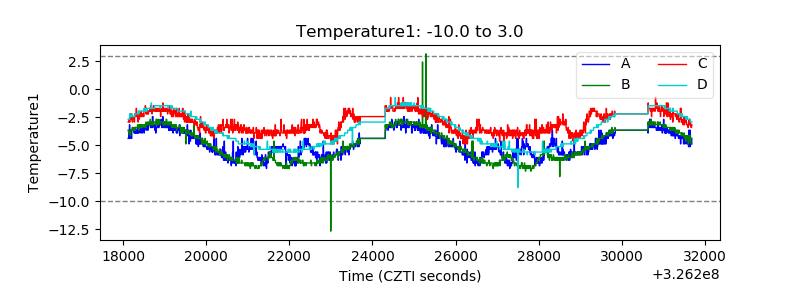 |
| Veto HV Monitor | 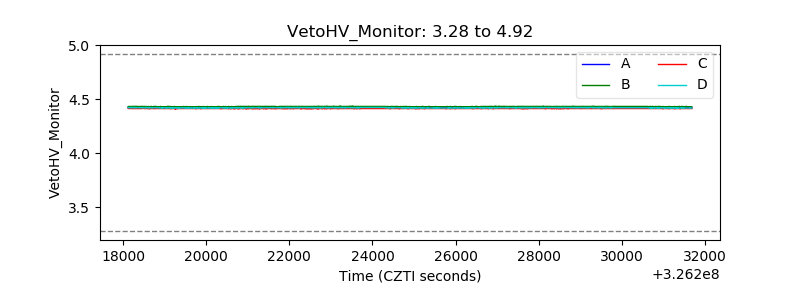 |
| Veto LLD | 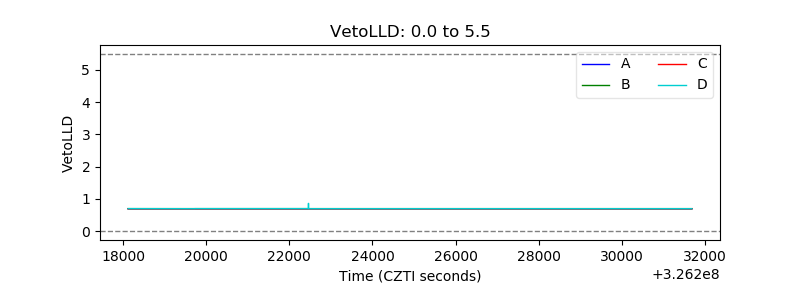 |
| Alpha Counter | 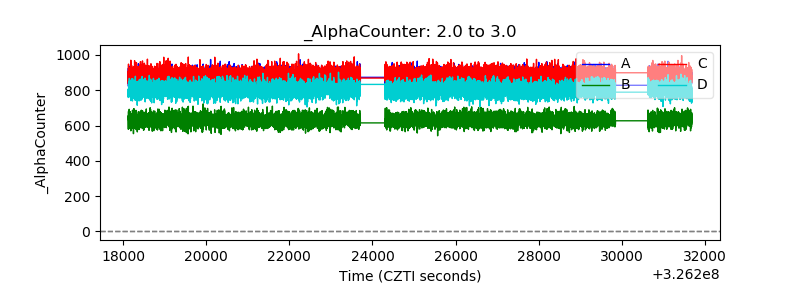 |
| _CPM_Rate | 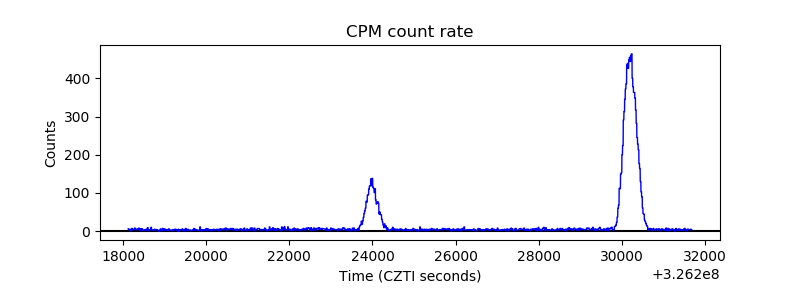 |
| CZT Counter | 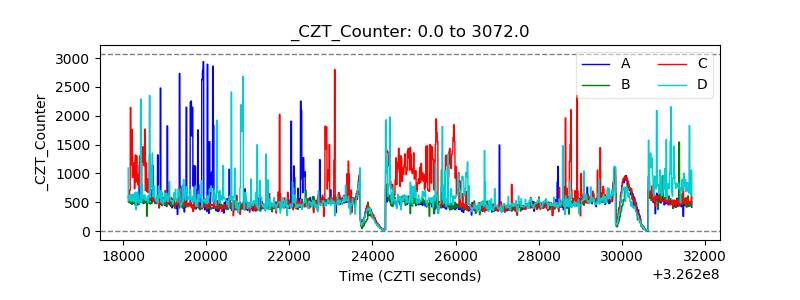 |
| +2.5 Volts monitor |  |
| +5 Volts monitor |  |
| _ROLL_ROT | 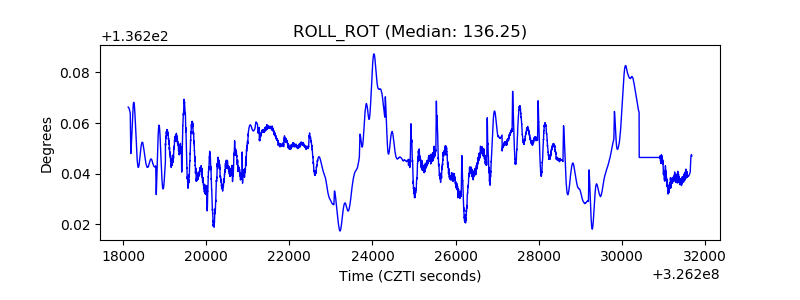 |
| _Roll_DEC | 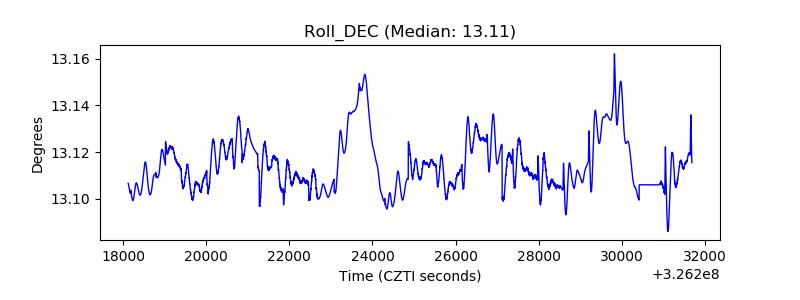 |
| _Roll_RA | 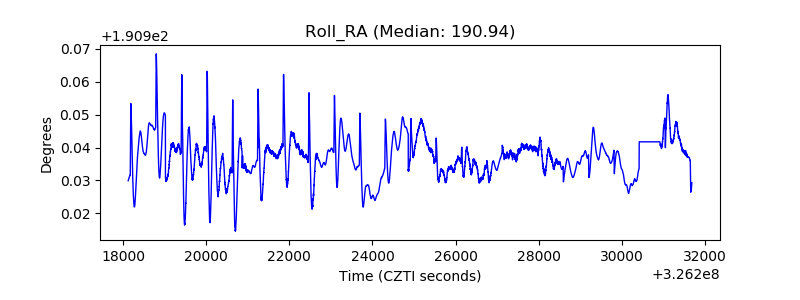 |
| Veto Counter | 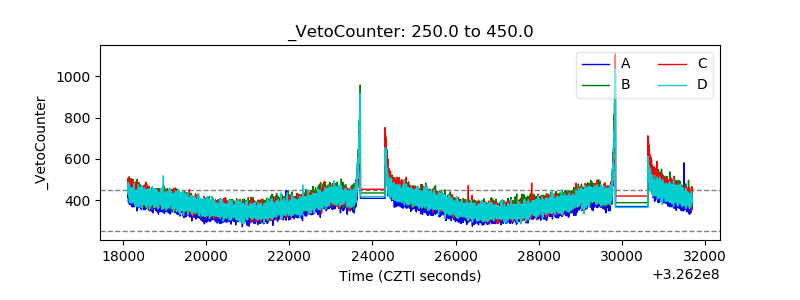 |