| Param | Original file | Final file |
|---|---|---|
| Filename | modeM0/AS1A07_027T16_9000003642cztM0_level2.fits | modeM0/AS1A07_027T16_9000003642cztM0_level2_quad_clean.evt |
| Size (bytes) | 593,484,480 | 437,483,520 |
| Size | 566.0 MB | 417.2 MB |
| Events in quadrant A | 3,711,994 | 2,422,104 |
| Events in quadrant B | 3,538,332 | 2,436,233 |
| Events in quadrant C | 3,532,618 | 2,259,112 |
| Events in quadrant D | 3,150,626 | 2,091,121 |
| Mode M9 | |||
|---|---|---|---|
| Quadrant | BADHDUFLAG | Total packets | Discarded packets |
| A | 0 | 107 | 0 |
| B | 0 | 107 | 0 |
| C | 0 | 107 | 0 |
| D | 0 | 107 | 0 |
| Mode M0 | |||
|---|---|---|---|
| Quadrant | BADHDUFLAG | Total packets | Discarded packets |
| A | 0 | 126383 | 0 |
| B | 0 | 123811 | 0 |
| C | 0 | 158308 | 0 |
| D | 0 | 168856 | 0 |
| Mode SS | |||
|---|---|---|---|
| Quadrant | BADHDUFLAG | Total packets | Discarded packets |
| A | 0 | 1198 | 0 |
| B | 0 | 1198 | 0 |
| C | 0 | 1198 | 0 |
| D | 0 | 1198 | 0 |
| Quadrant | Total seconds | Saturated seconds | Saturation percentage |
|---|---|---|---|
| A | 58864 | 718 | 1.219761% |
| B | 58864 | 658 | 1.117831% |
| C | 58864 | 4181 | 7.102813% |
| D | 58864 | 3356 | 5.701278% |
Noise dominated data is calculated using 1-second bins in cleaned event files. If a bin has >2000 counts, and if more than 50% of those come from <1% of pixels, then it is considered to be noise-dominated and hence unusable.
| Quadrant | # 1 sec bins | Bins with >0 counts | Bins with >2000 counts | High rate bins dominated by noise | Noise dominated (total time) | Noise dominated (detector-on time) | Marked lightcurve |
|---|---|---|---|---|---|---|---|
| A | 69674 | 58863 | 0 | 0 | 0.00% | 0.00% |  |
| B | 69674 | 58864 | 0 | 0 | 0.00% | 0.00% | 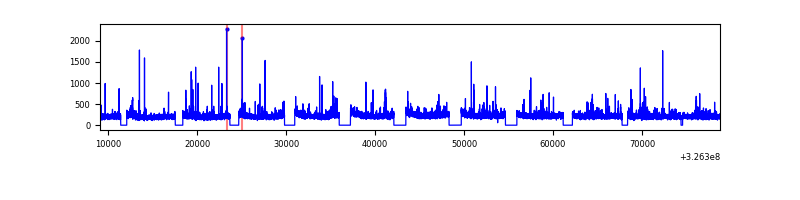 |
| C | 69674 | 58855 | 0 | 0 | 0.00% | 0.00% | 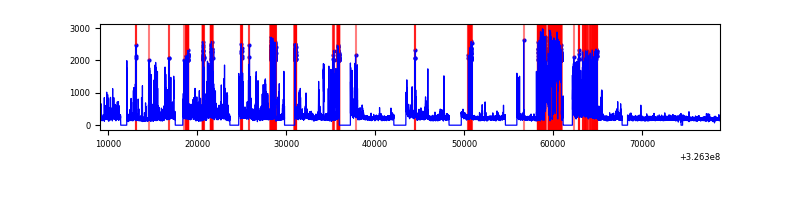 |
| D | 69674 | 58783 | 0 | 0 | 0.00% | 0.00% | 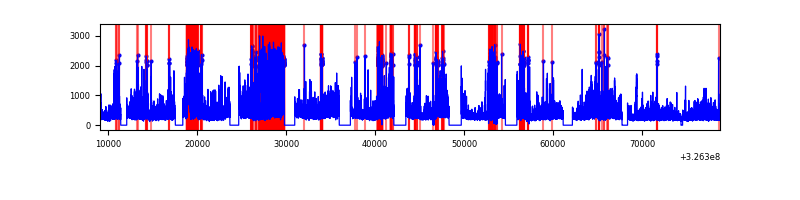 |
Top three noisy pixels from each quadrant. If the there are fewer than three noisy pixels in the level2.evt file, extra rows are filled as -1
| Pixel properties | Quadrant properties | ||||||
|---|---|---|---|---|---|---|---|
| Quadrant | DetID | PixID | Counts | Sigma | Mean | Median | Sigma |
| A | 0 | 29 | 3445 | 10.88 | 965 | 909 | 233.1 |
| A | 7 | 110 | 2999 | 8.97 | 965 | 909 | 233.1 |
| A | 9 | 19 | 2713 | 7.74 | 965 | 909 | 233.1 |
| B | 2 | 9 | 2853 | 10.72 | 936 | 897 | 182.4 |
| B | 2 | 8 | 2418 | 8.34 | 936 | 897 | 182.4 |
| B | 5 | 128 | 2359 | 8.01 | 936 | 897 | 182.4 |
| C | 3 | 234 | 2460 | 6.71 | 933 | 879 | 235.7 |
| C | 3 | 126 | 2451 | 6.67 | 933 | 879 | 235.7 |
| C | 12 | 241 | 2386 | 6.39 | 933 | 879 | 235.7 |
| D | 10 | 189 | 2251 | 6.01 | 899 | 826 | 237.2 |
| D | 6 | 67 | 2226 | 5.9 | 899 | 826 | 237.2 |
| D | 15 | 46 | 2218 | 5.87 | 899 | 826 | 237.2 |
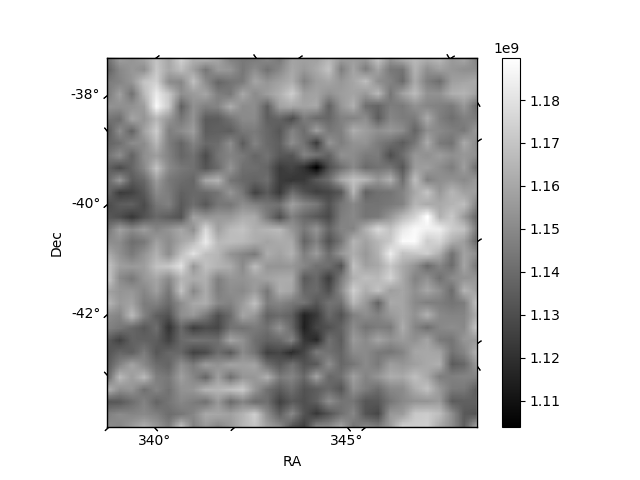
Histogram calculated using DETX and DETY for each event in the final _common_clean file
| Quadrant A |  |
 |
Quadrant B |
|---|---|---|---|
| Quadrant D |  |
 |
Quadrant C |
| Plot type | Count rate plots | Images |
|---|---|---|
| Comparison with Poisson distribution Blue bars denote a histogram of data divided into 1 sec bins. Red curve is a Poisson curve with rate = median count rate of data. |
 |
 |
| Quadrant-wise count rates Data is divided into 100 sec bins |
 |
|
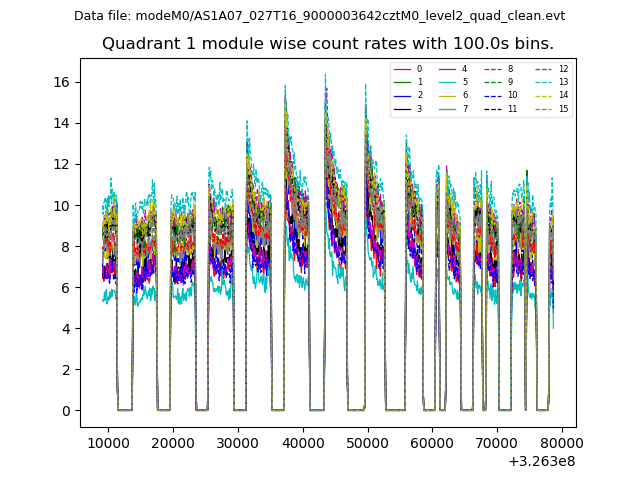
| Module-wise count rates for Quadrant A Data is divided into 100 sec bins |
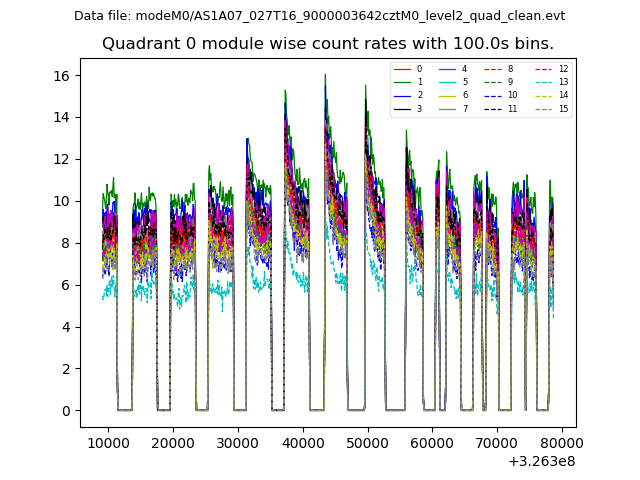 |
 |
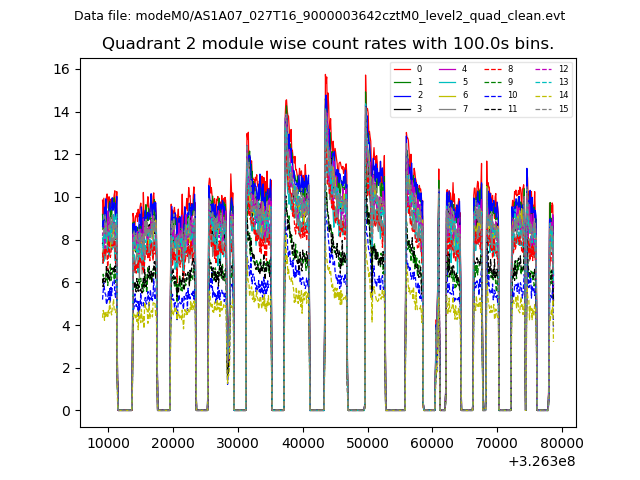
| Module-wise count rates for Quadrant B Data is divided into 100 sec bins |
 |
 |
| Module-wise count rates for Quadrant C Data is divided into 100 sec bins |
 |
 |
| Module-wise count rates for Quadrant D Data is divided into 100 sec bins |
 |
 |
| Parameter | Plot |
|---|---|
| CZT HV Monitor |  |
| D_VDD |  |
| Temperature 1 |  |
| Veto HV Monitor |  |
| Veto LLD | 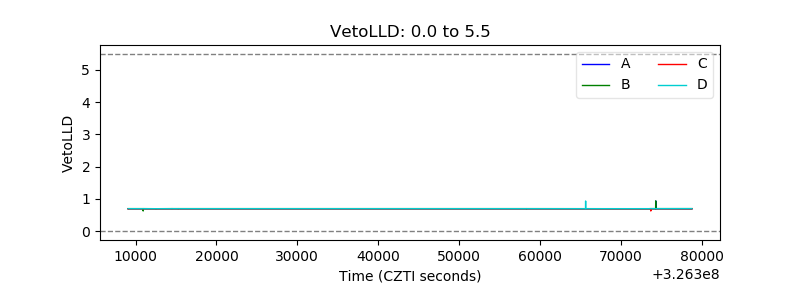 |
| Alpha Counter | 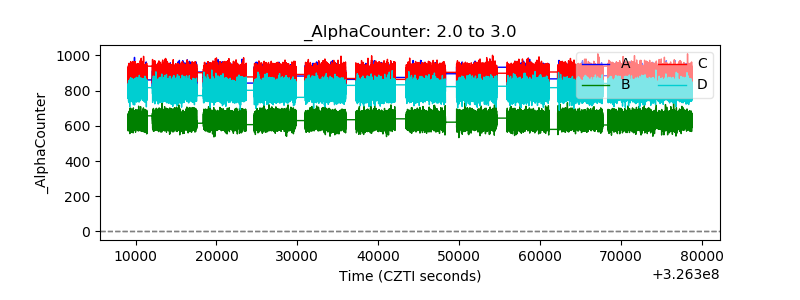 |
| _CPM_Rate |  |
| CZT Counter |  |
| +2.5 Volts monitor |  |
| +5 Volts monitor | 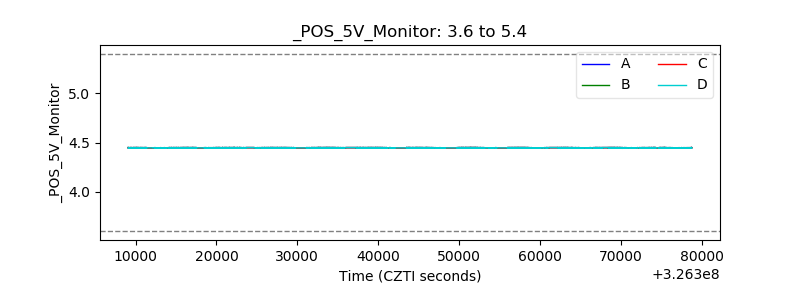 |
| _ROLL_ROT |  |
| _Roll_DEC |  |
| _Roll_RA |  |
| Veto Counter | 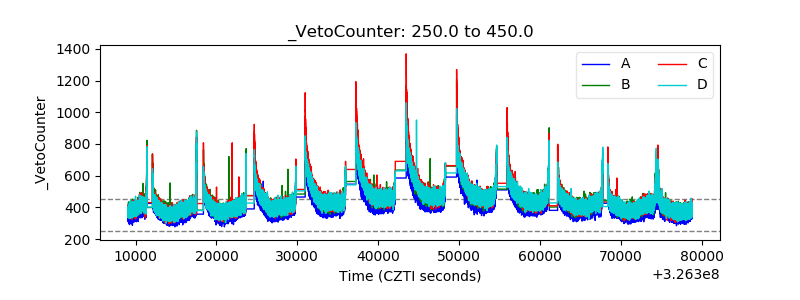 |