| Param | Original file | Final file |
|---|---|---|
| Filename | modeM0/AS1A07_027T16_9000003642_24876cztM0_level2.evt | modeM0/AS1A07_027T16_9000003642_24876cztM0_level2_quad_clean.evt |
| Size (bytes) | 735,874,560 | 124,231,680 |
| Size | 701.8 MB | 118.5 MB |
| Events in quadrant A | 4,405,482 | 798,836 |
| Events in quadrant B | 4,458,493 | 805,266 |
| Events in quadrant C | 5,809,802 | 762,546 |
| Events in quadrant D | 6,990,606 | 758,313 |
| Mode M9 | |||
|---|---|---|---|
| Quadrant | BADHDUFLAG | Total packets | Discarded packets |
| A | 0 | 16 | 0 |
| B | 0 | 16 | 0 |
| C | 0 | 16 | 0 |
| D | 0 | 16 | 0 |
| Mode M0 | |||
|---|---|---|---|
| Quadrant | BADHDUFLAG | Total packets | Discarded packets |
| A | 0 | 18988 | 2 |
| B | 0 | 19088 | 2 |
| C | 0 | 23320 | 2 |
| D | 0 | 26896 | 2 |
| Mode SS | |||
|---|---|---|---|
| Quadrant | BADHDUFLAG | Total packets | Discarded packets |
| A | 0 | 186 | 0 |
| B | 0 | 186 | 0 |
| C | 0 | 186 | 0 |
| D | 0 | 186 | 0 |
| Quadrant | Total seconds | Saturated seconds | Saturation percentage |
|---|---|---|---|
| A | 9192 | 93 | 1.011749% |
| B | 9192 | 96 | 1.044386% |
| C | 9191 | 377 | 4.101839% |
| D | 9191 | 519 | 5.646828% |
Noise dominated data is calculated using 1-second bins in cleaned event files. If a bin has >2000 counts, and if more than 50% of those come from <1% of pixels, then it is considered to be noise-dominated and hence unusable.
| Quadrant | # 1 sec bins | Bins with >0 counts | Bins with >2000 counts | High rate bins dominated by noise | Noise dominated (total time) | Noise dominated (detector-on time) | Marked lightcurve |
|---|---|---|---|---|---|---|---|
| A | 10722 | 9194 | 0 | 0 | 0.00% | 0.00% | 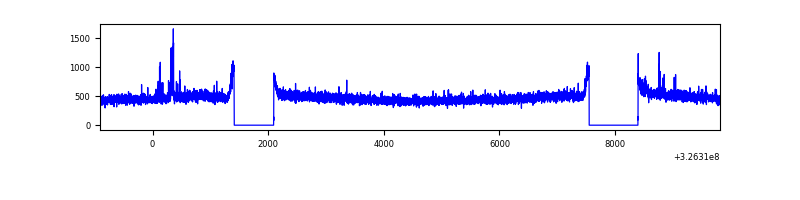 |
| B | 10722 | 9194 | 1 | 1 | 0.01% | 0.01% | 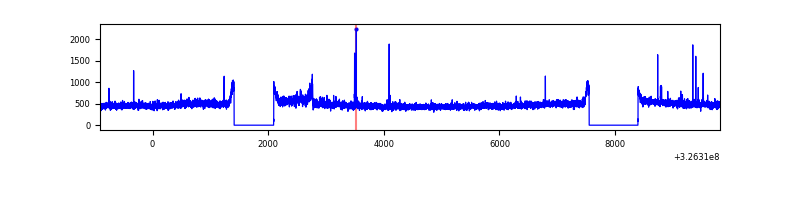 |
| C | 10721 | 9193 | 136 | 136 | 1.27% | 1.48% | 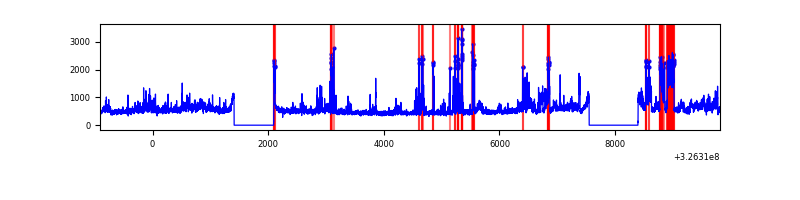 |
| D | 10721 | 9193 | 454 | 454 | 4.23% | 4.94% | 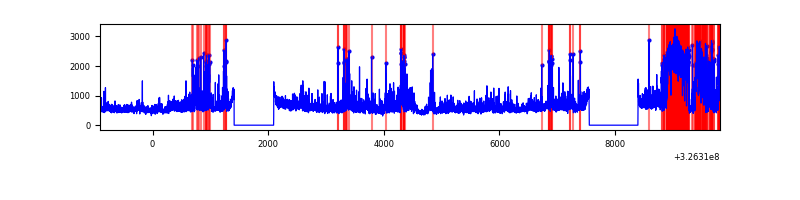 |
Top three noisy pixels from each quadrant. If the there are fewer than three noisy pixels in the level2.evt file, extra rows are filled as -1
| Pixel properties | Quadrant properties | ||||||
|---|---|---|---|---|---|---|---|
| Quadrant | DetID | PixID | Counts | Sigma | Mean | Median | Sigma |
| A | 6 | 16 | 47473 | 204.84 | 1128 | 1101 | 226.4 |
| A | 13 | 254 | 13483 | 54.69 | 1128 | 1101 | 226.4 |
| A | 3 | 137 | 10447 | 41.28 | 1128 | 1101 | 226.4 |
| B | 0 | 190 | 43803 | 197.93 | 1113 | 1083 | 215.8 |
| B | 12 | 111 | 26390 | 117.25 | 1113 | 1083 | 215.8 |
| B | 11 | 111 | 23870 | 105.58 | 1113 | 1083 | 215.8 |
| C | 7 | 247 | 1193331 | 4745.51 | 1070 | 1075 | 251.2 |
| C | 2 | 16 | 264976 | 1050.4 | 1070 | 1075 | 251.2 |
| C | 14 | 238 | 168715 | 667.25 | 1070 | 1075 | 251.2 |
| D | 1 | 52 | 1764693 | 6706.99 | 1085 | 1054 | 263.0 |
| D | 8 | 195 | 998969 | 3795.0 | 1085 | 1054 | 263.0 |
| D | 6 | 2 | 57814 | 215.85 | 1085 | 1054 | 263.0 |
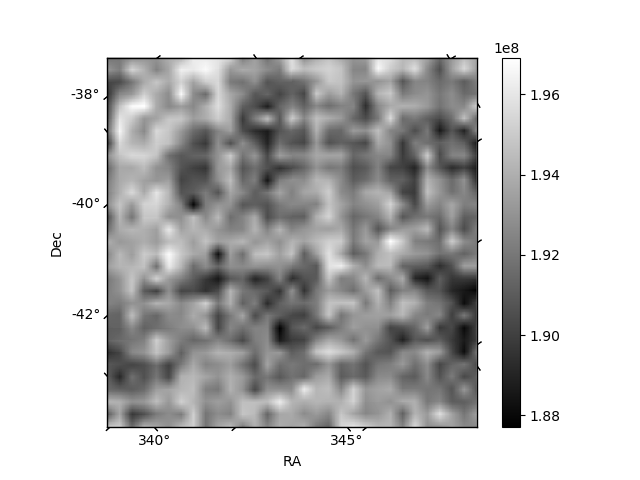
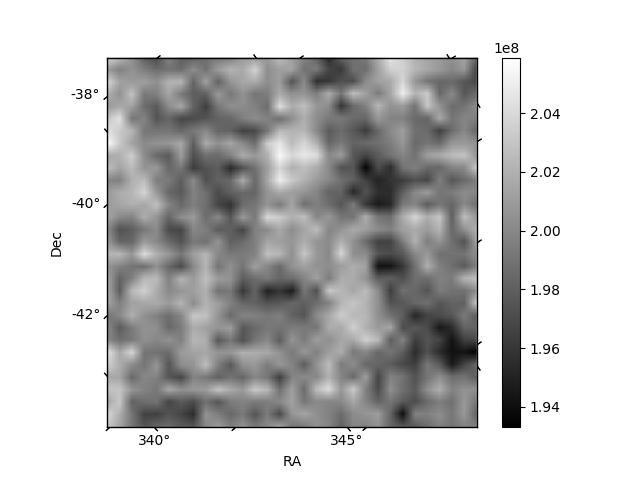
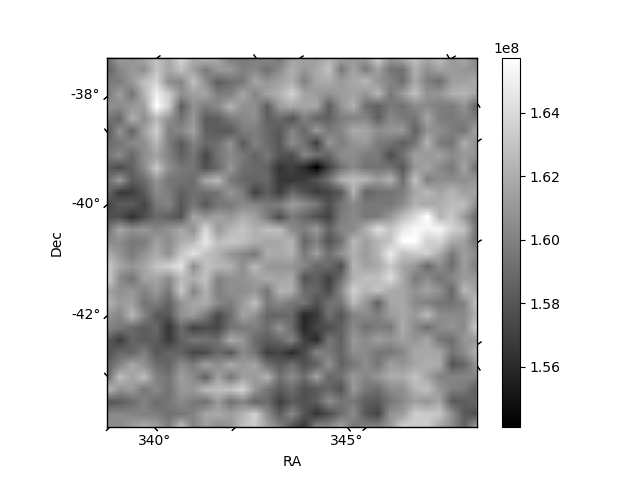
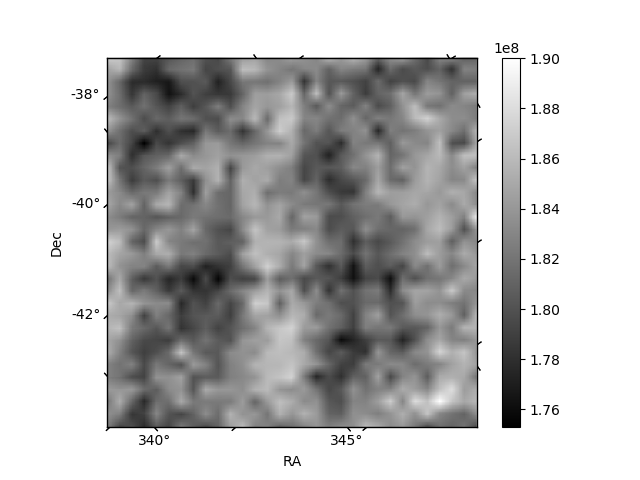
Histogram calculated using DETX and DETY for each event in the final _common_clean file
| Quadrant A | 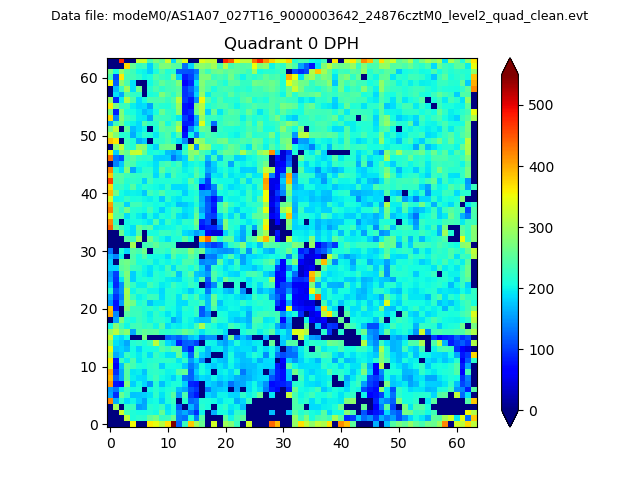 |
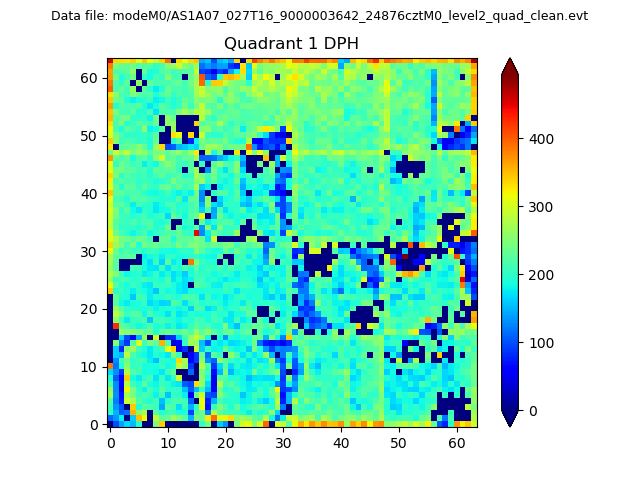 |
Quadrant B |
|---|---|---|---|
| Quadrant D | 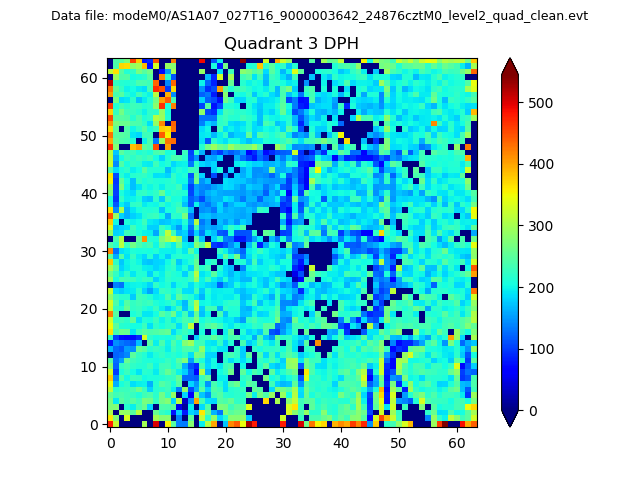 |
 |
Quadrant C |
| Plot type | Count rate plots | Images |
|---|---|---|
| Comparison with Poisson distribution Blue bars denote a histogram of data divided into 1 sec bins. Red curve is a Poisson curve with rate = median count rate of data. |
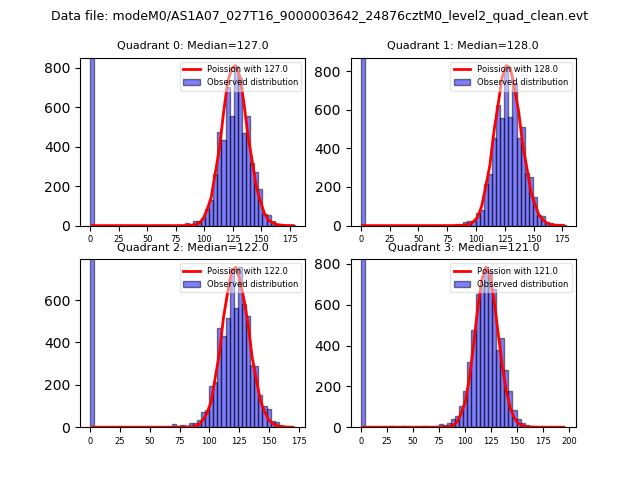 |
 |
| Quadrant-wise count rates Data is divided into 100 sec bins |
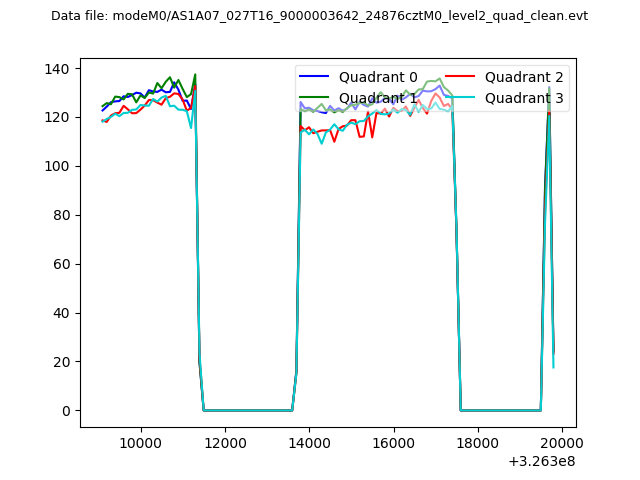 |
|
| Module-wise count rates for Quadrant A Data is divided into 100 sec bins |
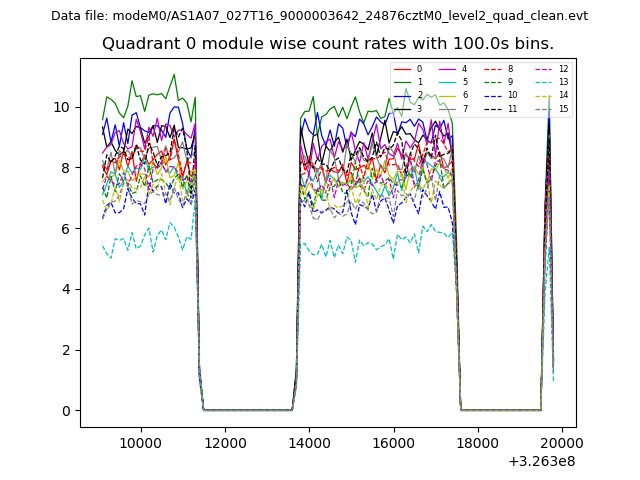 |
 |
| Module-wise count rates for Quadrant B Data is divided into 100 sec bins |
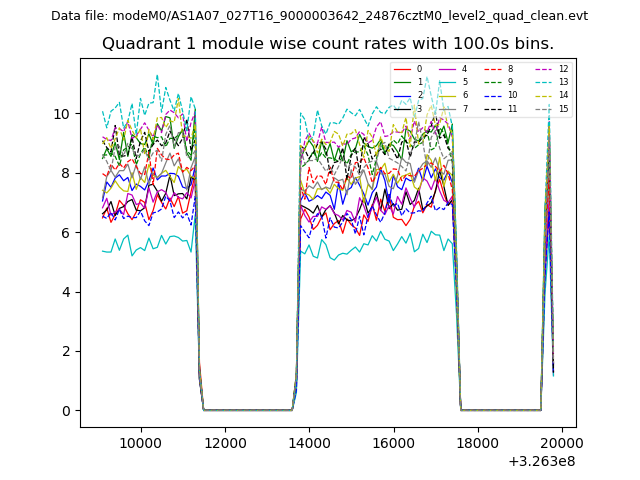 |
 |
| Module-wise count rates for Quadrant C Data is divided into 100 sec bins |
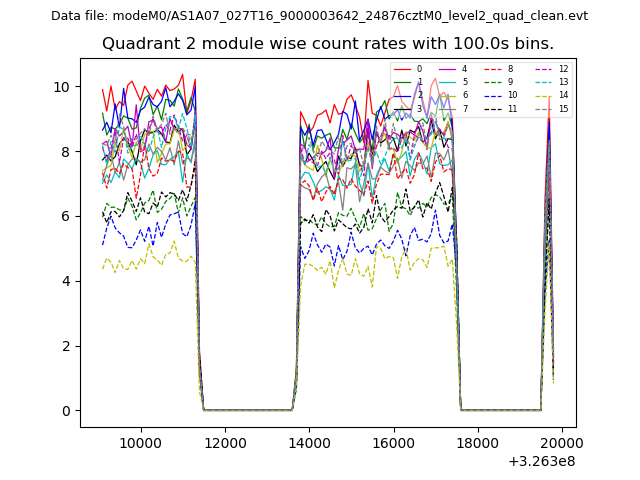 |
 |
| Module-wise count rates for Quadrant D Data is divided into 100 sec bins |
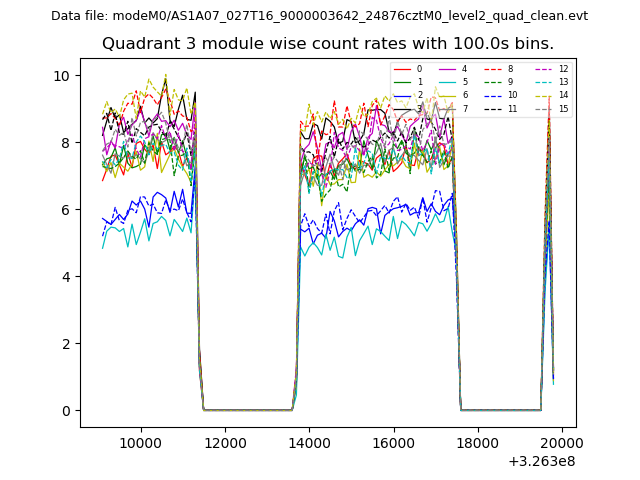 |
 |
| Parameter | Plot |
|---|---|
| CZT HV Monitor | 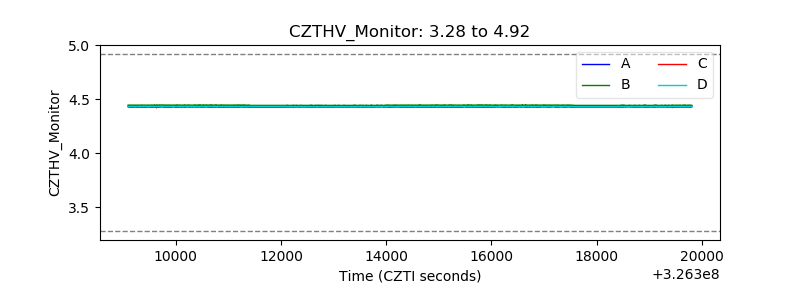 |
| D_VDD | 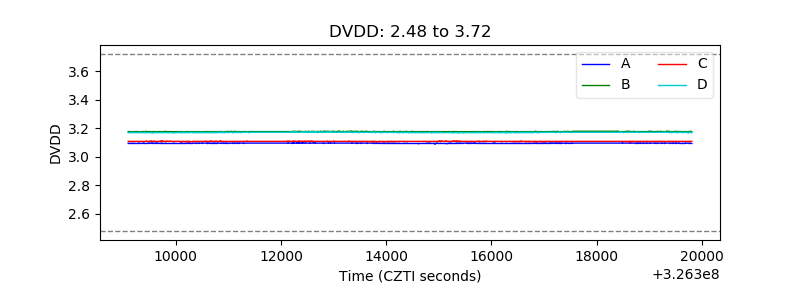 |
| Temperature 1 | 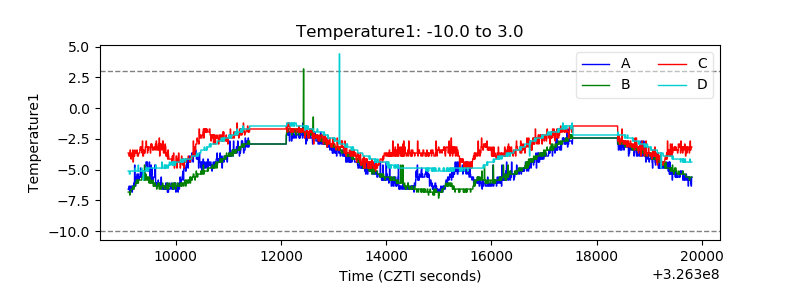 |
| Veto HV Monitor | 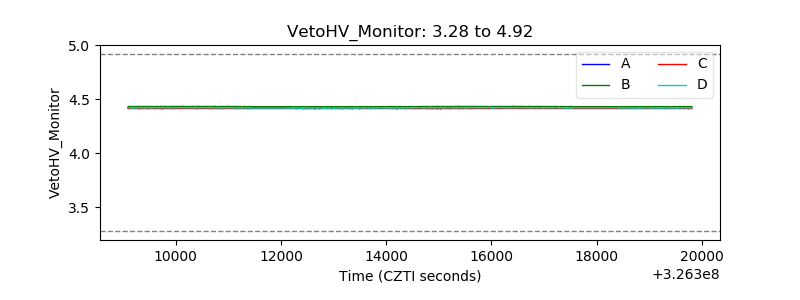 |
| Veto LLD | 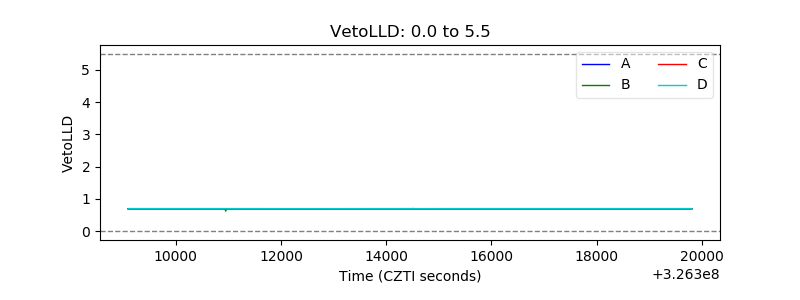 |
| Alpha Counter | 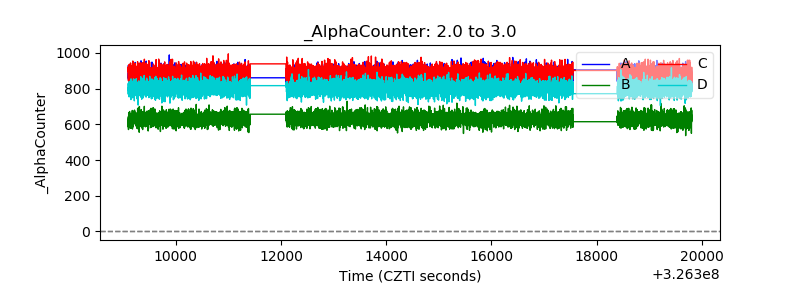 |
| _CPM_Rate | 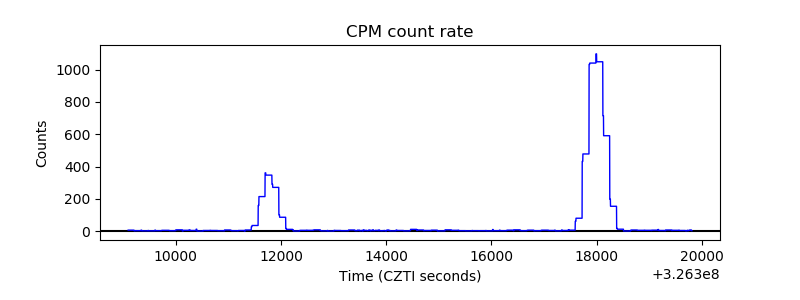 |
| CZT Counter |  |
| +2.5 Volts monitor |  |
| +5 Volts monitor | 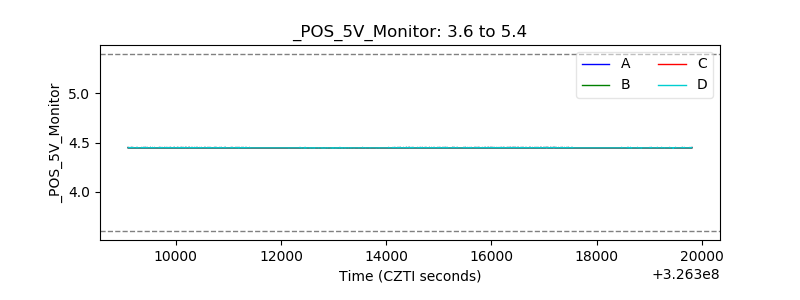 |
| _ROLL_ROT | 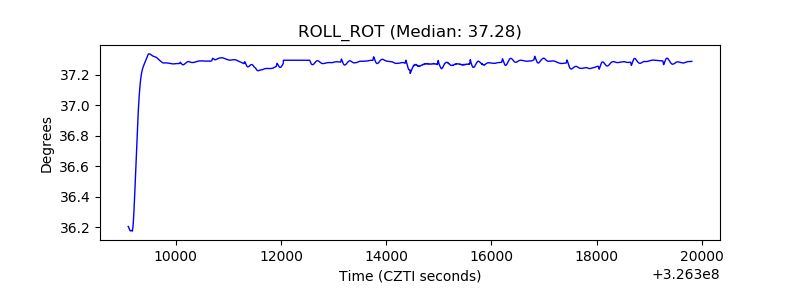 |
| _Roll_DEC | 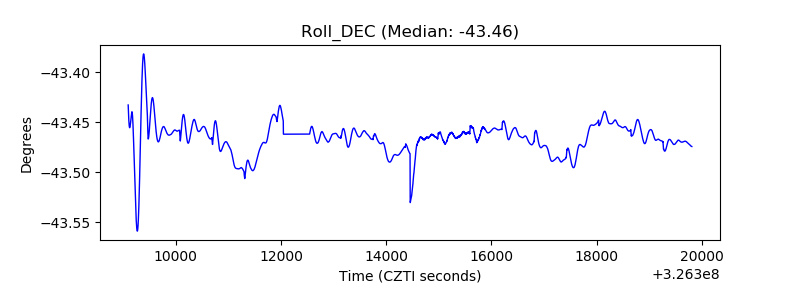 |
| _Roll_RA | 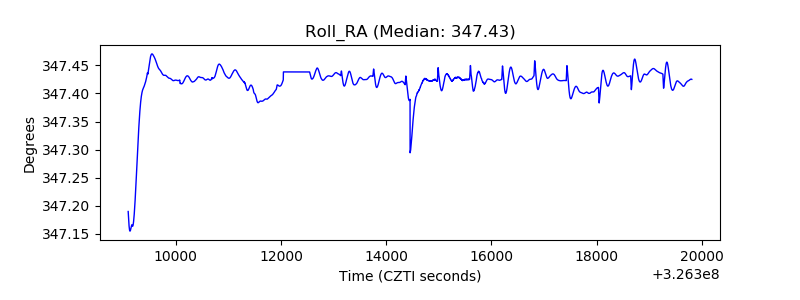 |
| Veto Counter | 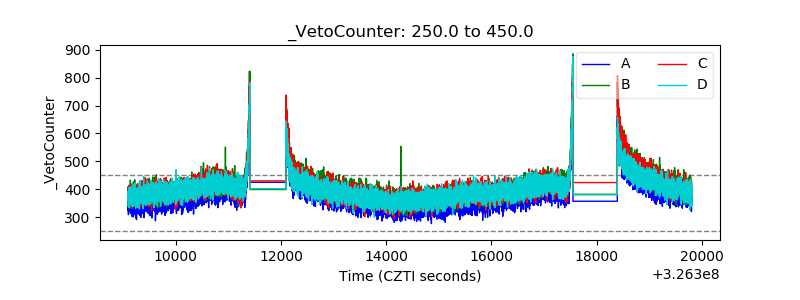 |