| Param | Original file | Final file |
|---|---|---|
| Filename | modeM0/AS1A07_027T16_9000003642_24879cztM0_level2.evt | modeM0/AS1A07_027T16_9000003642_24879cztM0_level2_quad_clean.evt |
| Size (bytes) | 618,960,960 | 100,025,280 |
| Size | 590.3 MB | 95.4 MB |
| Events in quadrant A | 3,247,471 | 678,458 |
| Events in quadrant B | 3,300,529 | 688,804 |
| Events in quadrant C | 5,069,090 | 611,401 |
| Events in quadrant D | 6,689,715 | 598,304 |
| Mode M9 | |||
|---|---|---|---|
| Quadrant | BADHDUFLAG | Total packets | Discarded packets |
| A | 0 | 20 | 0 |
| B | 0 | 21 | 0 |
| C | 0 | 21 | 0 |
| D | 0 | 21 | 0 |
| Mode M0 | |||
|---|---|---|---|
| Quadrant | BADHDUFLAG | Total packets | Discarded packets |
| A | 0 | 13768 | 1 |
| B | 0 | 13918 | 1 |
| C | 0 | 19291 | 1 |
| D | 0 | 24480 | 1 |
| Mode SS | |||
|---|---|---|---|
| Quadrant | BADHDUFLAG | Total packets | Discarded packets |
| A | 0 | 132 | 0 |
| B | 0 | 132 | 0 |
| C | 0 | 132 | 0 |
| D | 0 | 132 | 0 |
| Quadrant | Total seconds | Saturated seconds | Saturation percentage |
|---|---|---|---|
| A | 6475 | 35 | 0.540541% |
| B | 6475 | 53 | 0.818533% |
| C | 6475 | 652 | 10.069498% |
| D | 6474 | 1073 | 16.573988% |
Noise dominated data is calculated using 1-second bins in cleaned event files. If a bin has >2000 counts, and if more than 50% of those come from <1% of pixels, then it is considered to be noise-dominated and hence unusable.
| Quadrant | # 1 sec bins | Bins with >0 counts | Bins with >2000 counts | High rate bins dominated by noise | Noise dominated (total time) | Noise dominated (detector-on time) | Marked lightcurve |
|---|---|---|---|---|---|---|---|
| A | 7630 | 6476 | 0 | 0 | 0.00% | 0.00% | 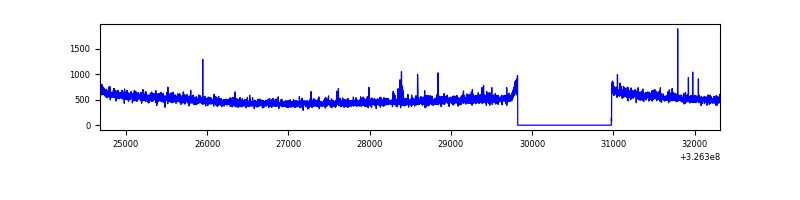 |
| B | 7630 | 6476 | 2 | 2 | 0.03% | 0.03% | 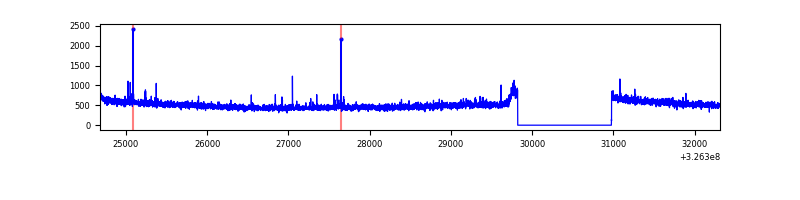 |
| C | 7630 | 6476 | 511 | 511 | 6.70% | 7.89% | 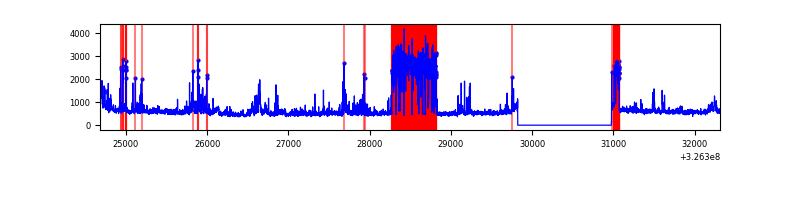 |
| D | 7629 | 6475 | 985 | 985 | 12.91% | 15.21% | 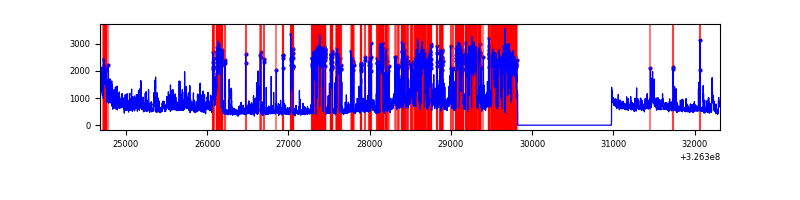 |
Top three noisy pixels from each quadrant. If the there are fewer than three noisy pixels in the level2.evt file, extra rows are filled as -1
| Pixel properties | Quadrant properties | ||||||
|---|---|---|---|---|---|---|---|
| Quadrant | DetID | PixID | Counts | Sigma | Mean | Median | Sigma |
| A | 6 | 16 | 29322 | 172.82 | 833 | 816 | 164.9 |
| A | 13 | 254 | 11225 | 63.1 | 833 | 816 | 164.9 |
| A | 3 | 137 | 7323 | 39.45 | 833 | 816 | 164.9 |
| B | 0 | 190 | 22267 | 138.04 | 829 | 812 | 155.4 |
| B | 12 | 111 | 18801 | 115.74 | 829 | 812 | 155.4 |
| B | 11 | 111 | 16886 | 103.42 | 829 | 812 | 155.4 |
| C | 2 | 16 | 1457776 | 8268.5 | 762 | 768 | 176.2 |
| C | 7 | 247 | 517691 | 2933.53 | 762 | 768 | 176.2 |
| C | 14 | 238 | 122056 | 688.31 | 762 | 768 | 176.2 |
| D | 1 | 52 | 3186004 | 17306.54 | 763 | 744 | 184.0 |
| D | 8 | 195 | 499809 | 2711.58 | 763 | 744 | 184.0 |
| D | 7 | 238 | 89728 | 483.48 | 763 | 744 | 184.0 |
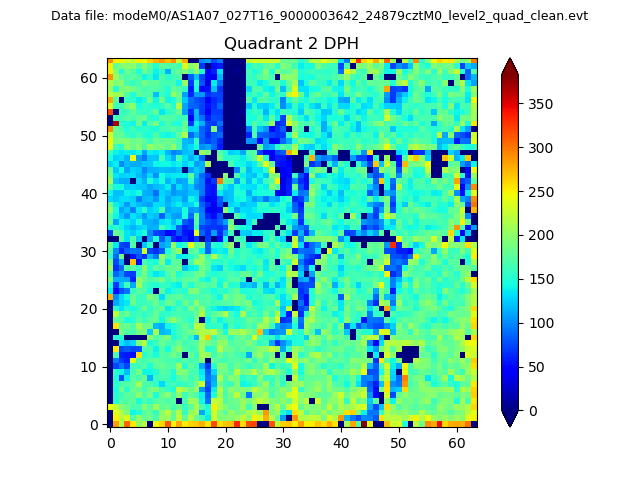
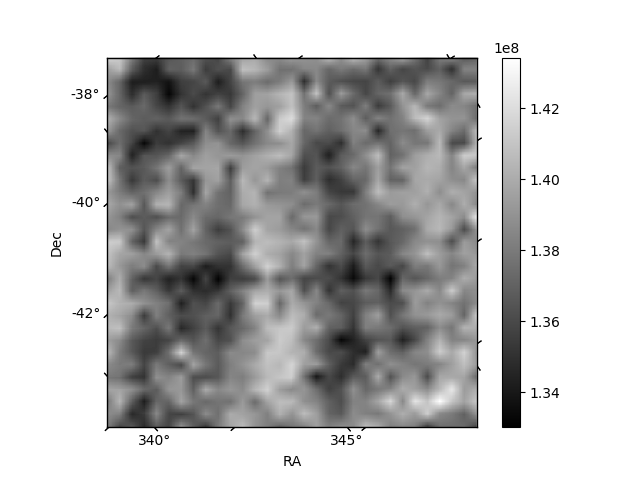
Histogram calculated using DETX and DETY for each event in the final _common_clean file
| Quadrant A | 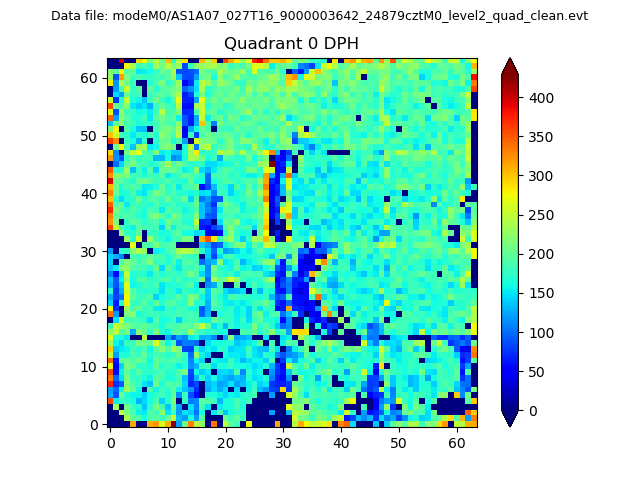 |
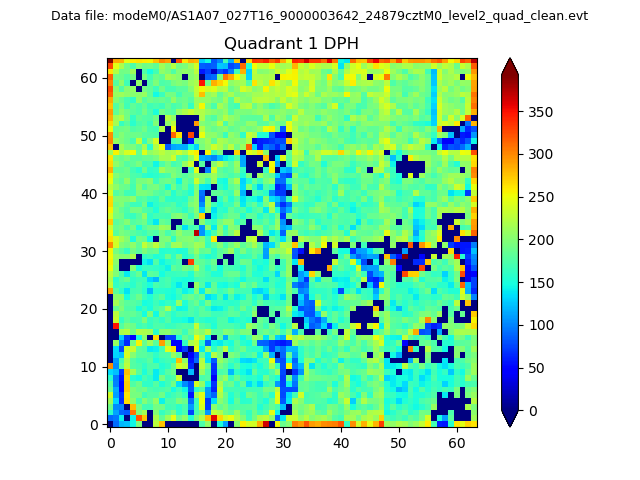 |
Quadrant B |
|---|---|---|---|
| Quadrant D | 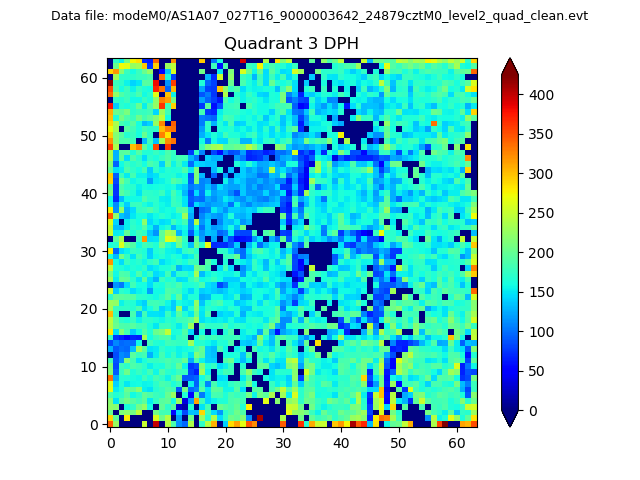 |
 |
Quadrant C |
| Plot type | Count rate plots | Images |
|---|---|---|
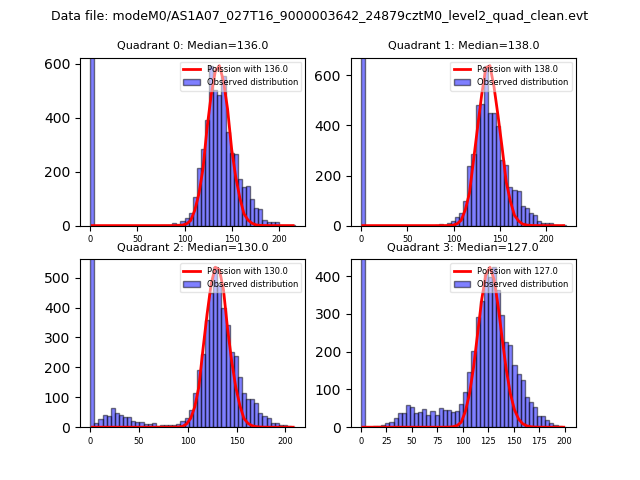
| Comparison with Poisson distribution Blue bars denote a histogram of data divided into 1 sec bins. Red curve is a Poisson curve with rate = median count rate of data. |
 |
 |
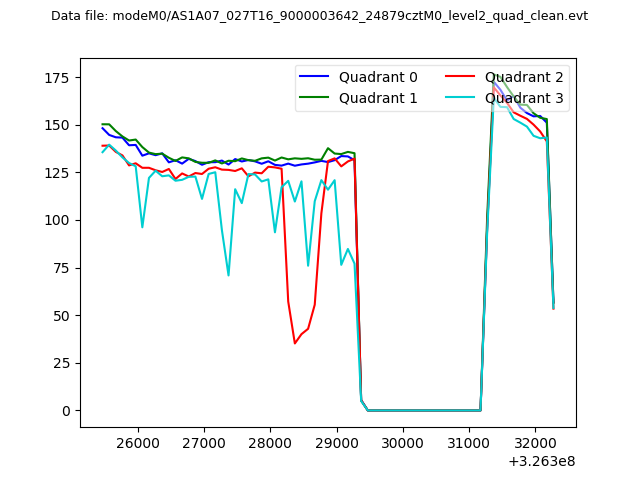
| Quadrant-wise count rates Data is divided into 100 sec bins |
 |
|
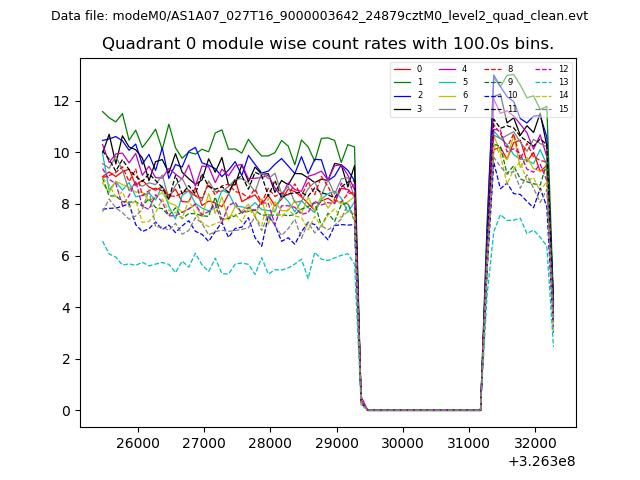
| Module-wise count rates for Quadrant A Data is divided into 100 sec bins |
 |
 |
| Module-wise count rates for Quadrant B Data is divided into 100 sec bins |
 |
 |
| Module-wise count rates for Quadrant C Data is divided into 100 sec bins |
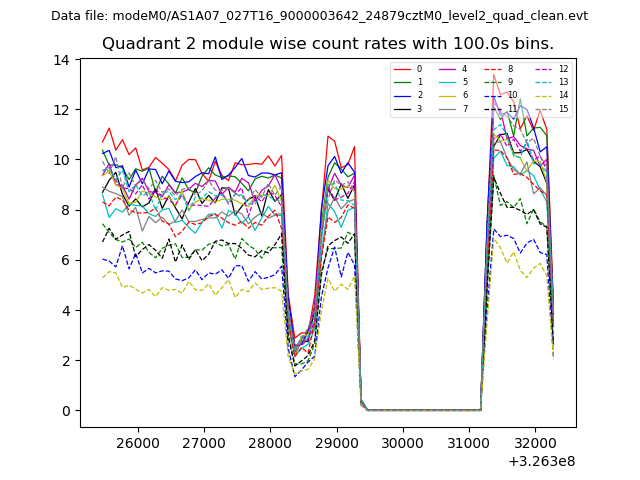 |
 |
| Module-wise count rates for Quadrant D Data is divided into 100 sec bins |
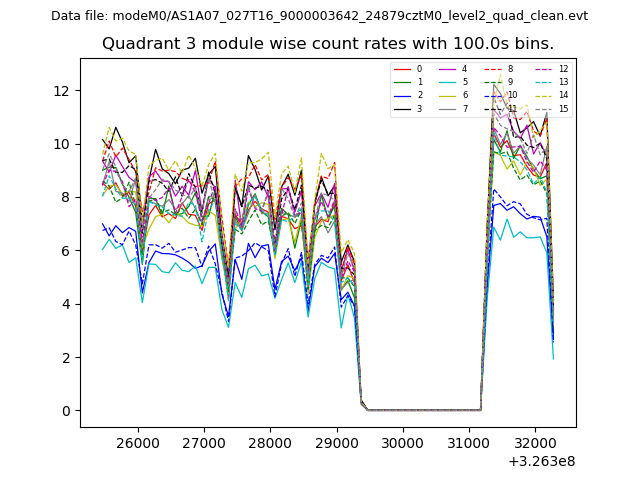 |
 |
| Parameter | Plot |
|---|---|
| CZT HV Monitor | 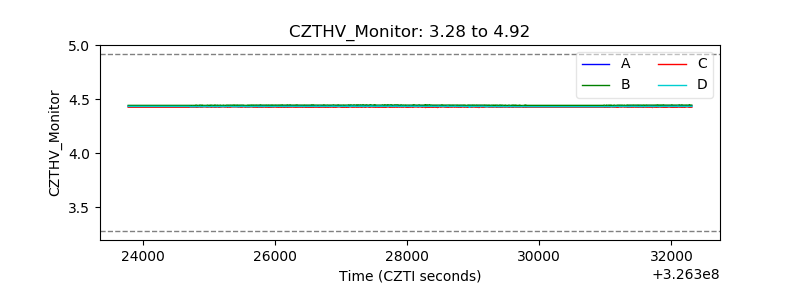 |
| D_VDD | 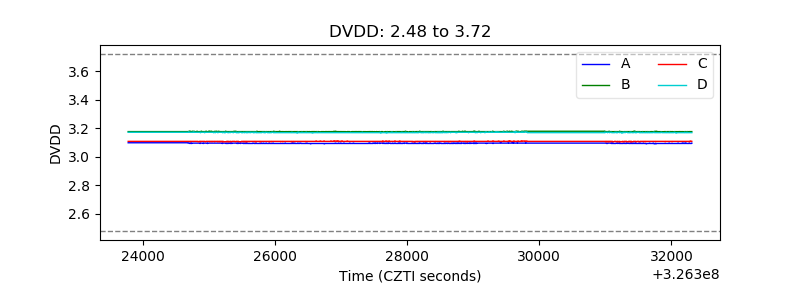 |
| Temperature 1 | 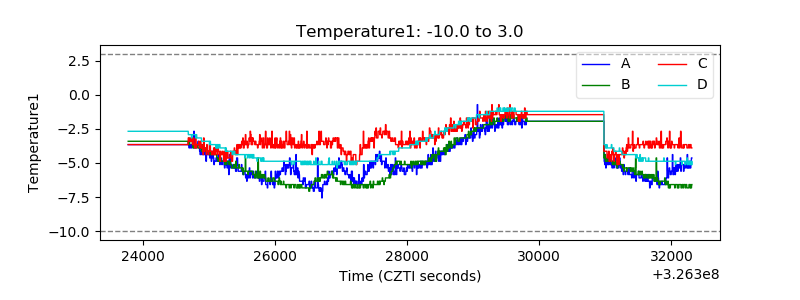 |
| Veto HV Monitor | 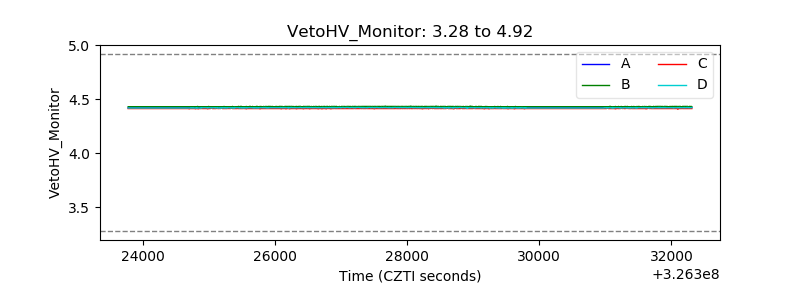 |
| Veto LLD | 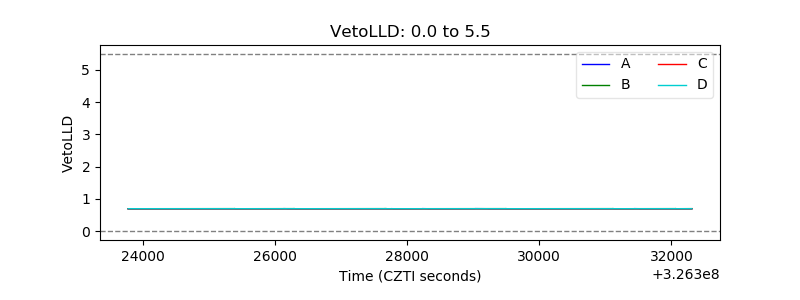 |
| Alpha Counter | 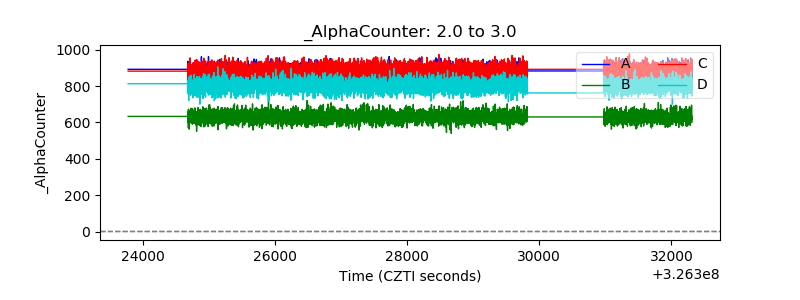 |
| _CPM_Rate | 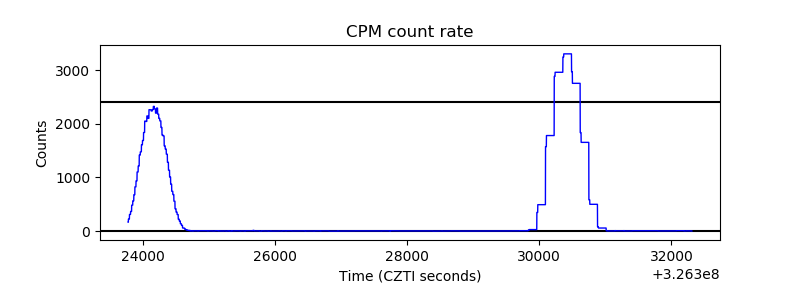 |
| CZT Counter | 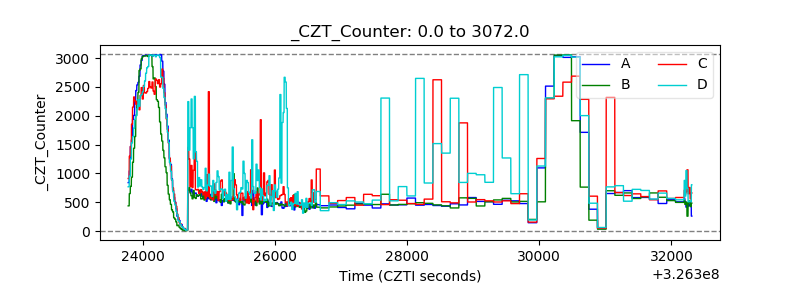 |
| +2.5 Volts monitor | 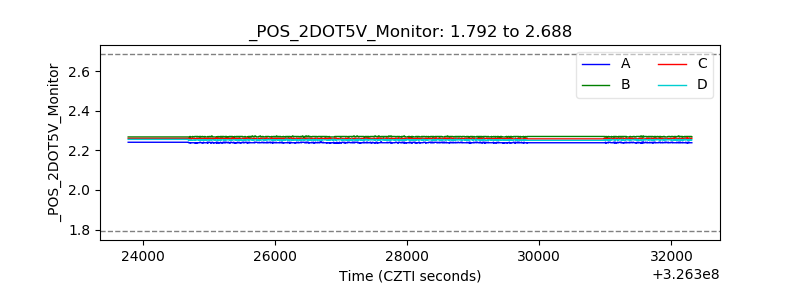 |
| +5 Volts monitor | 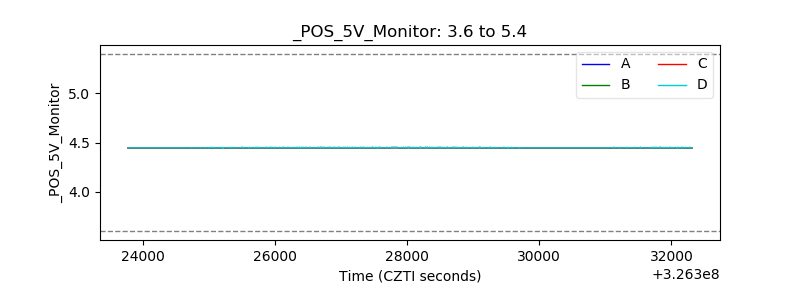 |
| _ROLL_ROT | 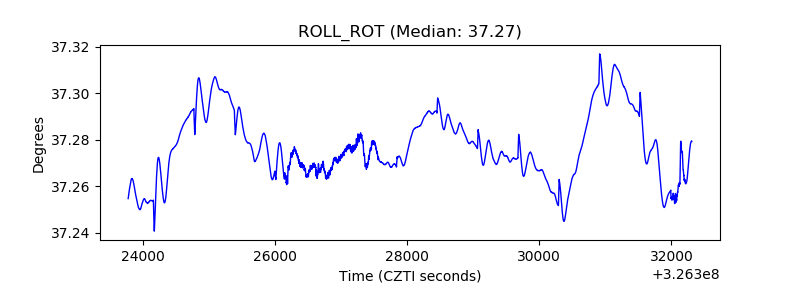 |
| _Roll_DEC | 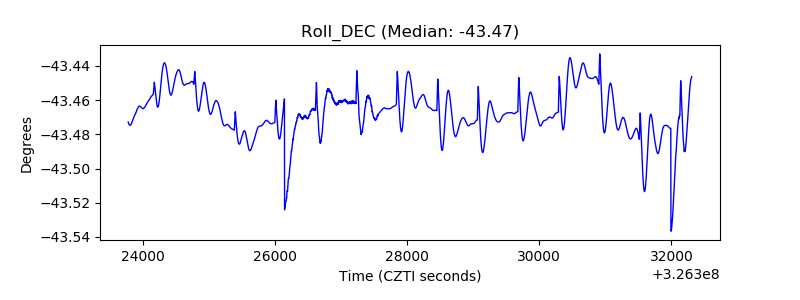 |
| _Roll_RA | 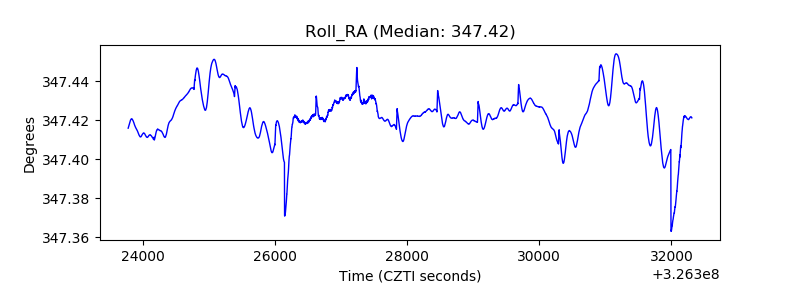 |
| Veto Counter | 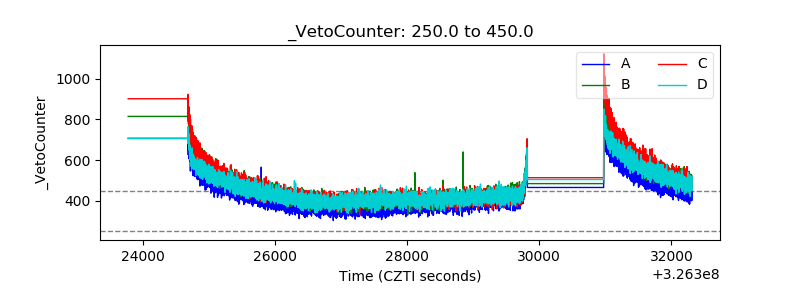 |