| Param | Original file | Final file |
|---|---|---|
| Filename | modeM0/AS1A07_027T16_9000003642_24881cztM0_level2.evt | modeM0/AS1A07_027T16_9000003642_24881cztM0_level2_quad_clean.evt |
| Size (bytes) | 519,459,840 | 122,993,280 |
| Size | 495.4 MB | 117.3 MB |
| Events in quadrant A | 3,253,136 | 826,872 |
| Events in quadrant B | 3,338,486 | 848,793 |
| Events in quadrant C | 3,879,615 | 820,561 |
| Events in quadrant D | 4,839,321 | 794,917 |
| Mode M9 | |||
|---|---|---|---|
| Quadrant | BADHDUFLAG | Total packets | Discarded packets |
| A | 0 | 17 | 0 |
| B | 0 | 18 | 0 |
| C | 0 | 18 | 0 |
| D | 0 | 18 | 0 |
| Mode M0 | |||
|---|---|---|---|
| Quadrant | BADHDUFLAG | Total packets | Discarded packets |
| A | 0 | 13453 | 2 |
| B | 0 | 13802 | 2 |
| C | 0 | 15425 | 2 |
| D | 0 | 18640 | 2 |
| Mode SS | |||
|---|---|---|---|
| Quadrant | BADHDUFLAG | Total packets | Discarded packets |
| A | 0 | 128 | 0 |
| B | 0 | 128 | 0 |
| C | 0 | 128 | 0 |
| D | 0 | 128 | 0 |
| Quadrant | Total seconds | Saturated seconds | Saturation percentage |
|---|---|---|---|
| A | 6211 | 9 | 0.144904% |
| B | 6211 | 28 | 0.450813% |
| C | 6211 | 170 | 2.737079% |
| D | 6211 | 271 | 4.363227% |
Noise dominated data is calculated using 1-second bins in cleaned event files. If a bin has >2000 counts, and if more than 50% of those come from <1% of pixels, then it is considered to be noise-dominated and hence unusable.
| Quadrant | # 1 sec bins | Bins with >0 counts | Bins with >2000 counts | High rate bins dominated by noise | Noise dominated (total time) | Noise dominated (detector-on time) | Marked lightcurve |
|---|---|---|---|---|---|---|---|
| A | 7566 | 6212 | 0 | 0 | 0.00% | 0.00% | 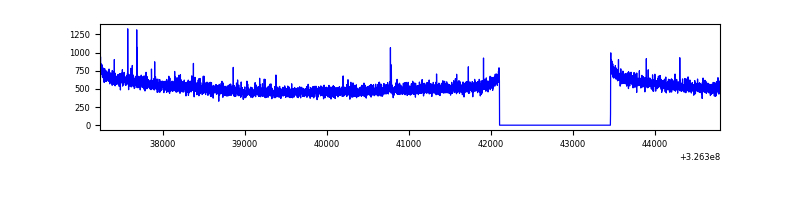 |
| B | 7566 | 6212 | 1 | 1 | 0.01% | 0.02% | 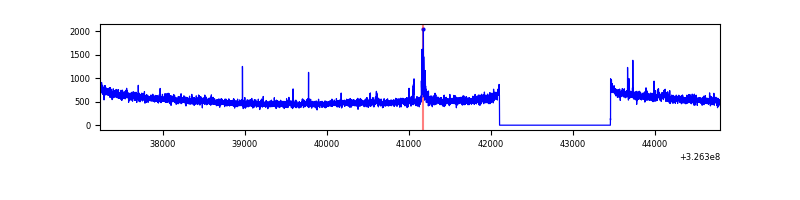 |
| C | 7566 | 6212 | 29 | 29 | 0.38% | 0.47% | 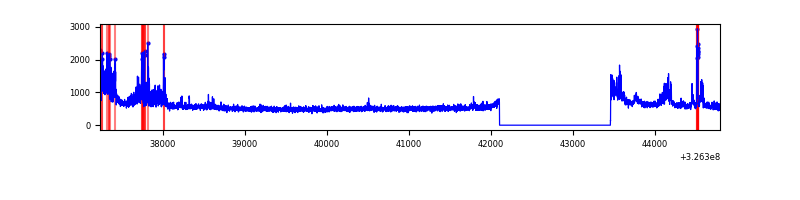 |
| D | 7566 | 6212 | 259 | 259 | 3.42% | 4.17% | 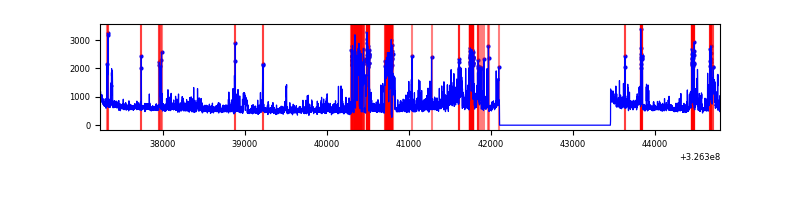 |
Top three noisy pixels from each quadrant. If the there are fewer than three noisy pixels in the level2.evt file, extra rows are filled as -1
| Pixel properties | Quadrant properties | ||||||
|---|---|---|---|---|---|---|---|
| Quadrant | DetID | PixID | Counts | Sigma | Mean | Median | Sigma |
| A | 6 | 16 | 16954 | 98.69 | 837 | 825 | 163.4 |
| A | 13 | 254 | 9833 | 55.12 | 837 | 825 | 163.4 |
| A | 0 | 226 | 7095 | 38.36 | 837 | 825 | 163.4 |
| B | 0 | 190 | 30727 | 192.96 | 837 | 817 | 155.0 |
| B | 12 | 111 | 17975 | 110.69 | 837 | 817 | 155.0 |
| B | 11 | 111 | 16106 | 98.64 | 837 | 817 | 155.0 |
| C | 7 | 247 | 492042 | 2567.11 | 832 | 839 | 191.3 |
| C | 14 | 238 | 133965 | 695.74 | 832 | 839 | 191.3 |
| C | 0 | 10 | 10457 | 50.27 | 832 | 839 | 191.3 |
| D | 1 | 52 | 1102594 | 5523.11 | 832 | 810 | 199.5 |
| D | 8 | 195 | 504349 | 2524.18 | 832 | 810 | 199.5 |
| D | 7 | 238 | 94452 | 469.42 | 832 | 810 | 199.5 |
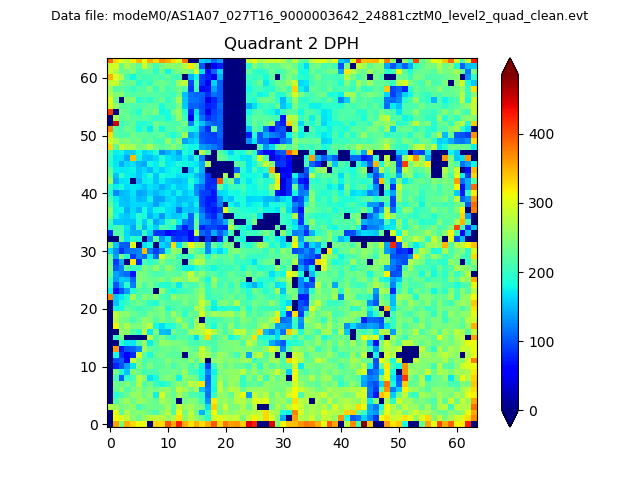
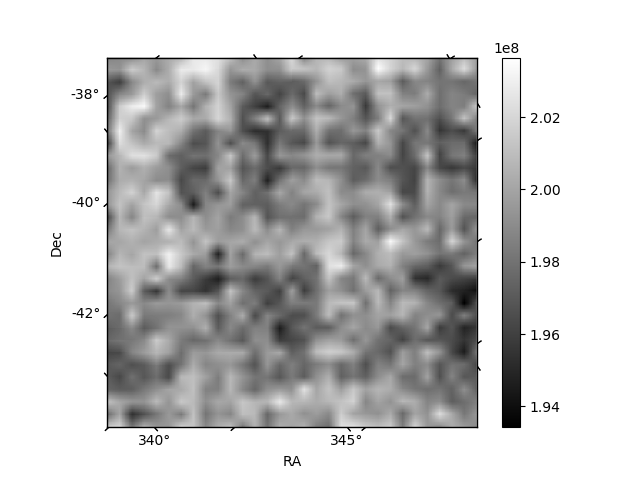
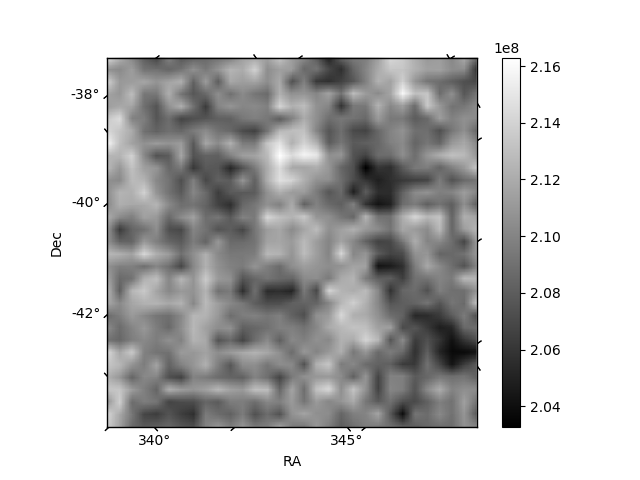
Histogram calculated using DETX and DETY for each event in the final _common_clean file
| Quadrant A | 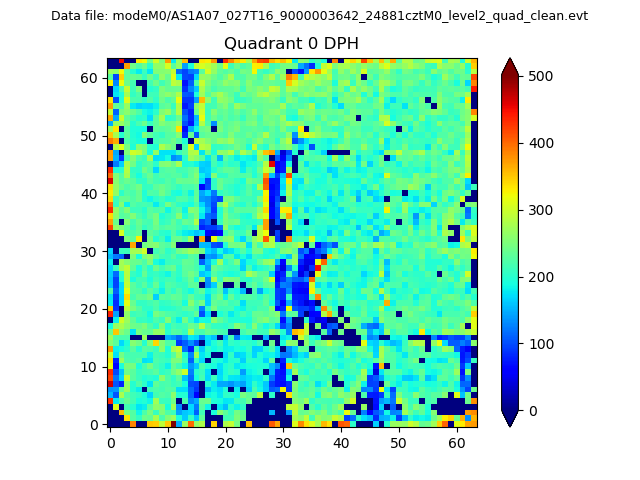 |
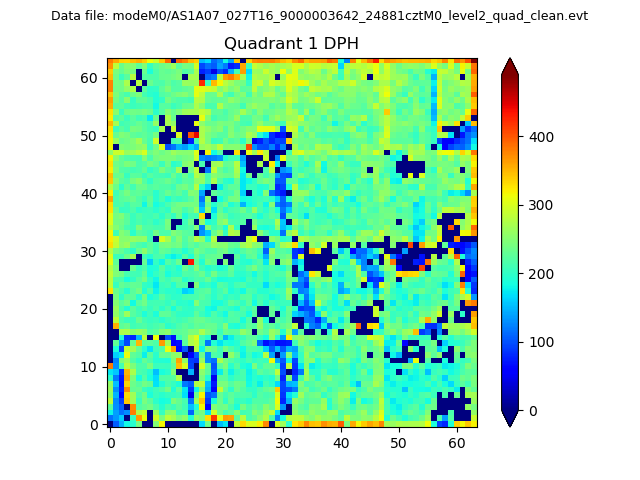 |
Quadrant B |
|---|---|---|---|
| Quadrant D | 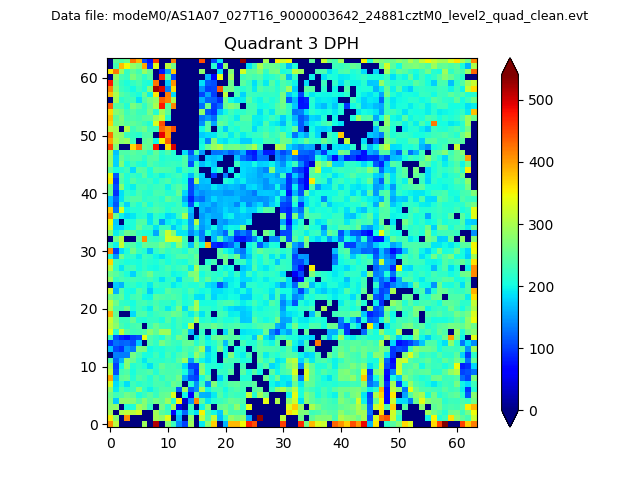 |
 |
Quadrant C |
| Plot type | Count rate plots | Images |
|---|---|---|
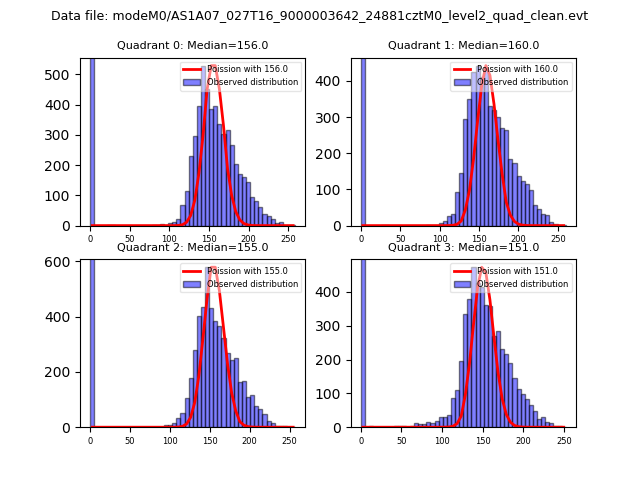
| Comparison with Poisson distribution Blue bars denote a histogram of data divided into 1 sec bins. Red curve is a Poisson curve with rate = median count rate of data. |
 |
 |
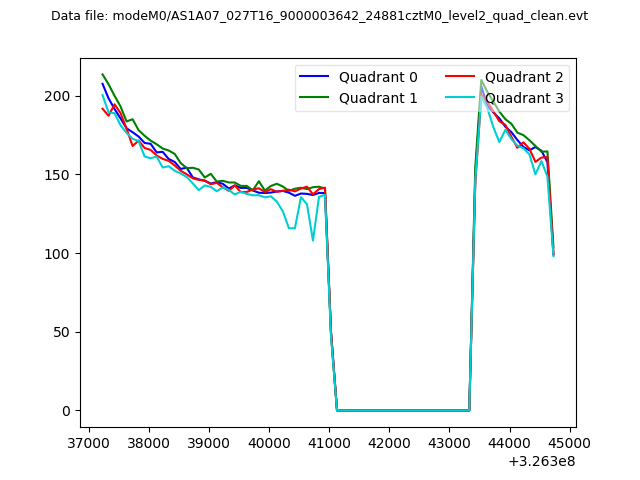
| Quadrant-wise count rates Data is divided into 100 sec bins |
 |
|
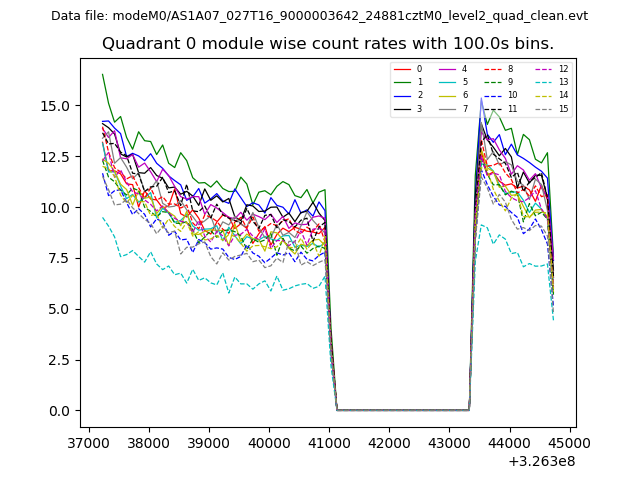
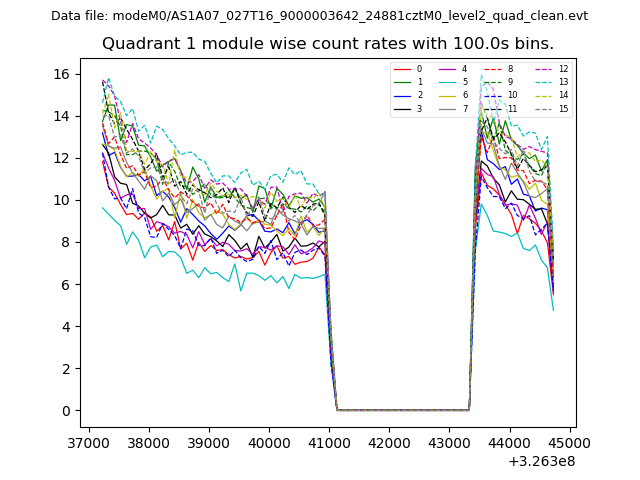
| Module-wise count rates for Quadrant A Data is divided into 100 sec bins |
 |
 |
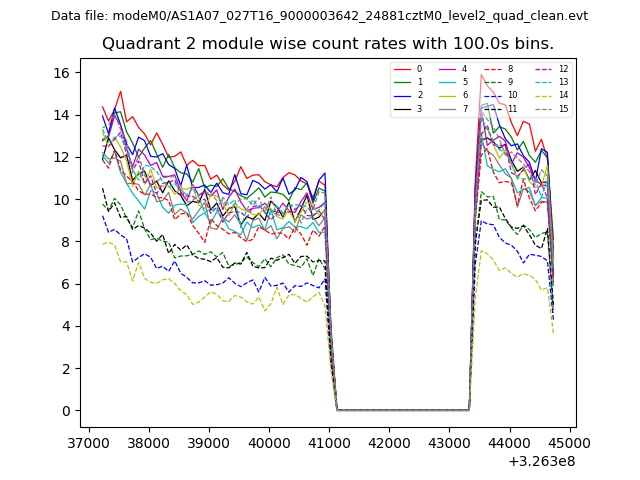
| Module-wise count rates for Quadrant B Data is divided into 100 sec bins |
 |
 |
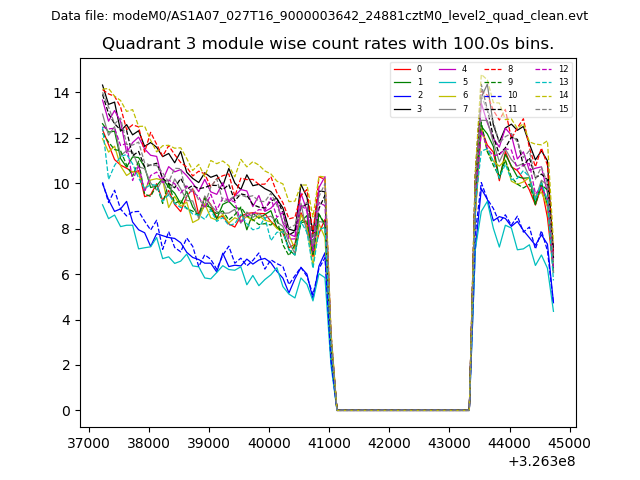
| Module-wise count rates for Quadrant C Data is divided into 100 sec bins |
 |
 |
| Module-wise count rates for Quadrant D Data is divided into 100 sec bins |
 |
 |
| Parameter | Plot |
|---|---|
| CZT HV Monitor | 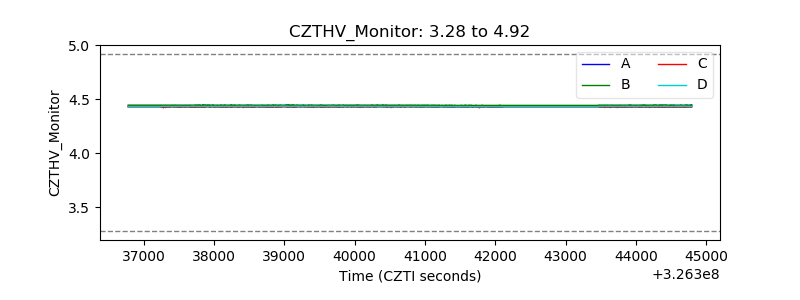 |
| D_VDD | 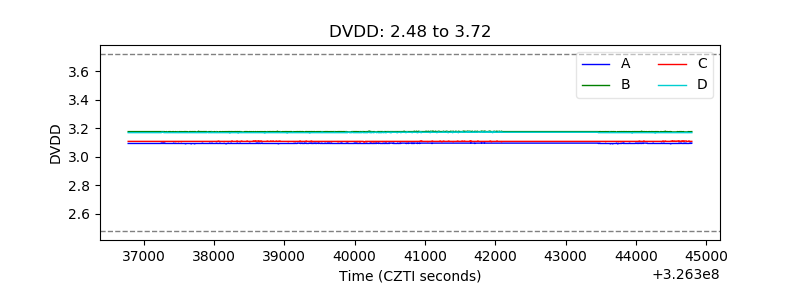 |
| Temperature 1 | 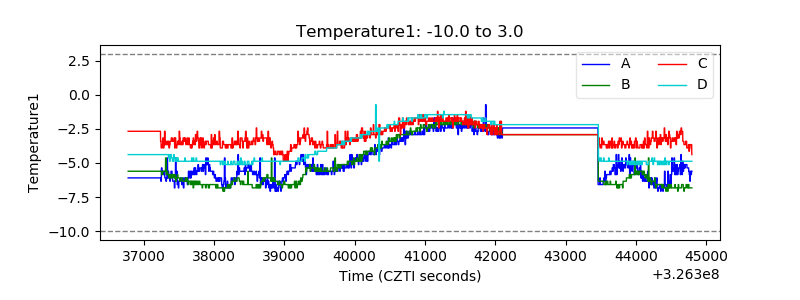 |
| Veto HV Monitor | 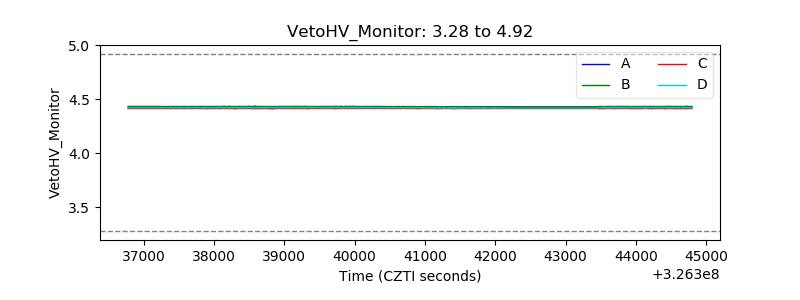 |
| Veto LLD | 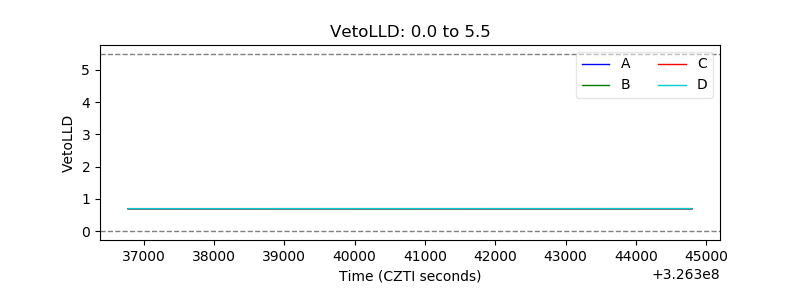 |
| Alpha Counter | 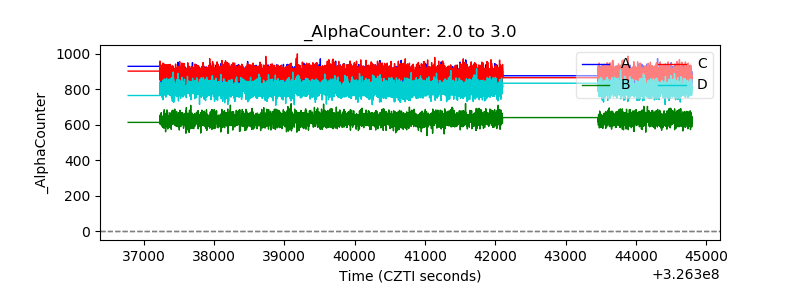 |
| _CPM_Rate | 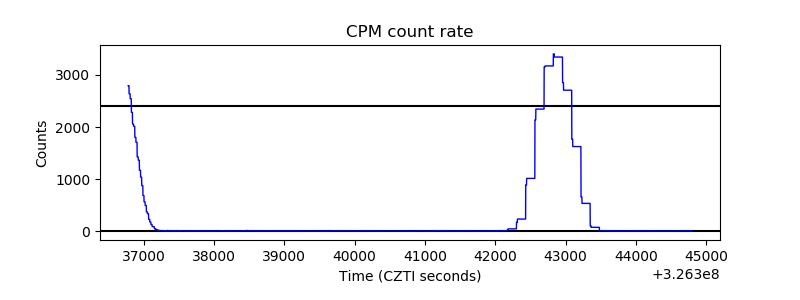 |
| CZT Counter | 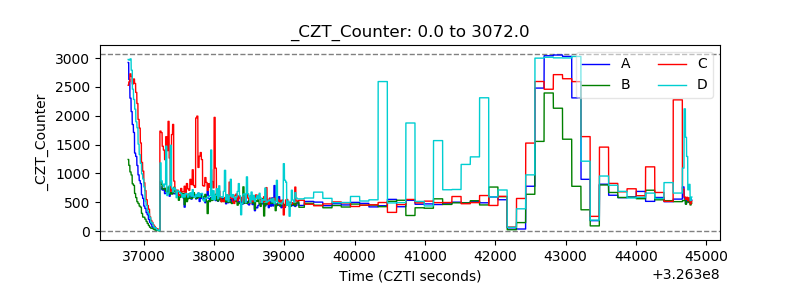 |
| +2.5 Volts monitor | 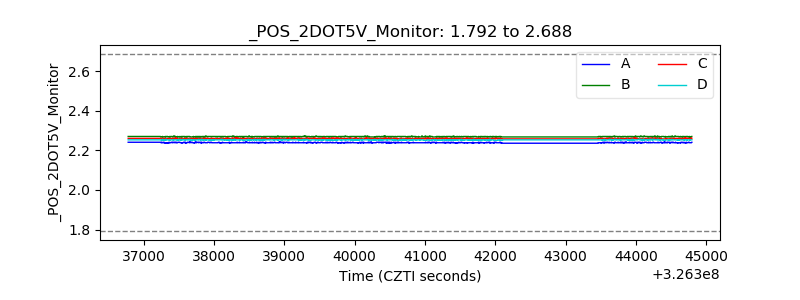 |
| +5 Volts monitor |  |
| _ROLL_ROT | 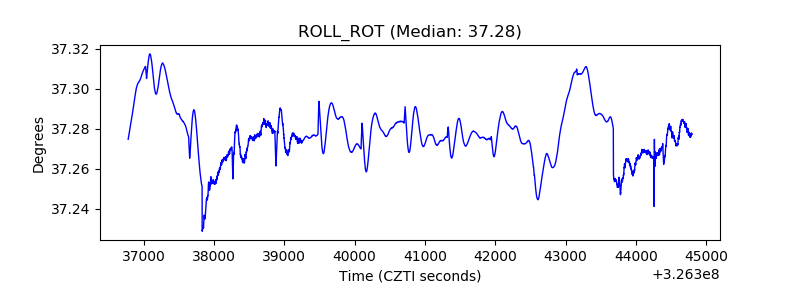 |
| _Roll_DEC | 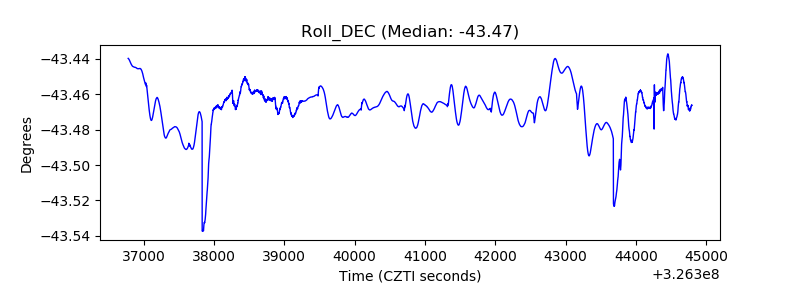 |
| _Roll_RA | 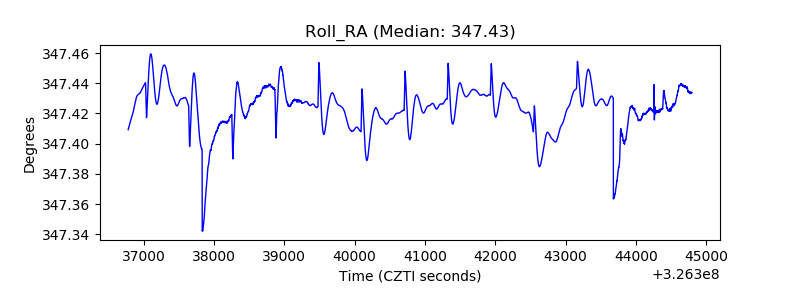 |
| Veto Counter | 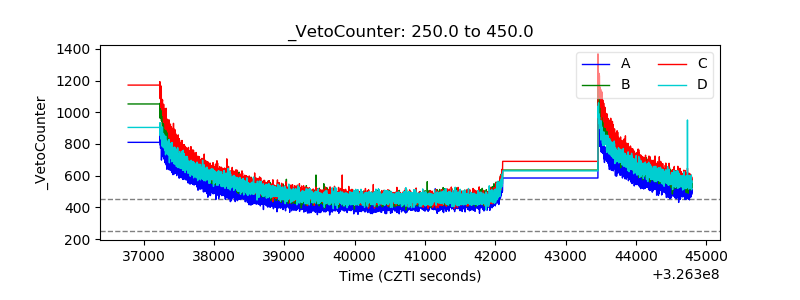 |