| Param | Original file | Final file |
|---|---|---|
| Filename | modeM0/AS1A07_027T16_9000003642_24882cztM0_level2.evt | modeM0/AS1A07_027T16_9000003642_24882cztM0_level2_quad_clean.evt |
| Size (bytes) | 514,388,160 | 115,724,160 |
| Size | 490.6 MB | 110.4 MB |
| Events in quadrant A | 3,245,093 | 772,878 |
| Events in quadrant B | 3,316,222 | 793,327 |
| Events in quadrant C | 3,943,352 | 764,644 |
| Events in quadrant D | 4,652,765 | 740,692 |
| Mode M9 | |||
|---|---|---|---|
| Quadrant | BADHDUFLAG | Total packets | Discarded packets |
| A | 0 | 16 | 0 |
| B | 0 | 17 | 0 |
| C | 0 | 17 | 0 |
| D | 0 | 17 | 0 |
| Mode M0 | |||
|---|---|---|---|
| Quadrant | BADHDUFLAG | Total packets | Discarded packets |
| A | 0 | 13348 | 2 |
| B | 0 | 13690 | 2 |
| C | 0 | 15627 | 2 |
| D | 0 | 17990 | 2 |
| Mode SS | |||
|---|---|---|---|
| Quadrant | BADHDUFLAG | Total packets | Discarded packets |
| A | 0 | 126 | 0 |
| B | 0 | 126 | 0 |
| C | 0 | 126 | 0 |
| D | 0 | 126 | 0 |
| Quadrant | Total seconds | Saturated seconds | Saturation percentage |
|---|---|---|---|
| A | 6209 | 16 | 0.257690% |
| B | 6209 | 26 | 0.418747% |
| C | 6209 | 263 | 4.235787% |
| D | 6209 | 235 | 3.784828% |
Noise dominated data is calculated using 1-second bins in cleaned event files. If a bin has >2000 counts, and if more than 50% of those come from <1% of pixels, then it is considered to be noise-dominated and hence unusable.
| Quadrant | # 1 sec bins | Bins with >0 counts | Bins with >2000 counts | High rate bins dominated by noise | Noise dominated (total time) | Noise dominated (detector-on time) | Marked lightcurve |
|---|---|---|---|---|---|---|---|
| A | 7589 | 6210 | 0 | 0 | 0.00% | 0.00% | 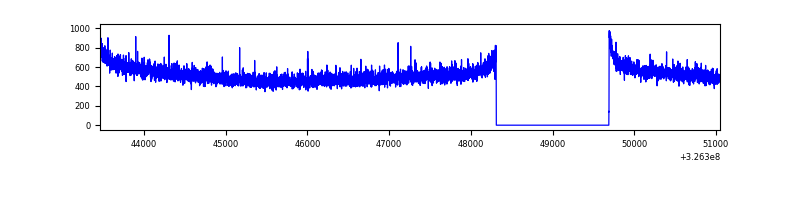 |
| B | 7589 | 6210 | 1 | 1 | 0.01% | 0.02% | 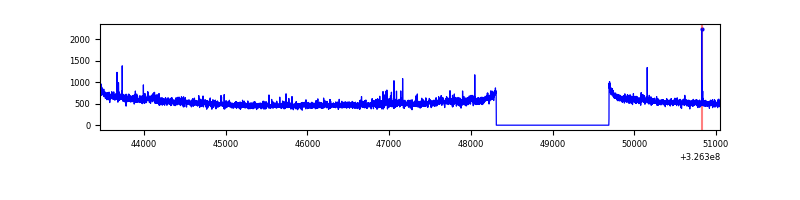 |
| C | 7589 | 6210 | 132 | 132 | 1.74% | 2.13% | 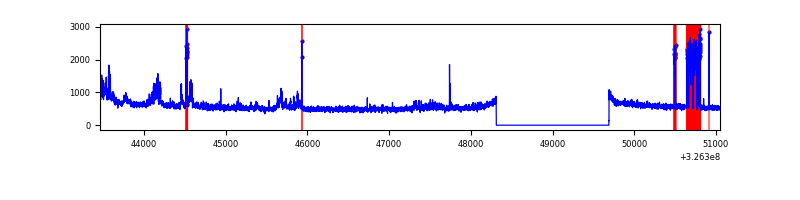 |
| D | 7589 | 6210 | 168 | 168 | 2.21% | 2.71% | 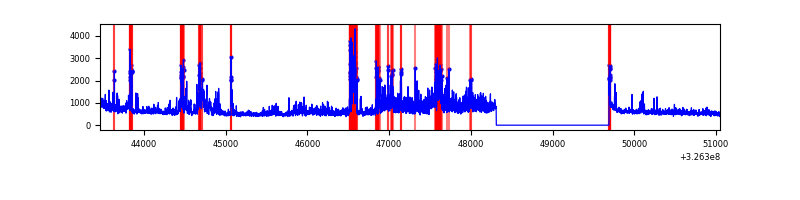 |
Top three noisy pixels from each quadrant. If the there are fewer than three noisy pixels in the level2.evt file, extra rows are filled as -1
| Pixel properties | Quadrant properties | ||||||
|---|---|---|---|---|---|---|---|
| Quadrant | DetID | PixID | Counts | Sigma | Mean | Median | Sigma |
| A | 13 | 254 | 10156 | 56.26 | 840 | 825 | 165.9 |
| A | 0 | 226 | 7210 | 38.5 | 840 | 825 | 165.9 |
| A | 6 | 16 | 7161 | 38.2 | 840 | 825 | 165.9 |
| B | 12 | 111 | 17695 | 108.82 | 835 | 817 | 155.1 |
| B | 0 | 229 | 16924 | 103.85 | 835 | 817 | 155.1 |
| B | 11 | 111 | 16119 | 98.66 | 835 | 817 | 155.1 |
| C | 7 | 247 | 578403 | 3040.73 | 827 | 836 | 189.9 |
| C | 14 | 238 | 132796 | 694.73 | 827 | 836 | 189.9 |
| C | 0 | 10 | 5795 | 26.11 | 827 | 836 | 189.9 |
| D | 1 | 52 | 672156 | 3371.7 | 829 | 808 | 199.1 |
| D | 8 | 195 | 622695 | 3123.29 | 829 | 808 | 199.1 |
| D | 7 | 238 | 237424 | 1188.35 | 829 | 808 | 199.1 |
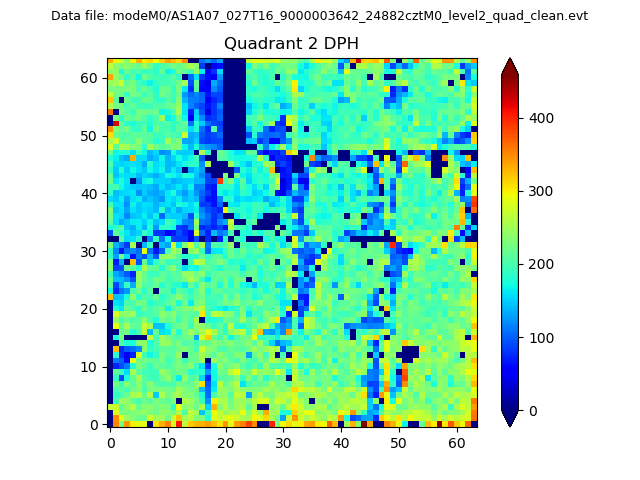
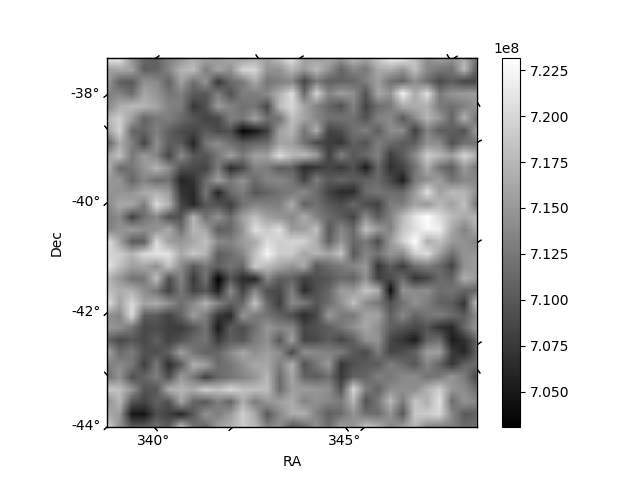
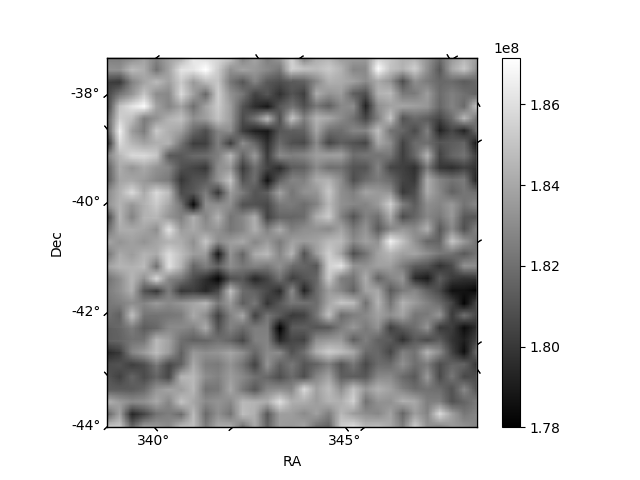
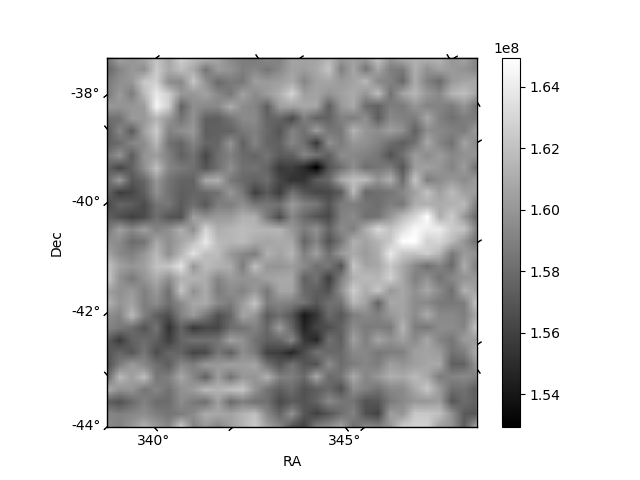
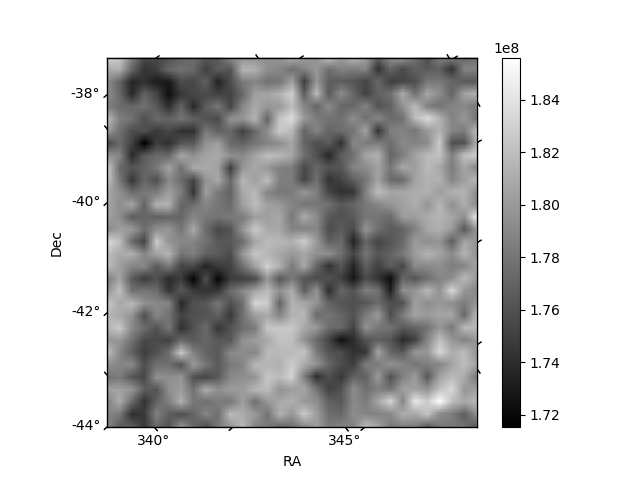
Histogram calculated using DETX and DETY for each event in the final _common_clean file
| Quadrant A | 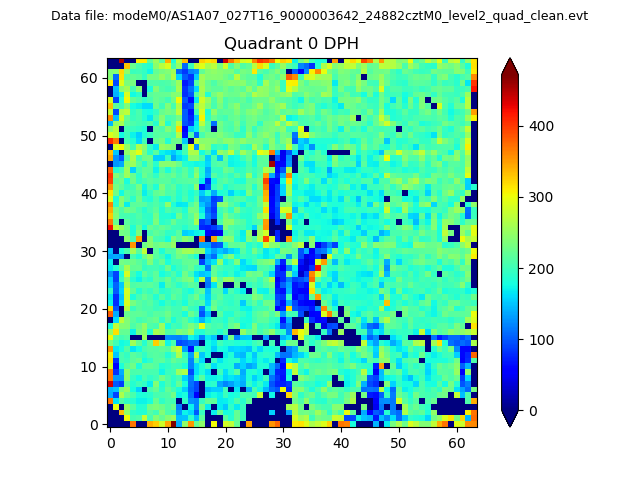 |
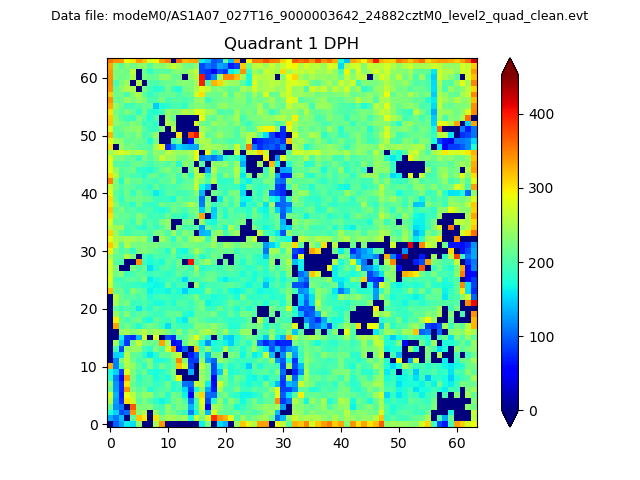 |
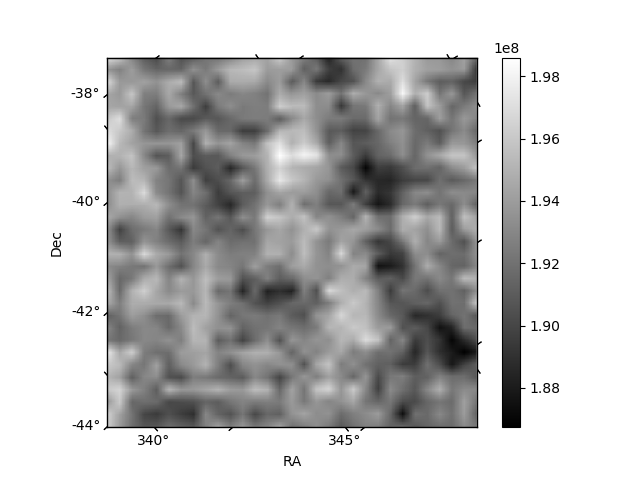
Quadrant B |
|---|---|---|---|
| Quadrant D | 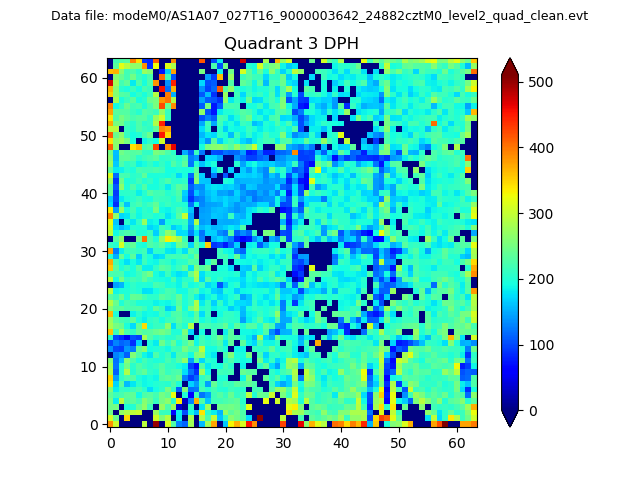 |
 |
Quadrant C |
| Plot type | Count rate plots | Images |
|---|---|---|
| Comparison with Poisson distribution Blue bars denote a histogram of data divided into 1 sec bins. Red curve is a Poisson curve with rate = median count rate of data. |
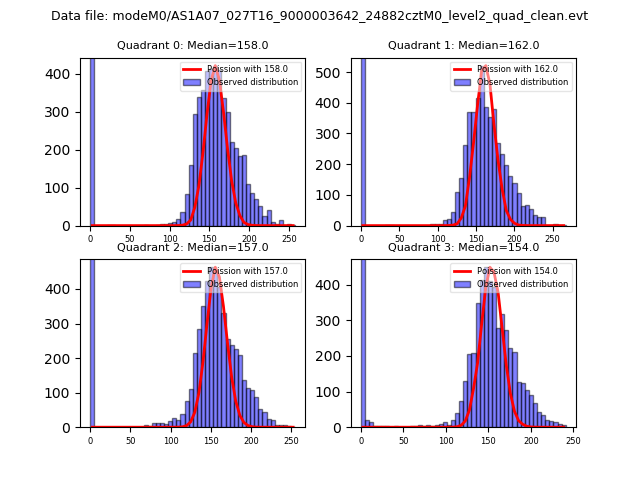 |
 |
| Quadrant-wise count rates Data is divided into 100 sec bins |
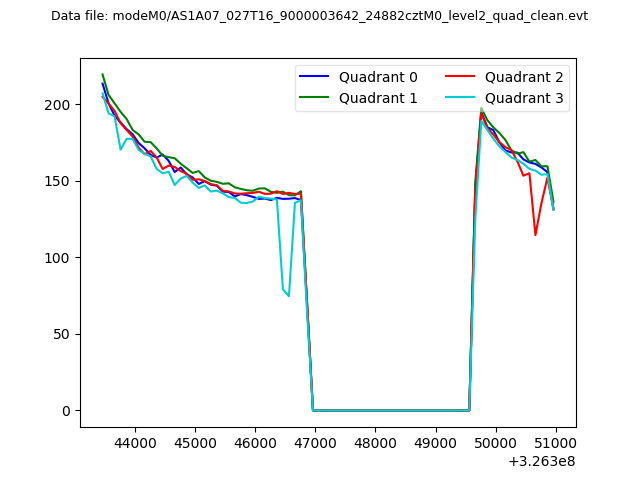 |
|
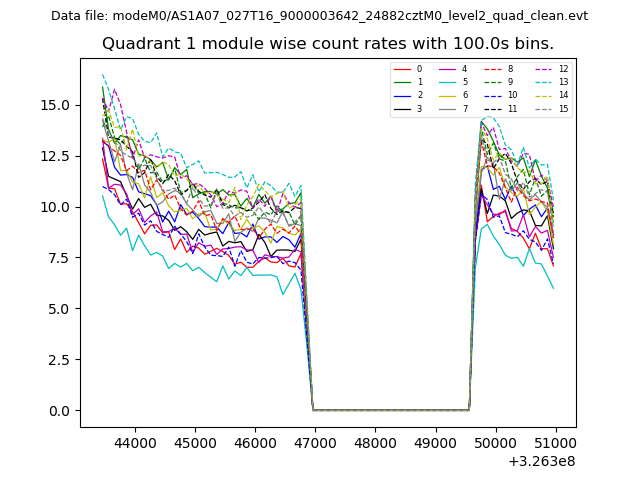
| Module-wise count rates for Quadrant A Data is divided into 100 sec bins |
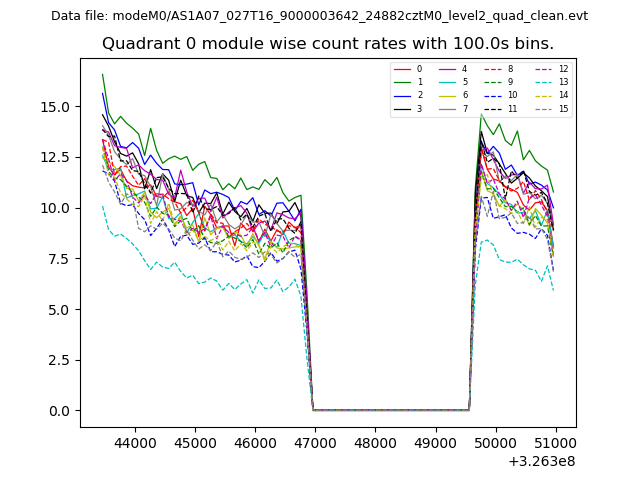 |
 |
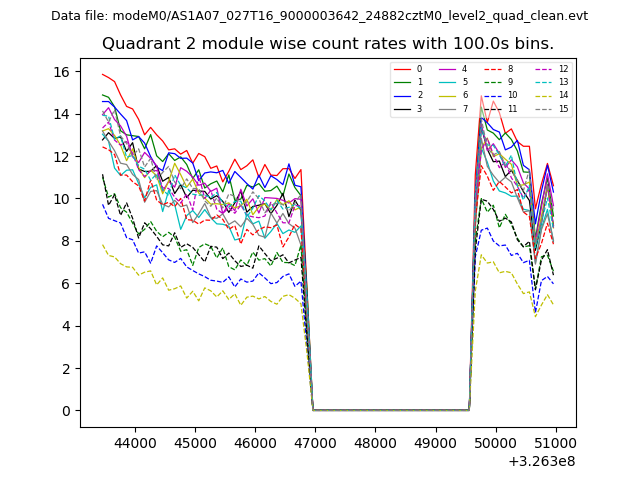
| Module-wise count rates for Quadrant B Data is divided into 100 sec bins |
 |
 |
| Module-wise count rates for Quadrant C Data is divided into 100 sec bins |
 |
 |
| Module-wise count rates for Quadrant D Data is divided into 100 sec bins |
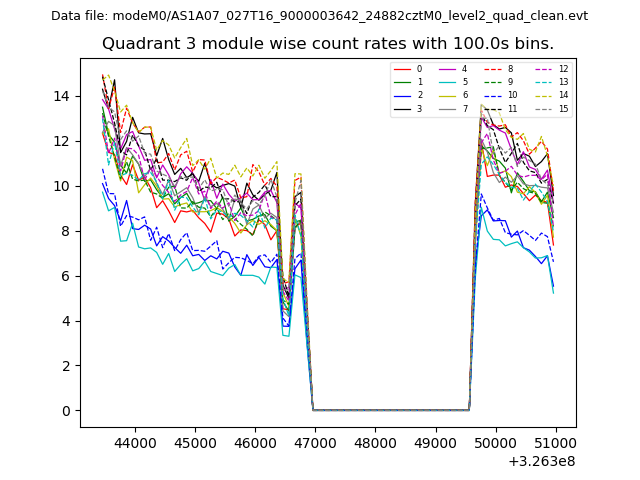 |
 |
| Parameter | Plot |
|---|---|
| CZT HV Monitor | 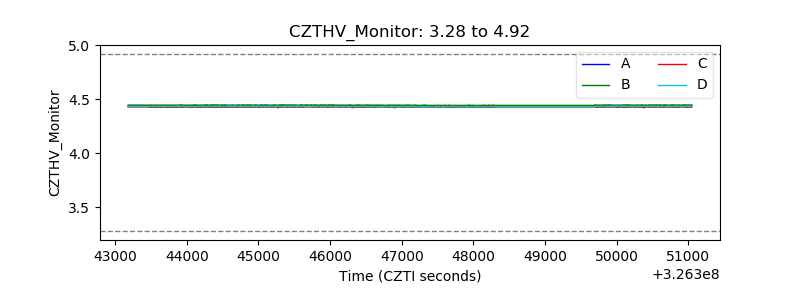 |
| D_VDD | 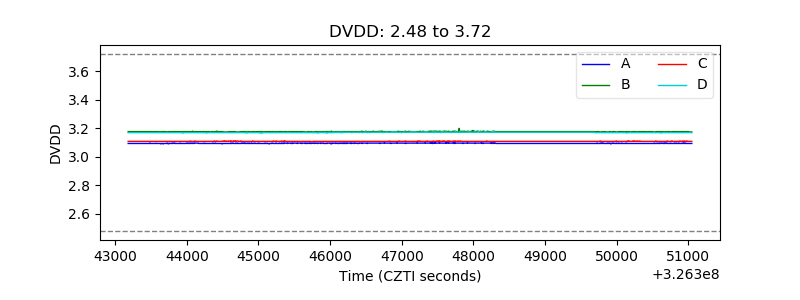 |
| Temperature 1 | 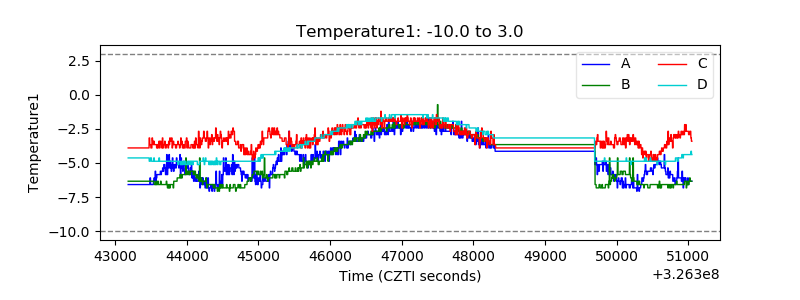 |
| Veto HV Monitor | 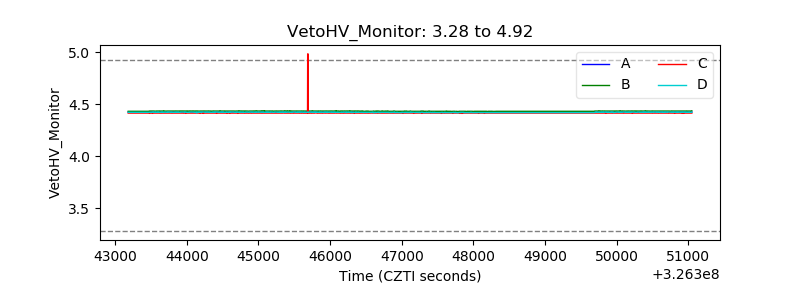 |
| Veto LLD | 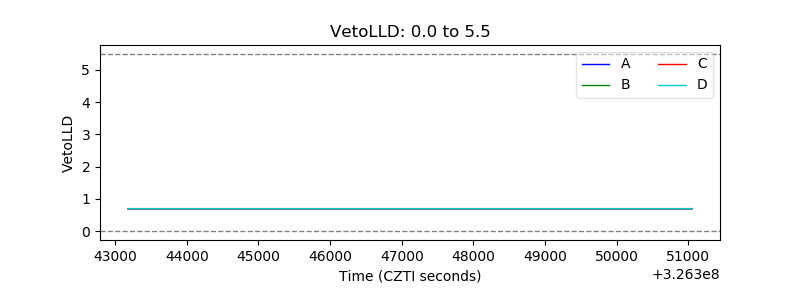 |
| Alpha Counter | 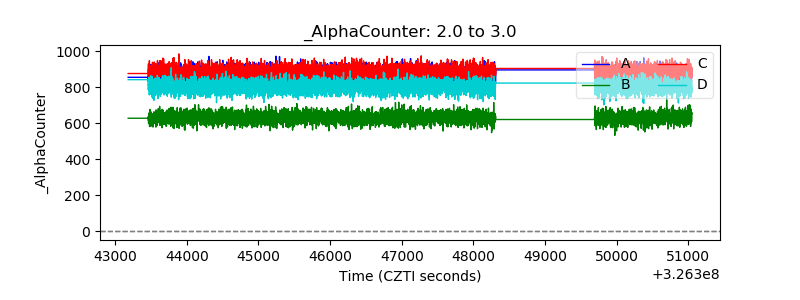 |
| _CPM_Rate | 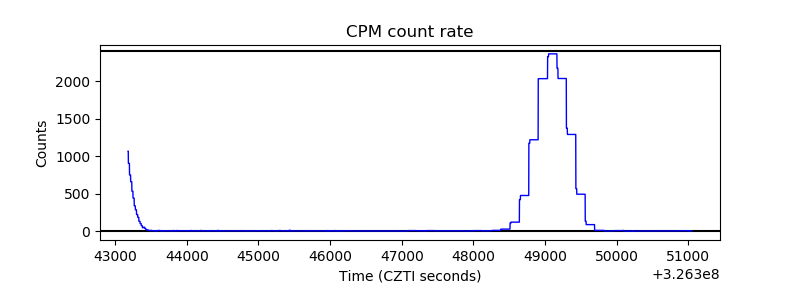 |
| CZT Counter | 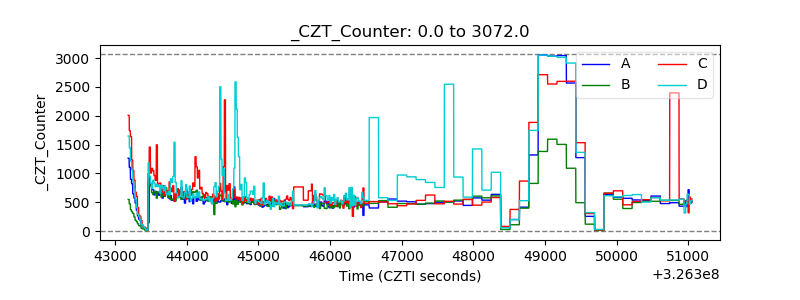 |
| +2.5 Volts monitor |  |
| +5 Volts monitor |  |
| _ROLL_ROT | 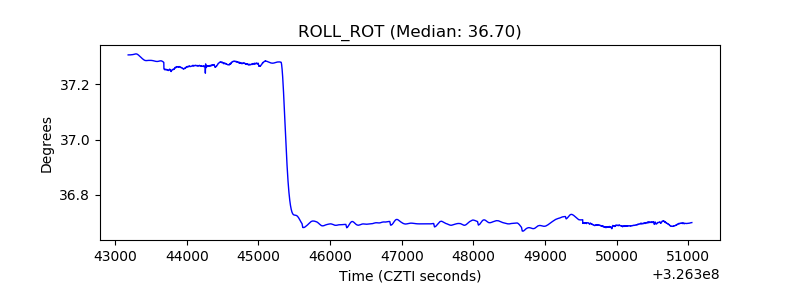 |
| _Roll_DEC | 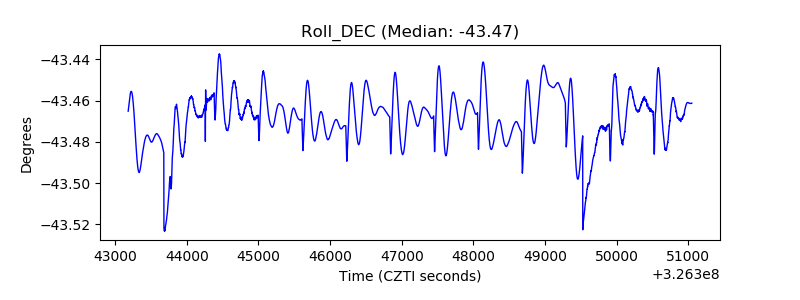 |
| _Roll_RA | 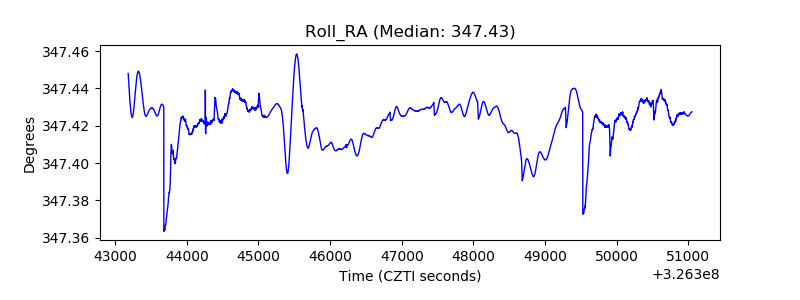 |
| Veto Counter | 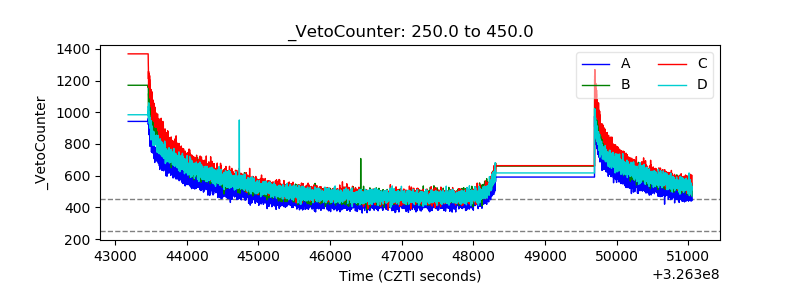 |