| Param | Original file | Final file |
|---|---|---|
| Filename | modeM0/AS1A07_027T16_9000003642_24885cztM0_level2.evt | modeM0/AS1A07_027T16_9000003642_24885cztM0_level2_quad_clean.evt |
| Size (bytes) | 532,817,280 | 94,541,760 |
| Size | 508.1 MB | 90.2 MB |
| Events in quadrant A | 3,288,375 | 604,921 |
| Events in quadrant B | 3,174,768 | 618,328 |
| Events in quadrant C | 4,728,837 | 592,572 |
| Events in quadrant D | 4,498,937 | 588,906 |
| Mode M9 | |||
|---|---|---|---|
| Quadrant | BADHDUFLAG | Total packets | Discarded packets |
| A | 0 | 6 | 0 |
| B | 0 | 6 | 0 |
| C | 0 | 6 | 0 |
| D | 0 | 6 | 0 |
| Mode M0 | |||
|---|---|---|---|
| Quadrant | BADHDUFLAG | Total packets | Discarded packets |
| A | 0 | 13980 | 1 |
| B | 0 | 13550 | 1 |
| C | 0 | 18146 | 2 |
| D | 0 | 17752 | 1 |
| Mode SS | |||
|---|---|---|---|
| Quadrant | BADHDUFLAG | Total packets | Discarded packets |
| A | 0 | 134 | 0 |
| B | 0 | 134 | 0 |
| C | 0 | 134 | 0 |
| D | 0 | 134 | 0 |
| Quadrant | Total seconds | Saturated seconds | Saturation percentage |
|---|---|---|---|
| A | 6569 | 140 | 2.131222% |
| B | 6569 | 77 | 1.172172% |
| C | 6568 | 268 | 4.080390% |
| D | 6568 | 158 | 2.405603% |
Noise dominated data is calculated using 1-second bins in cleaned event files. If a bin has >2000 counts, and if more than 50% of those come from <1% of pixels, then it is considered to be noise-dominated and hence unusable.
| Quadrant | # 1 sec bins | Bins with >0 counts | Bins with >2000 counts | High rate bins dominated by noise | Noise dominated (total time) | Noise dominated (detector-on time) | Marked lightcurve |
|---|---|---|---|---|---|---|---|
| A | 7189 | 6570 | 40 | 40 | 0.56% | 0.61% | 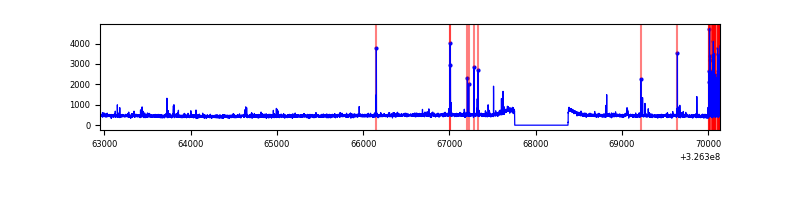 |
| B | 7189 | 6570 | 0 | 0 | 0.00% | 0.00% | 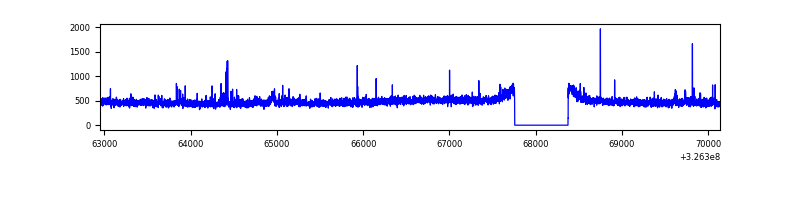 |
| C | 7188 | 6569 | 133 | 133 | 1.85% | 2.02% | 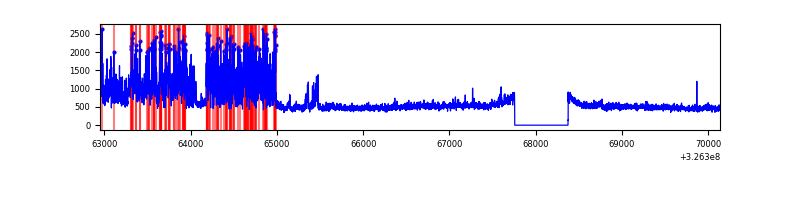 |
| D | 7188 | 6569 | 69 | 69 | 0.96% | 1.05% | 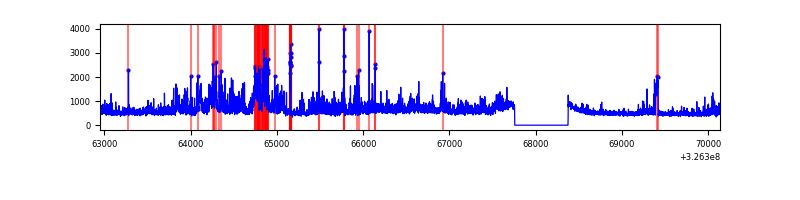 |
Top three noisy pixels from each quadrant. If the there are fewer than three noisy pixels in the level2.evt file, extra rows are filled as -1
| Pixel properties | Quadrant properties | ||||||
|---|---|---|---|---|---|---|---|
| Quadrant | DetID | PixID | Counts | Sigma | Mean | Median | Sigma |
| A | 6 | 16 | 200662 | 1242.52 | 799 | 781 | 160.9 |
| A | 13 | 254 | 10718 | 61.77 | 799 | 781 | 160.9 |
| A | 3 | 137 | 7222 | 40.04 | 799 | 781 | 160.9 |
| B | 0 | 190 | 30259 | 195.63 | 790 | 770 | 150.7 |
| B | 12 | 111 | 18372 | 116.77 | 790 | 770 | 150.7 |
| B | 11 | 111 | 17002 | 107.68 | 790 | 770 | 150.7 |
| C | 7 | 247 | 1609740 | 9023.8 | 767 | 771 | 178.3 |
| C | 14 | 238 | 121143 | 675.1 | 767 | 771 | 178.3 |
| C | 7 | 226 | 6219 | 30.55 | 767 | 771 | 178.3 |
| D | 8 | 195 | 748822 | 3943.38 | 786 | 763 | 189.7 |
| D | 1 | 52 | 737568 | 3884.05 | 786 | 763 | 189.7 |
| D | 2 | 234 | 26101 | 133.57 | 786 | 763 | 189.7 |
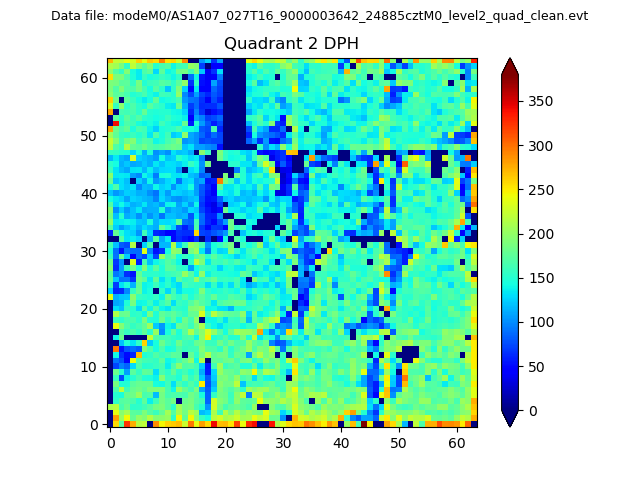
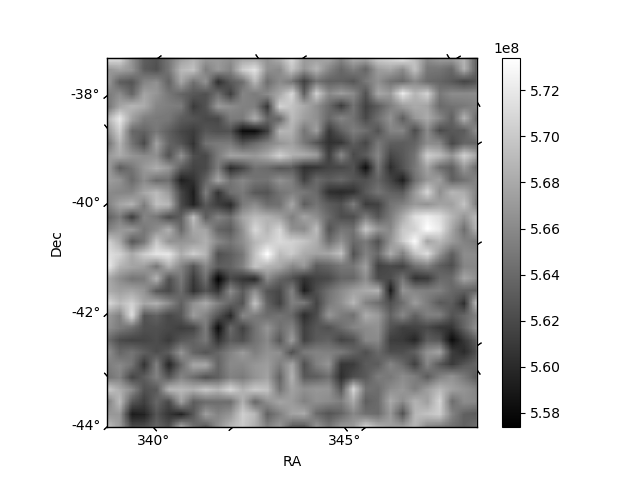
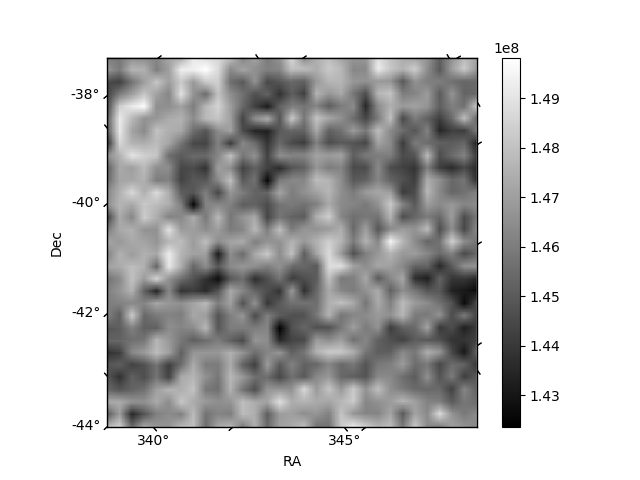
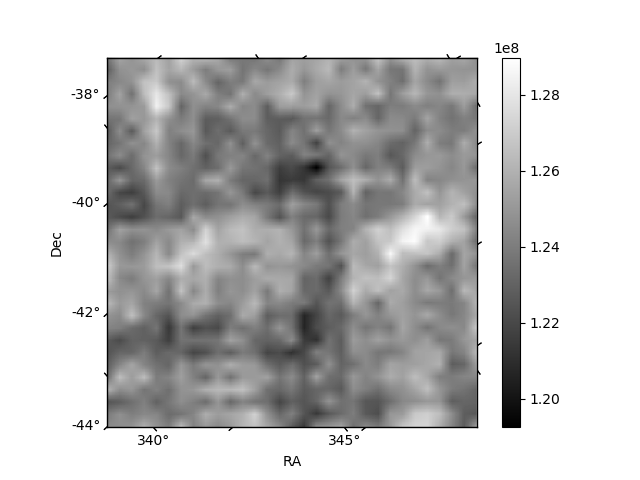
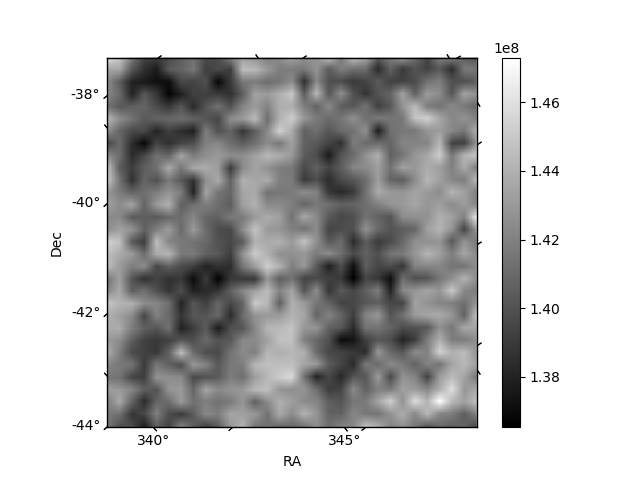
Histogram calculated using DETX and DETY for each event in the final _common_clean file
| Quadrant A | 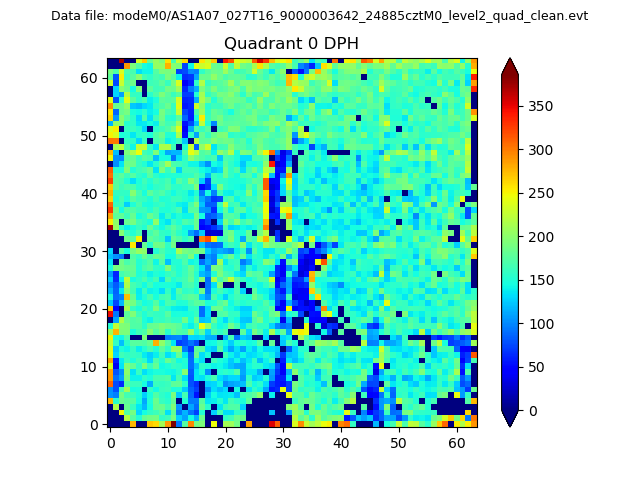 |
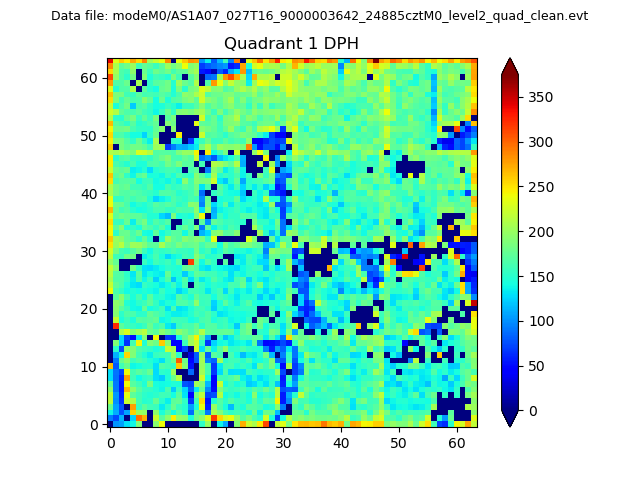 |
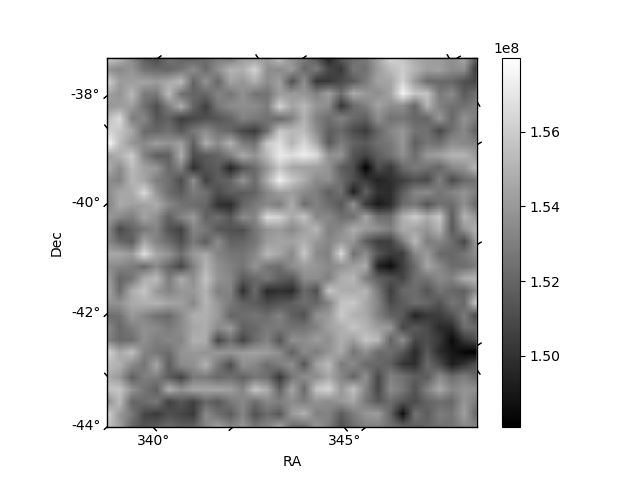
Quadrant B |
|---|---|---|---|
| Quadrant D | 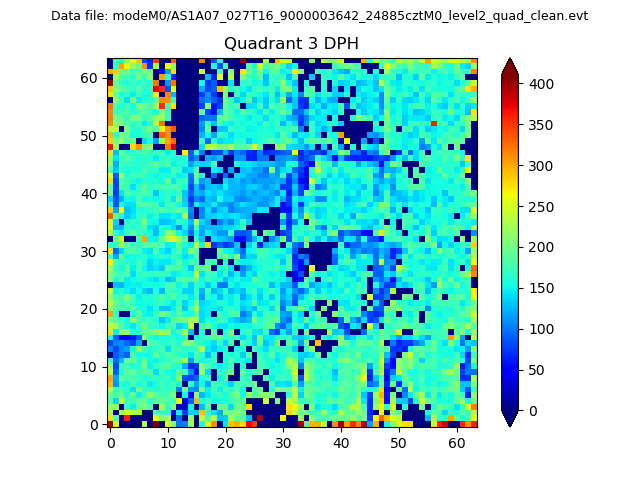 |
 |
Quadrant C |
| Plot type | Count rate plots | Images |
|---|---|---|
| Comparison with Poisson distribution Blue bars denote a histogram of data divided into 1 sec bins. Red curve is a Poisson curve with rate = median count rate of data. |
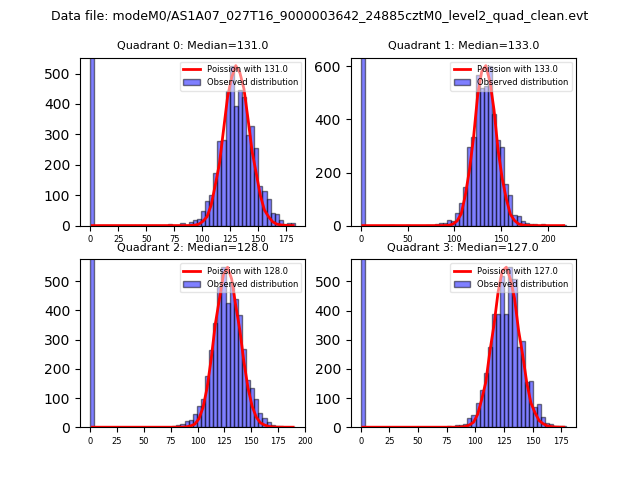 |
 |
| Quadrant-wise count rates Data is divided into 100 sec bins |
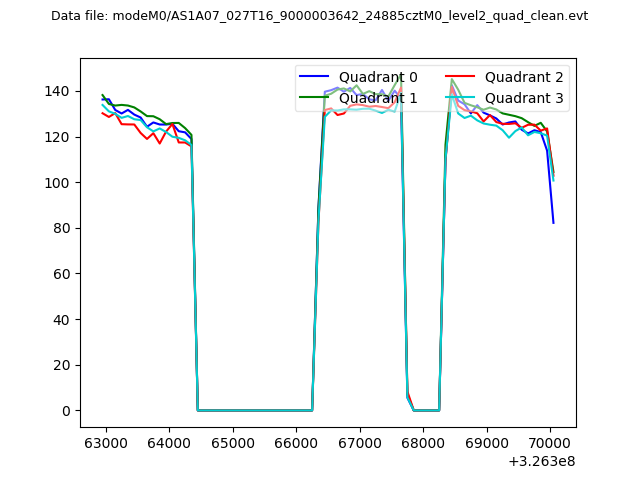 |
|
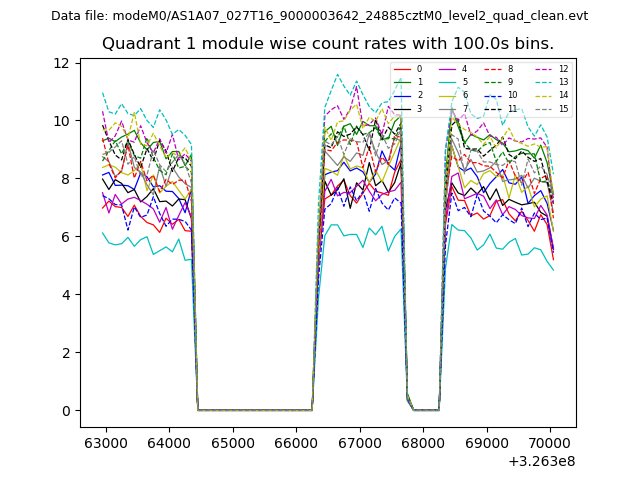
| Module-wise count rates for Quadrant A Data is divided into 100 sec bins |
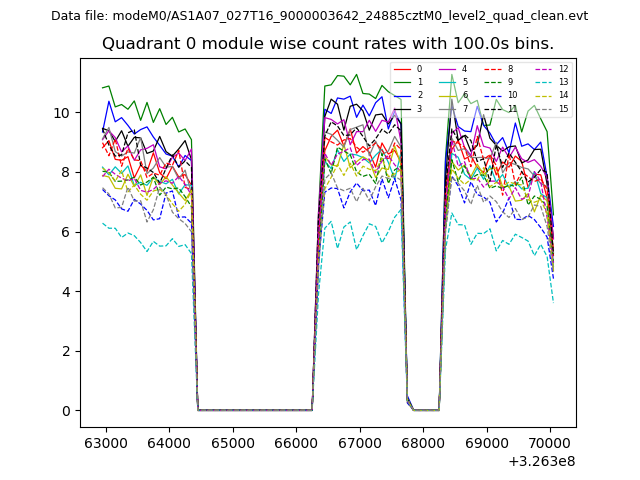 |
 |
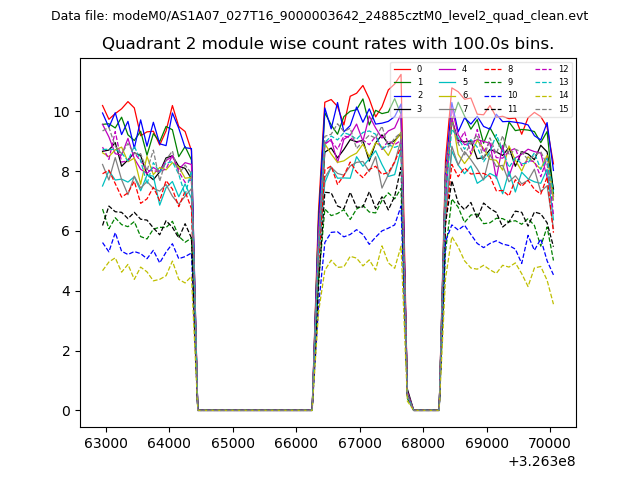
| Module-wise count rates for Quadrant B Data is divided into 100 sec bins |
 |
 |
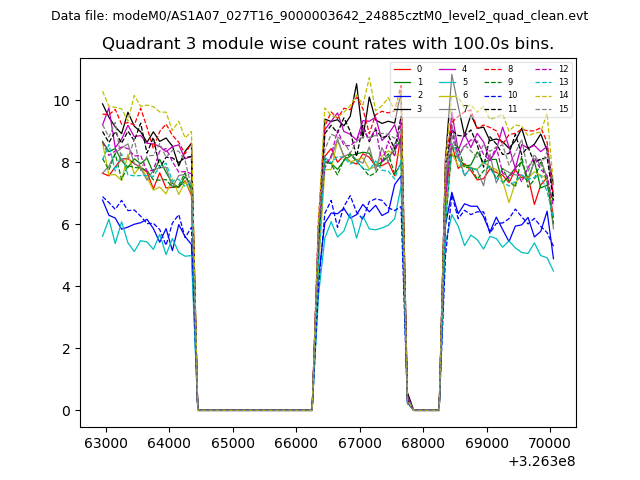
| Module-wise count rates for Quadrant C Data is divided into 100 sec bins |
 |
 |
| Module-wise count rates for Quadrant D Data is divided into 100 sec bins |
 |
 |
| Parameter | Plot |
|---|---|
| CZT HV Monitor | 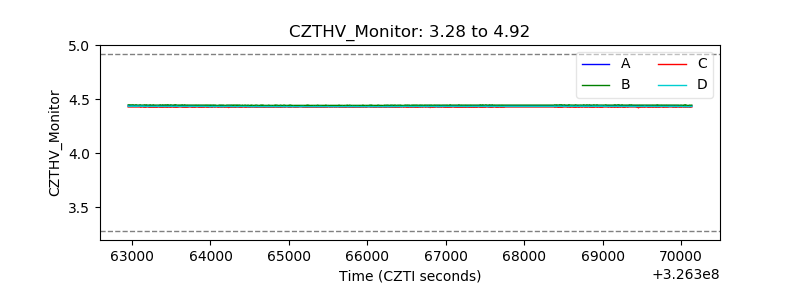 |
| D_VDD | 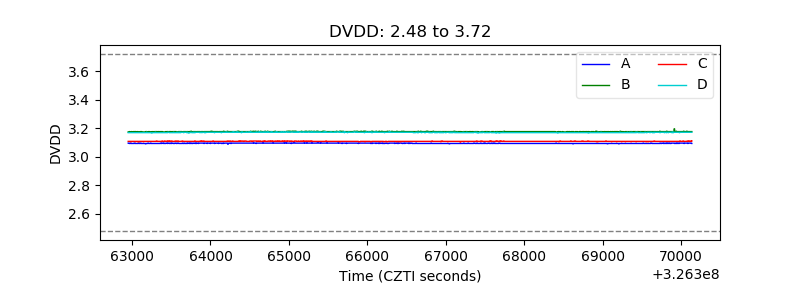 |
| Temperature 1 | 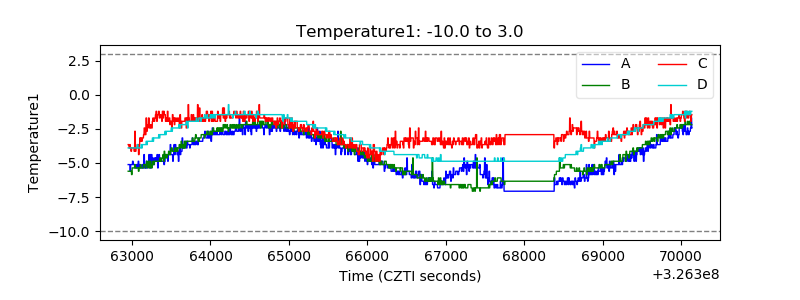 |
| Veto HV Monitor | 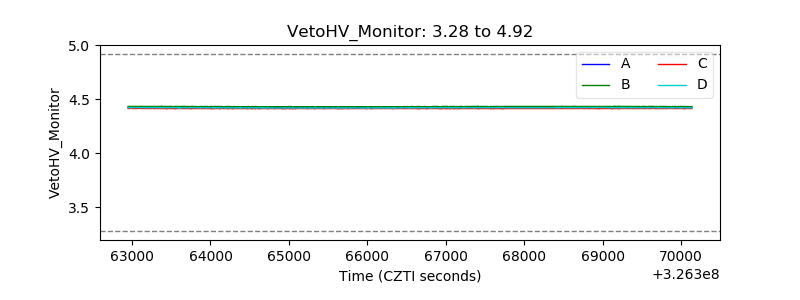 |
| Veto LLD | 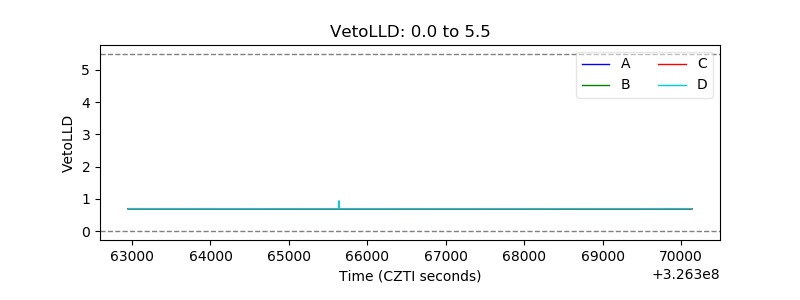 |
| Alpha Counter | 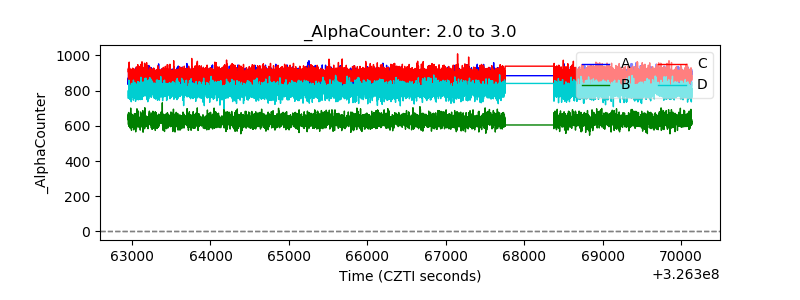 |
| _CPM_Rate | 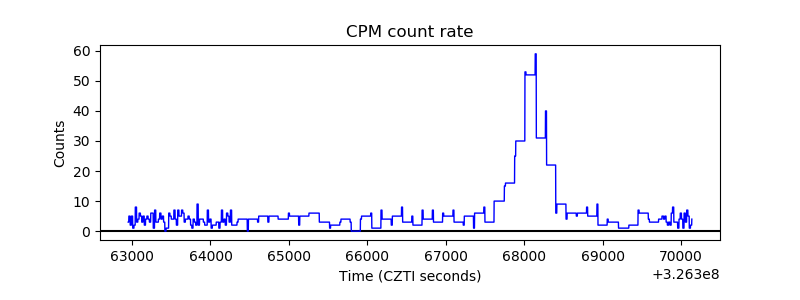 |
| CZT Counter | 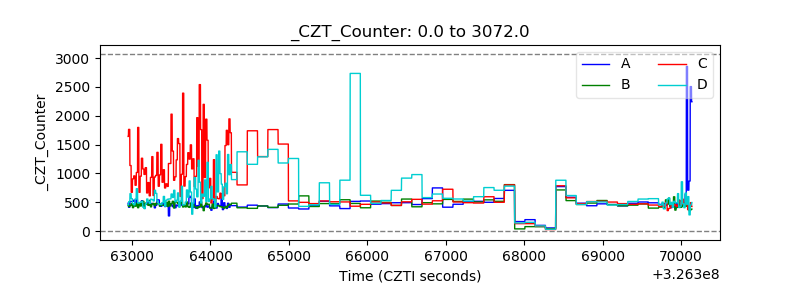 |
| +2.5 Volts monitor |  |
| +5 Volts monitor | 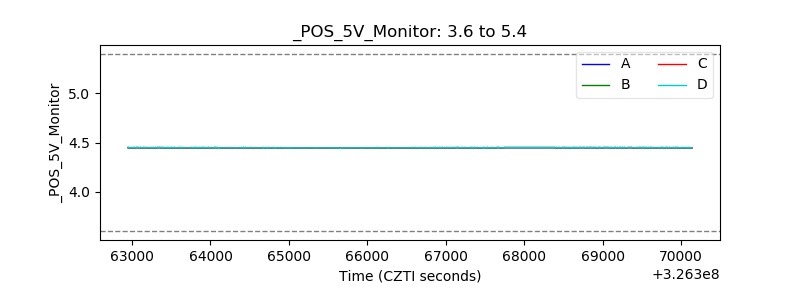 |
| _ROLL_ROT | 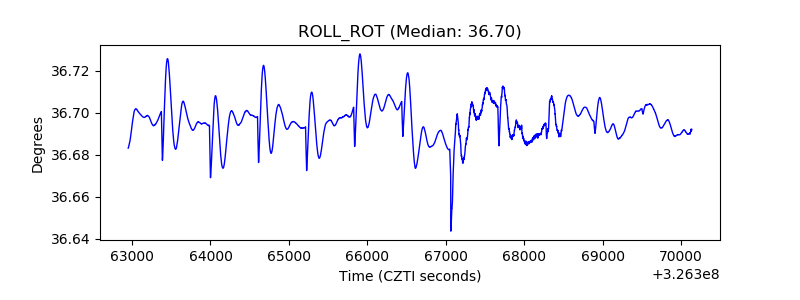 |
| _Roll_DEC | 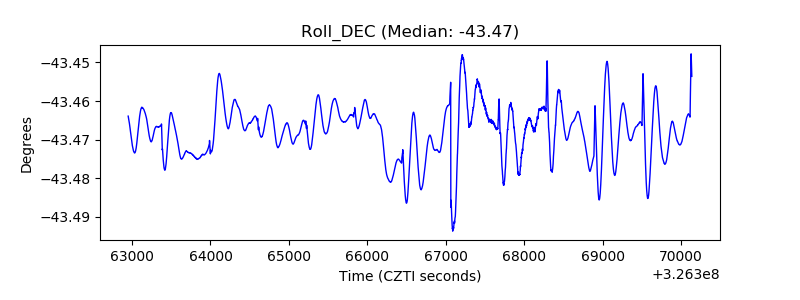 |
| _Roll_RA | 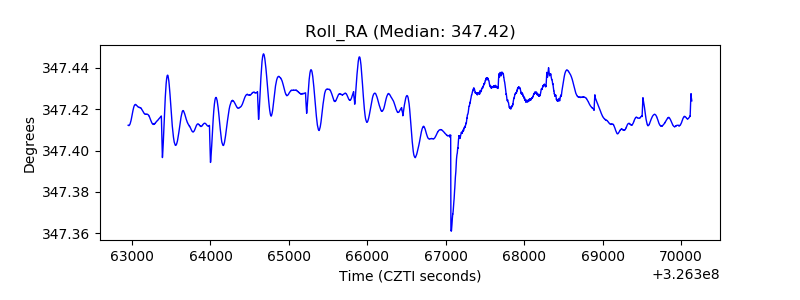 |
| Veto Counter | 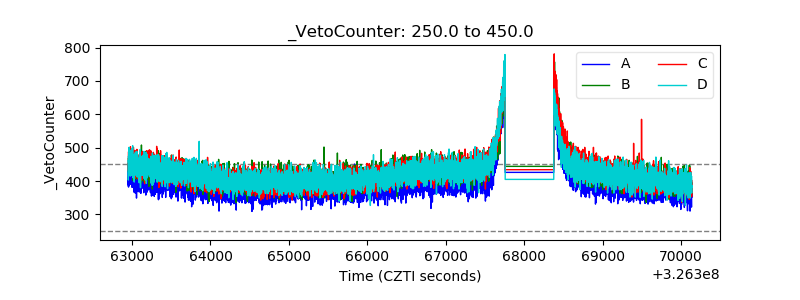 |