| Param | Original file | Final file |
|---|---|---|
| Filename | modeM0/AS1A07_027T16_9000003642_24886cztM0_level2.evt | modeM0/AS1A07_027T16_9000003642_24886cztM0_level2_quad_clean.evt |
| Size (bytes) | 467,749,440 | 94,786,560 |
| Size | 446.1 MB | 90.4 MB |
| Events in quadrant A | 3,491,457 | 598,499 |
| Events in quadrant B | 3,290,198 | 616,834 |
| Events in quadrant C | 3,285,220 | 595,139 |
| Events in quadrant D | 3,638,642 | 588,004 |
| Mode M9 | |||
|---|---|---|---|
| Quadrant | BADHDUFLAG | Total packets | Discarded packets |
| A | 0 | 1 | 0 |
| B | 0 | 1 | 0 |
| C | 0 | 1 | 0 |
| D | 0 | 1 | 0 |
| Mode M0 | |||
|---|---|---|---|
| Quadrant | BADHDUFLAG | Total packets | Discarded packets |
| A | 0 | 14735 | 0 |
| B | 0 | 14061 | 0 |
| C | 0 | 13962 | 0 |
| D | 0 | 15065 | 0 |
| Mode SS | |||
|---|---|---|---|
| Quadrant | BADHDUFLAG | Total packets | Discarded packets |
| A | 0 | 140 | 0 |
| B | 0 | 140 | 0 |
| C | 0 | 140 | 0 |
| D | 0 | 140 | 0 |
| Quadrant | Total seconds | Saturated seconds | Saturation percentage |
|---|---|---|---|
| A | 6759 | 260 | 3.846723% |
| B | 6760 | 210 | 3.106509% |
| C | 6760 | 205 | 3.032544% |
| D | 6760 | 154 | 2.278107% |
Noise dominated data is calculated using 1-second bins in cleaned event files. If a bin has >2000 counts, and if more than 50% of those come from <1% of pixels, then it is considered to be noise-dominated and hence unusable.
| Quadrant | # 1 sec bins | Bins with >0 counts | Bins with >2000 counts | High rate bins dominated by noise | Noise dominated (total time) | Noise dominated (detector-on time) | Marked lightcurve |
|---|---|---|---|---|---|---|---|
| A | 6939 | 6760 | 53 | 53 | 0.76% | 0.78% | 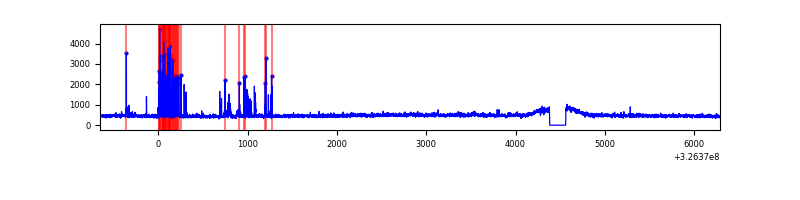 |
| B | 6940 | 6761 | 1 | 1 | 0.01% | 0.01% | 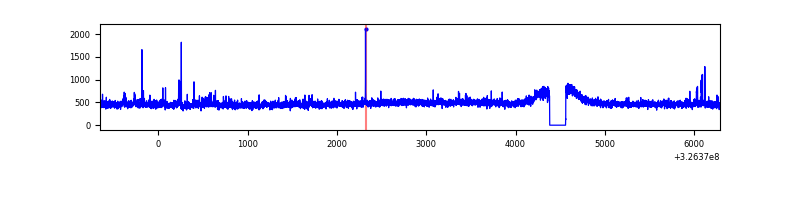 |
| C | 6940 | 6761 | 0 | 0 | 0.00% | 0.00% | 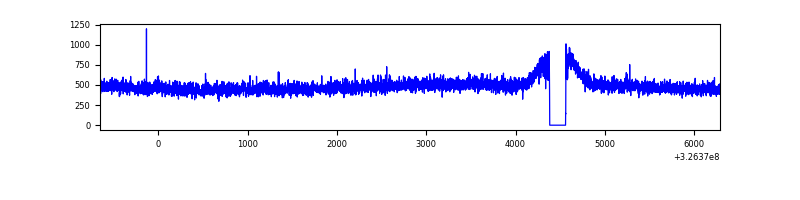 |
| D | 6940 | 6761 | 8 | 8 | 0.12% | 0.12% | 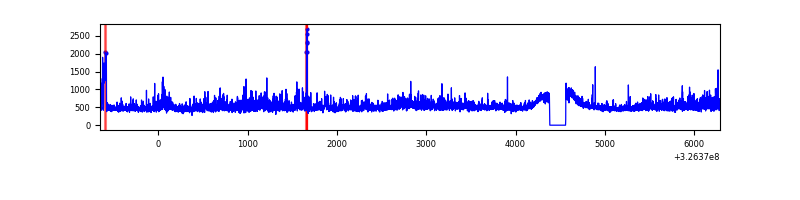 |
Top three noisy pixels from each quadrant. If the there are fewer than three noisy pixels in the level2.evt file, extra rows are filled as -1
| Pixel properties | Quadrant properties | ||||||
|---|---|---|---|---|---|---|---|
| Quadrant | DetID | PixID | Counts | Sigma | Mean | Median | Sigma |
| A | 6 | 16 | 289400 | 1743.44 | 819 | 798 | 165.5 |
| A | 11 | 208 | 38978 | 230.64 | 819 | 798 | 165.5 |
| A | 13 | 254 | 10325 | 57.55 | 819 | 798 | 165.5 |
| B | 0 | 190 | 37236 | 233.81 | 815 | 794 | 155.9 |
| B | 3 | 209 | 21095 | 130.25 | 815 | 794 | 155.9 |
| B | 12 | 111 | 19240 | 118.35 | 815 | 794 | 155.9 |
| C | 14 | 238 | 124957 | 667.21 | 793 | 796 | 186.1 |
| C | 7 | 247 | 68105 | 361.7 | 793 | 796 | 186.1 |
| C | 13 | 61 | 5483 | 25.19 | 793 | 796 | 186.1 |
| D | 8 | 195 | 457115 | 2321.99 | 811 | 784 | 196.5 |
| D | 1 | 52 | 84524 | 426.1 | 811 | 784 | 196.5 |
| D | 2 | 234 | 27837 | 137.65 | 811 | 784 | 196.5 |
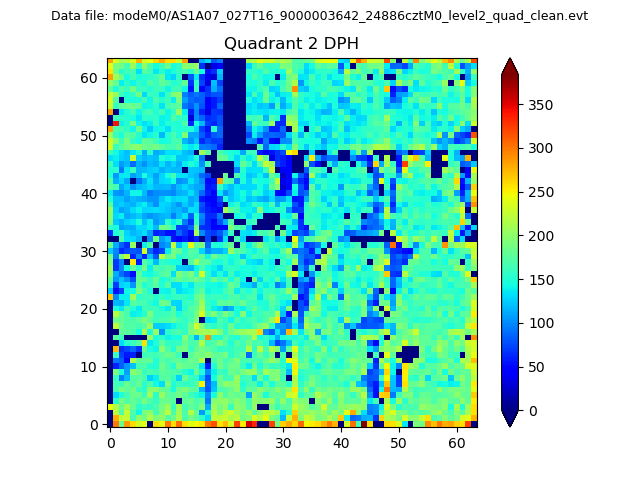
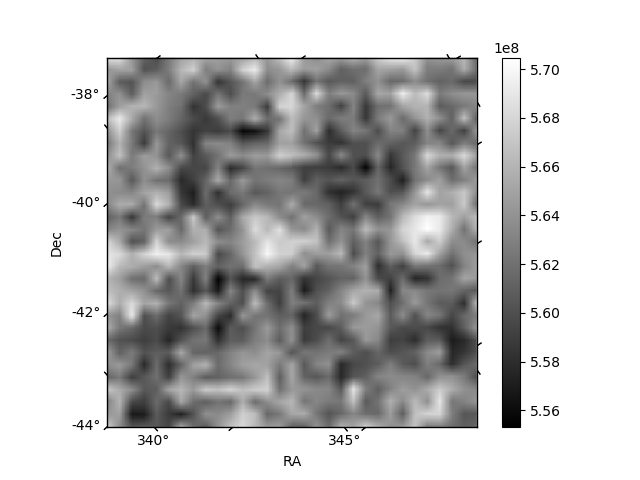
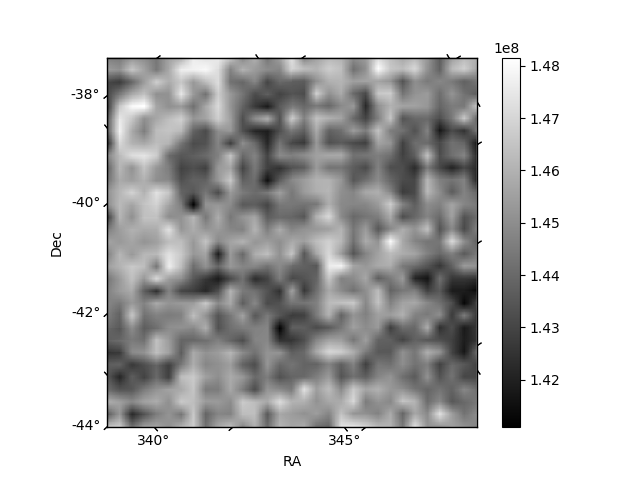
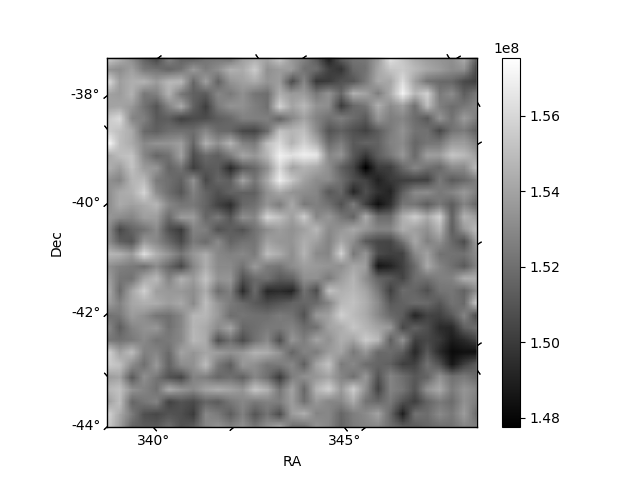
Histogram calculated using DETX and DETY for each event in the final _common_clean file
| Quadrant A | 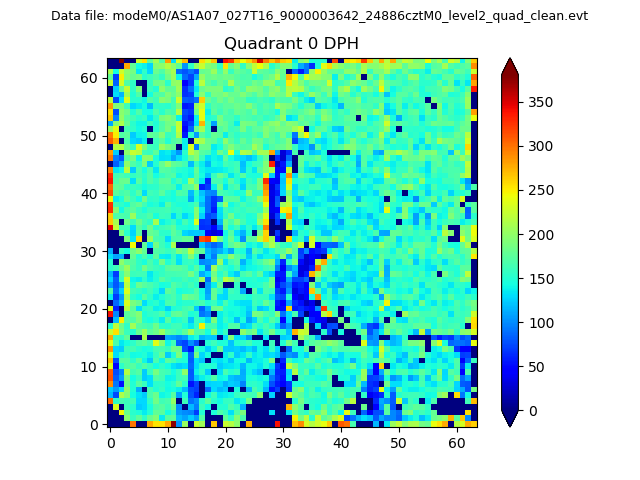 |
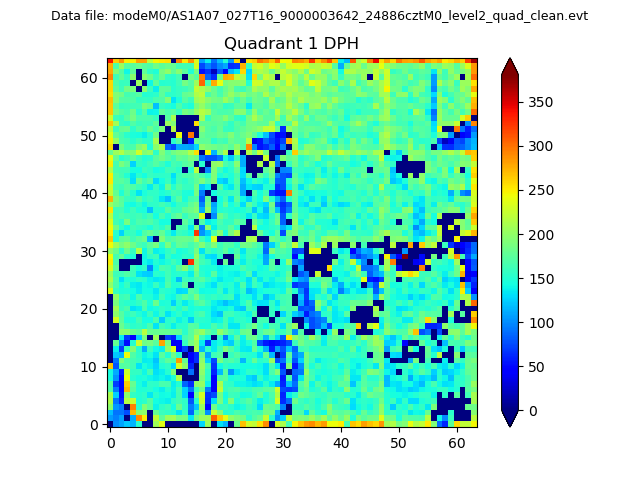 |
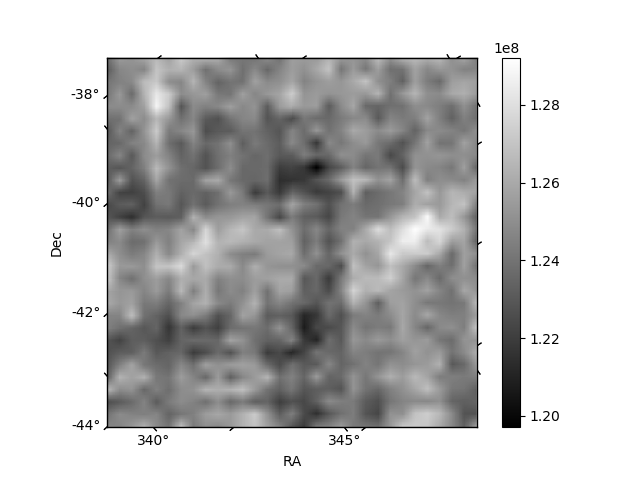
Quadrant B |
|---|---|---|---|
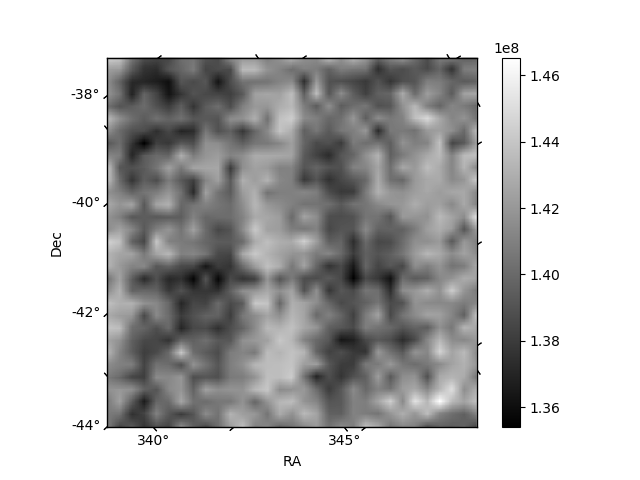
| Quadrant D | 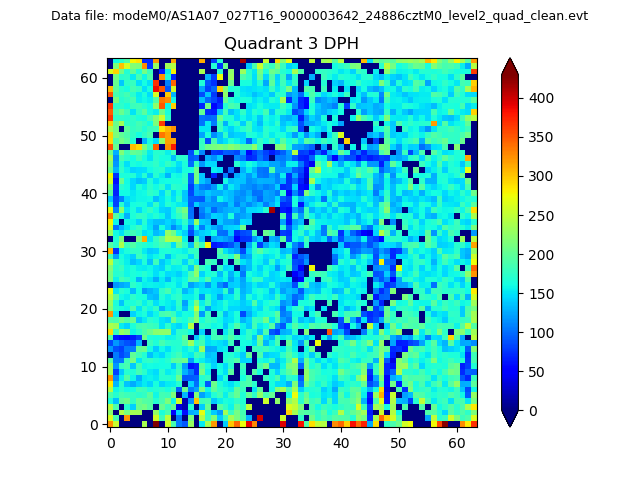 |
 |
Quadrant C |
| Plot type | Count rate plots | Images |
|---|---|---|
| Comparison with Poisson distribution Blue bars denote a histogram of data divided into 1 sec bins. Red curve is a Poisson curve with rate = median count rate of data. |
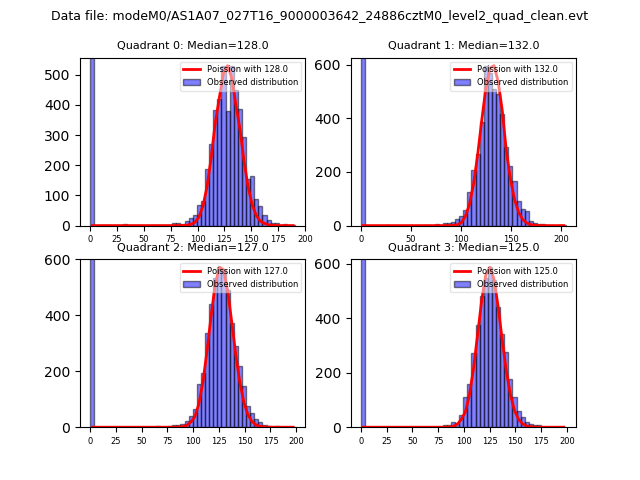 |
 |
| Quadrant-wise count rates Data is divided into 100 sec bins |
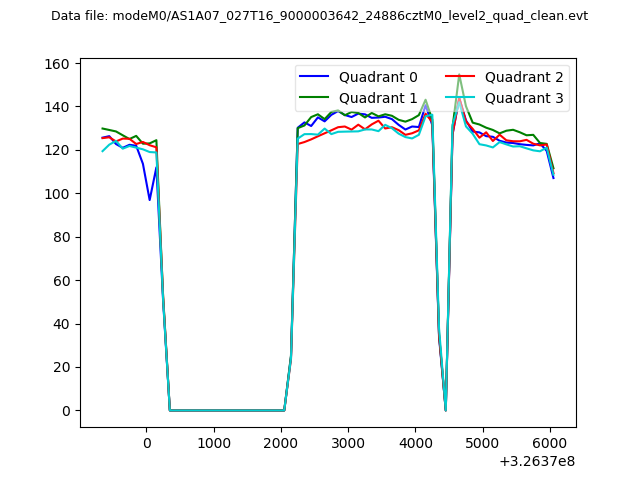 |
|
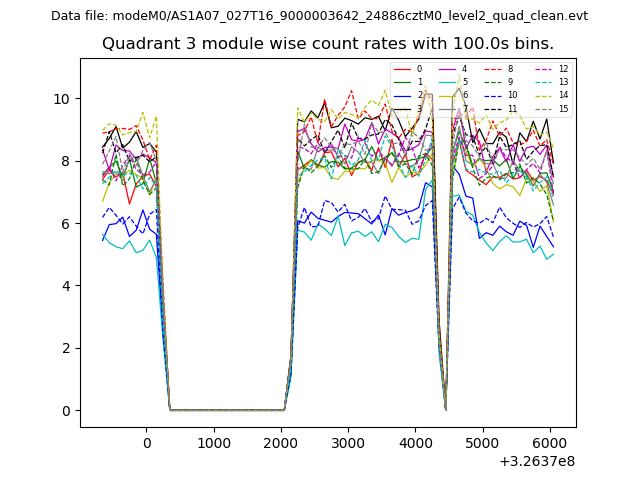
| Module-wise count rates for Quadrant A Data is divided into 100 sec bins |
 |
 |
| Module-wise count rates for Quadrant B Data is divided into 100 sec bins |
 |
 |
| Module-wise count rates for Quadrant C Data is divided into 100 sec bins |
 |
 |
| Module-wise count rates for Quadrant D Data is divided into 100 sec bins |
 |
 |
| Parameter | Plot |
|---|---|
| CZT HV Monitor |  |
| D_VDD | 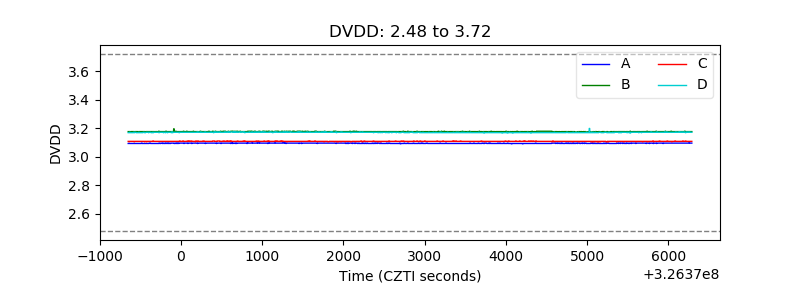 |
| Temperature 1 | 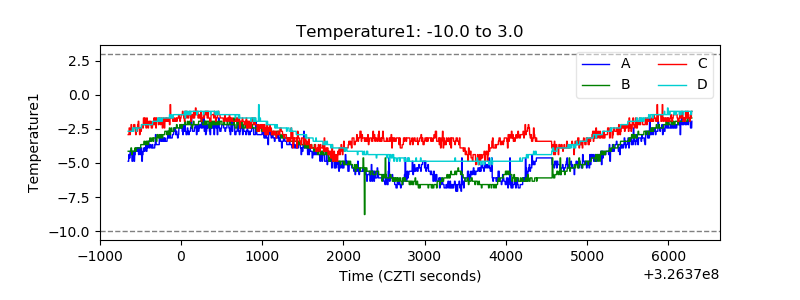 |
| Veto HV Monitor | 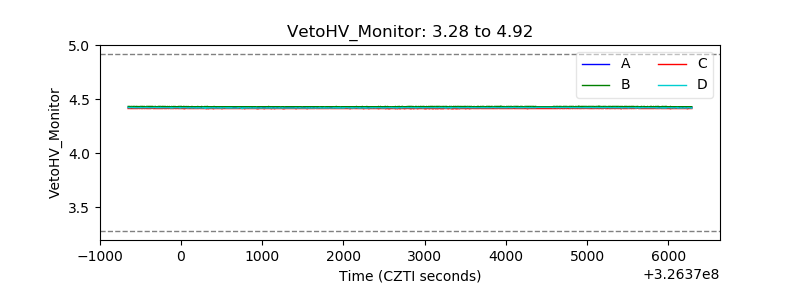 |
| Veto LLD | 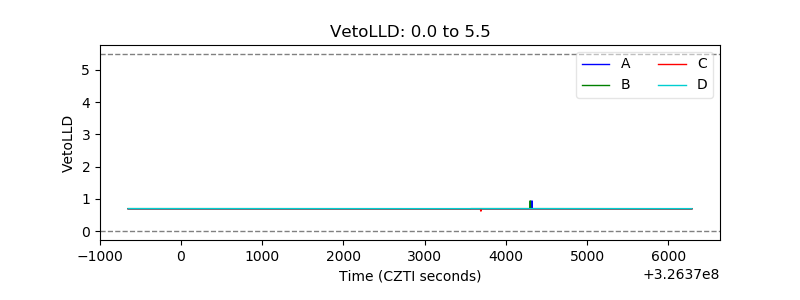 |
| Alpha Counter | 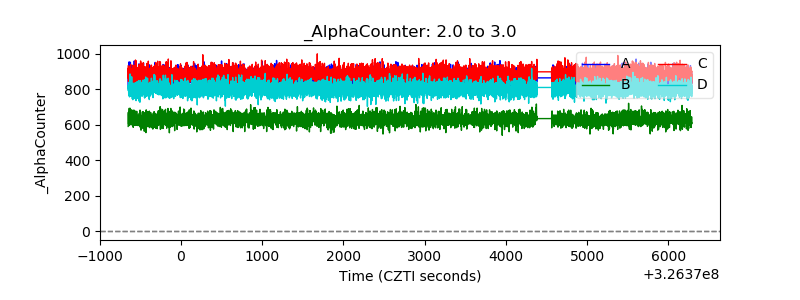 |
| _CPM_Rate | 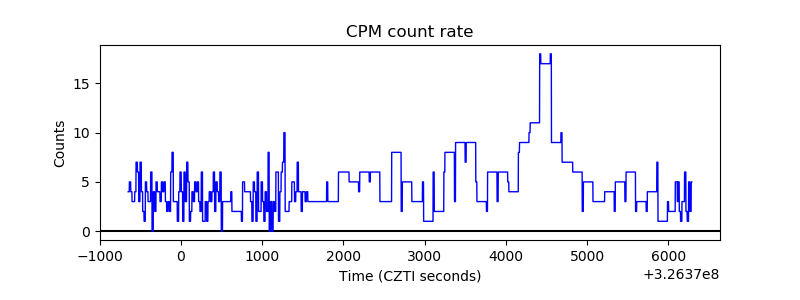 |
| CZT Counter | 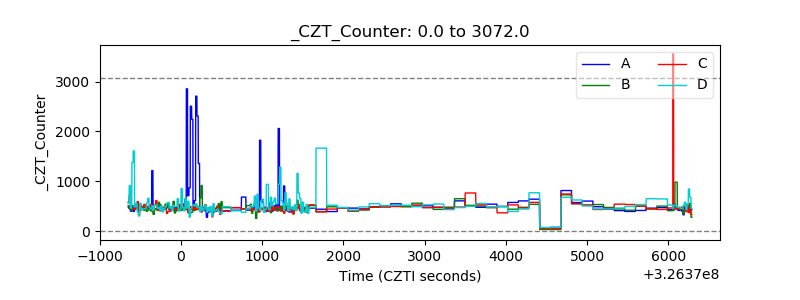 |
| +2.5 Volts monitor |  |
| +5 Volts monitor |  |
| _ROLL_ROT | 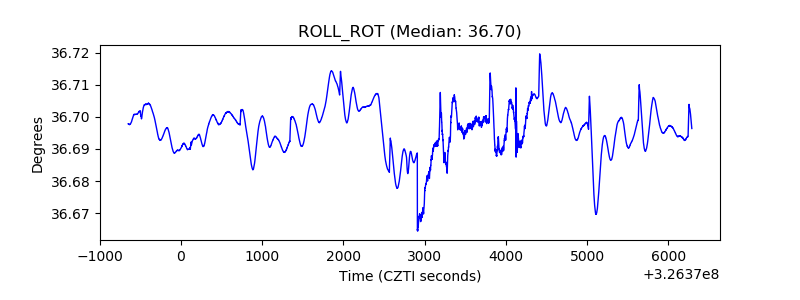 |
| _Roll_DEC | 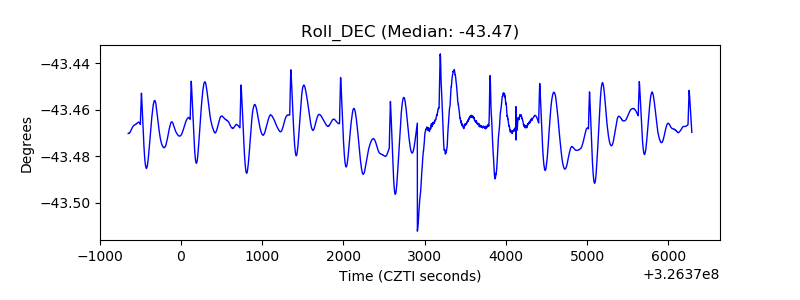 |
| _Roll_RA | 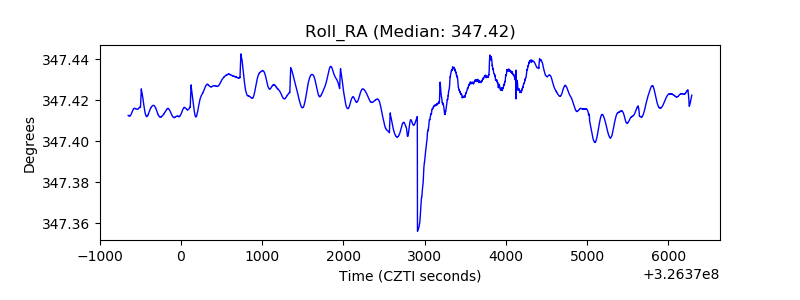 |
| Veto Counter |  |