| Param | Original file | Final file |
|---|---|---|
| Filename | modeM0/AS1A08_003T09_9000003644cztM0_level2.fits | modeM0/AS1A08_003T09_9000003644cztM0_level2_quad_clean.evt |
| Size (bytes) | 281,880,000 | 255,939,840 |
| Size | 268.8 MB | 244.1 MB |
| Events in quadrant A | 1,711,870 | 1,490,710 |
| Events in quadrant B | 1,661,016 | 1,502,207 |
| Events in quadrant C | 1,670,478 | 1,414,659 |
| Events in quadrant D | 1,474,172 | 1,323,888 |
| Mode M9 | |||
|---|---|---|---|
| Quadrant | BADHDUFLAG | Total packets | Discarded packets |
| A | 0 | 40 | 0 |
| B | 0 | 40 | 0 |
| C | 0 | 40 | 0 |
| D | 0 | 40 | 0 |
| Mode M0 | |||
|---|---|---|---|
| Quadrant | BADHDUFLAG | Total packets | Discarded packets |
| A | 0 | 64661 | 0 |
| B | 0 | 61080 | 0 |
| C | 0 | 63257 | 0 |
| D | 0 | 72138 | 0 |
| Mode SS | |||
|---|---|---|---|
| Quadrant | BADHDUFLAG | Total packets | Discarded packets |
| A | 0 | 598 | 0 |
| B | 0 | 598 | 0 |
| C | 0 | 598 | 0 |
| D | 0 | 598 | 0 |
| Quadrant | Total seconds | Saturated seconds | Saturation percentage |
|---|---|---|---|
| A | 29376 | 821 | 2.794798% |
| B | 29376 | 427 | 1.453568% |
| C | 29376 | 712 | 2.423747% |
| D | 29376 | 524 | 1.783769% |
Noise dominated data is calculated using 1-second bins in cleaned event files. If a bin has >2000 counts, and if more than 50% of those come from <1% of pixels, then it is considered to be noise-dominated and hence unusable.
| Quadrant | # 1 sec bins | Bins with >0 counts | Bins with >2000 counts | High rate bins dominated by noise | Noise dominated (total time) | Noise dominated (detector-on time) | Marked lightcurve |
|---|---|---|---|---|---|---|---|
| A | 33316 | 29376 | 0 | 0 | 0.00% | 0.00% |  |
| B | 33316 | 29376 | 0 | 0 | 0.00% | 0.00% |  |
| C | 33316 | 29376 | 0 | 0 | 0.00% | 0.00% | 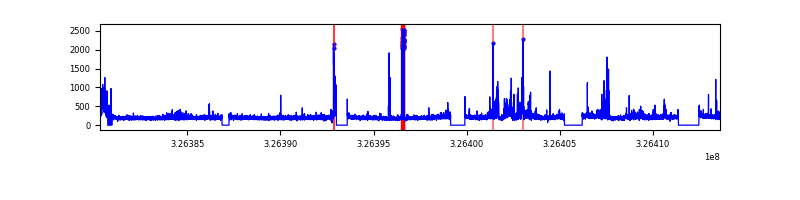 |
| D | 33316 | 29377 | 0 | 0 | 0.00% | 0.00% |  |
Top three noisy pixels from each quadrant. If the there are fewer than three noisy pixels in the level2.evt file, extra rows are filled as -1
| Pixel properties | Quadrant properties | ||||||
|---|---|---|---|---|---|---|---|
| Quadrant | DetID | PixID | Counts | Sigma | Mean | Median | Sigma |
| A | 0 | 29 | 1567 | 10.27 | 445 | 417 | 112.0 |
| A | 7 | 110 | 1390 | 8.69 | 445 | 417 | 112.0 |
| A | 9 | 19 | 1290 | 7.8 | 445 | 417 | 112.0 |
| B | 2 | 9 | 1351 | 10.6 | 437 | 414 | 88.4 |
| B | 2 | 8 | 1144 | 8.26 | 437 | 414 | 88.4 |
| B | 5 | 255 | 1108 | 7.85 | 437 | 414 | 88.4 |
| C | 12 | 241 | 1171 | 6.69 | 441 | 411 | 113.5 |
| C | 7 | 111 | 1132 | 6.35 | 441 | 411 | 113.5 |
| C | 3 | 187 | 1121 | 6.25 | 441 | 411 | 113.5 |
| D | 3 | 14 | 1076 | 6.13 | 420 | 381 | 113.4 |
| D | 6 | 231 | 1048 | 5.88 | 420 | 381 | 113.4 |
| D | 15 | 46 | 1043 | 5.84 | 420 | 381 | 113.4 |
Histogram calculated using DETX and DETY for each event in the final _common_clean file
| Quadrant A |  |
 |
Quadrant B |
|---|---|---|---|
| Quadrant D | 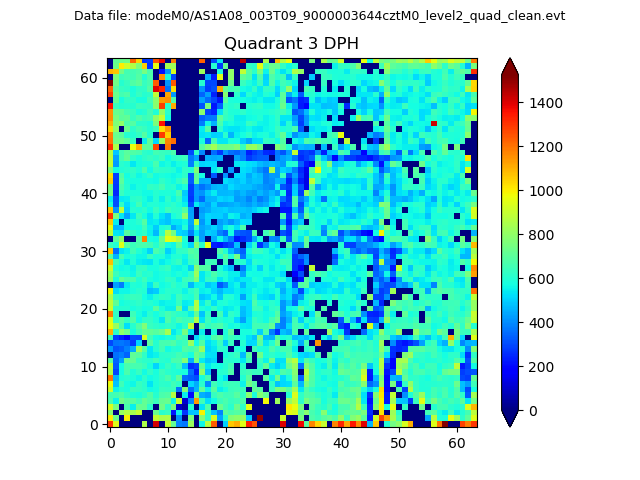 |
 |
Quadrant C |
| Plot type | Count rate plots | Images |
|---|---|---|
| Comparison with Poisson distribution Blue bars denote a histogram of data divided into 1 sec bins. Red curve is a Poisson curve with rate = median count rate of data. |
 |
 |
| Quadrant-wise count rates Data is divided into 100 sec bins |
 |
|
| Module-wise count rates for Quadrant A Data is divided into 100 sec bins |
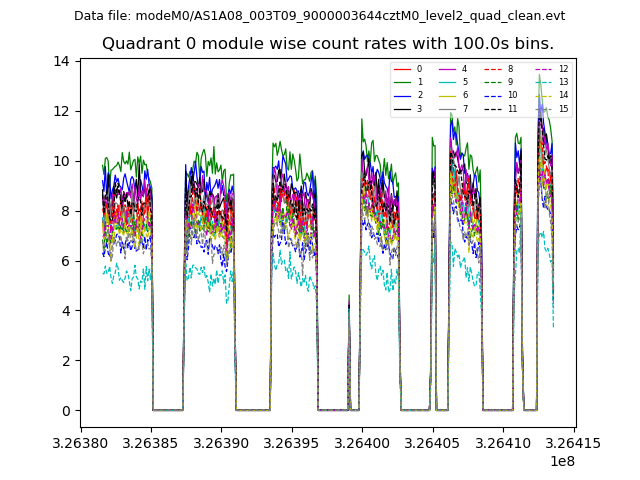 |
 |
| Module-wise count rates for Quadrant B Data is divided into 100 sec bins |
 |
 |
| Module-wise count rates for Quadrant C Data is divided into 100 sec bins |
 |
 |
| Module-wise count rates for Quadrant D Data is divided into 100 sec bins |
 |
 |
| Parameter | Plot |
|---|---|
| CZT HV Monitor |  |
| D_VDD | 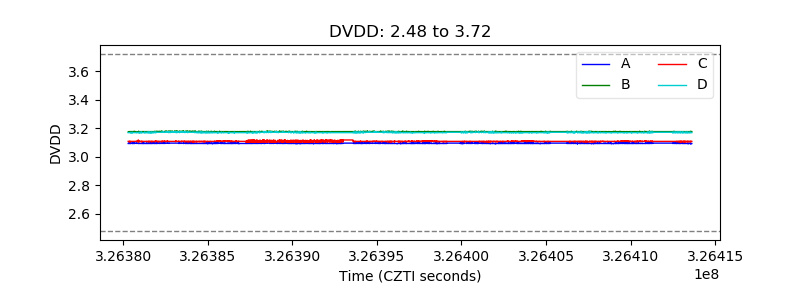 |
| Temperature 1 |  |
| Veto HV Monitor |  |
| Veto LLD |  |
| Alpha Counter |  |
| _CPM_Rate |  |
| CZT Counter |  |
| +2.5 Volts monitor |  |
| +5 Volts monitor |  |
| _ROLL_ROT |  |
| _Roll_DEC |  |
| _Roll_RA |  |
| Veto Counter | 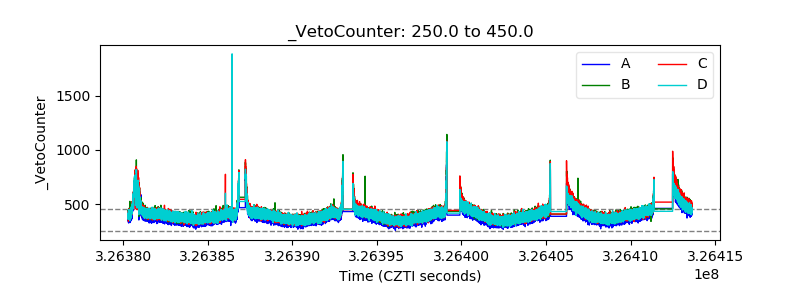 |