| Param | Original file | Final file |
|---|---|---|
| Filename | modeM0/AS1A08_003T09_9000003644_24888cztM0_level2.evt | modeM0/AS1A08_003T09_9000003644_24888cztM0_level2_quad_clean.evt |
| Size (bytes) | 529,994,880 | 96,822,720 |
| Size | 505.4 MB | 92.3 MB |
| Events in quadrant A | 3,986,102 | 618,187 |
| Events in quadrant B | 3,377,322 | 632,972 |
| Events in quadrant C | 3,374,233 | 604,763 |
| Events in quadrant D | 4,842,285 | 592,568 |
| Mode M9 | |||
|---|---|---|---|
| Quadrant | BADHDUFLAG | Total packets | Discarded packets |
| A | 0 | 4 | 0 |
| B | 0 | 4 | 0 |
| C | 0 | 4 | 0 |
| D | 0 | 4 | 0 |
| Mode M0 | |||
|---|---|---|---|
| Quadrant | BADHDUFLAG | Total packets | Discarded packets |
| A | 0 | 16344 | 1 |
| B | 0 | 14368 | 1 |
| C | 0 | 14271 | 1 |
| D | 0 | 19234 | 1 |
| Mode SS | |||
|---|---|---|---|
| Quadrant | BADHDUFLAG | Total packets | Discarded packets |
| A | 0 | 140 | 0 |
| B | 0 | 140 | 0 |
| C | 0 | 140 | 0 |
| D | 0 | 140 | 0 |
| Quadrant | Total seconds | Saturated seconds | Saturation percentage |
|---|---|---|---|
| A | 6946 | 273 | 3.930320% |
| B | 6947 | 99 | 1.425076% |
| C | 6947 | 125 | 1.799338% |
| D | 6947 | 96 | 1.381891% |
Noise dominated data is calculated using 1-second bins in cleaned event files. If a bin has >2000 counts, and if more than 50% of those come from <1% of pixels, then it is considered to be noise-dominated and hence unusable.
| Quadrant | # 1 sec bins | Bins with >0 counts | Bins with >2000 counts | High rate bins dominated by noise | Noise dominated (total time) | Noise dominated (detector-on time) | Marked lightcurve |
|---|---|---|---|---|---|---|---|
| A | 7321 | 6947 | 120 | 120 | 1.64% | 1.73% | 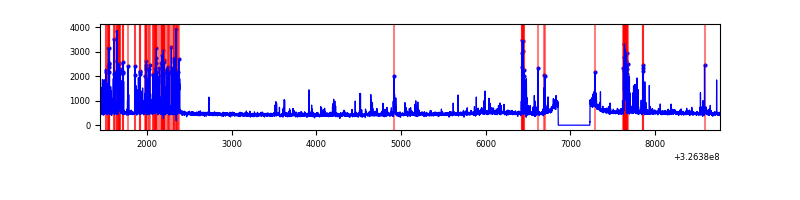 |
| B | 7322 | 6948 | 0 | 0 | 0.00% | 0.00% | 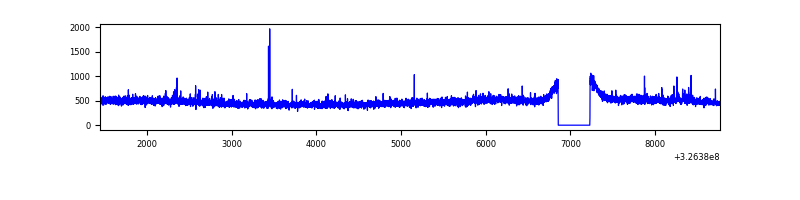 |
| C | 7322 | 6948 | 0 | 0 | 0.00% | 0.00% | 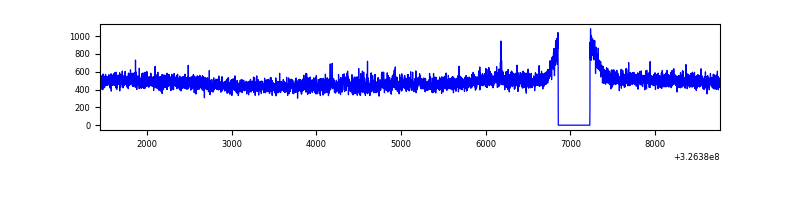 |
| D | 7322 | 6948 | 19 | 19 | 0.26% | 0.27% | 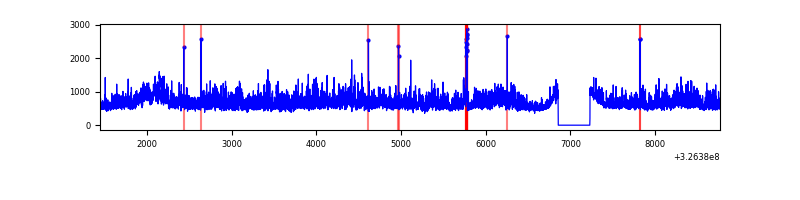 |
Top three noisy pixels from each quadrant. If the there are fewer than three noisy pixels in the level2.evt file, extra rows are filled as -1
| Pixel properties | Quadrant properties | ||||||
|---|---|---|---|---|---|---|---|
| Quadrant | DetID | PixID | Counts | Sigma | Mean | Median | Sigma |
| A | 6 | 16 | 698714 | 4028.86 | 848 | 829 | 173.2 |
| A | 13 | 254 | 11325 | 60.59 | 848 | 829 | 173.2 |
| A | 4 | 2 | 9933 | 52.56 | 848 | 829 | 173.2 |
| B | 12 | 111 | 20806 | 120.36 | 847 | 825 | 166.0 |
| B | 11 | 111 | 18772 | 108.1 | 847 | 825 | 166.0 |
| B | 14 | 111 | 17372 | 99.67 | 847 | 825 | 166.0 |
| C | 14 | 238 | 129513 | 666.05 | 819 | 824 | 193.2 |
| C | 7 | 247 | 40411 | 204.89 | 819 | 824 | 193.2 |
| C | 13 | 61 | 5607 | 24.76 | 819 | 824 | 193.2 |
| D | 8 | 195 | 1436840 | 6972.56 | 834 | 809 | 206.0 |
| D | 7 | 238 | 135182 | 652.44 | 834 | 809 | 206.0 |
| D | 2 | 244 | 72745 | 349.28 | 834 | 809 | 206.0 |
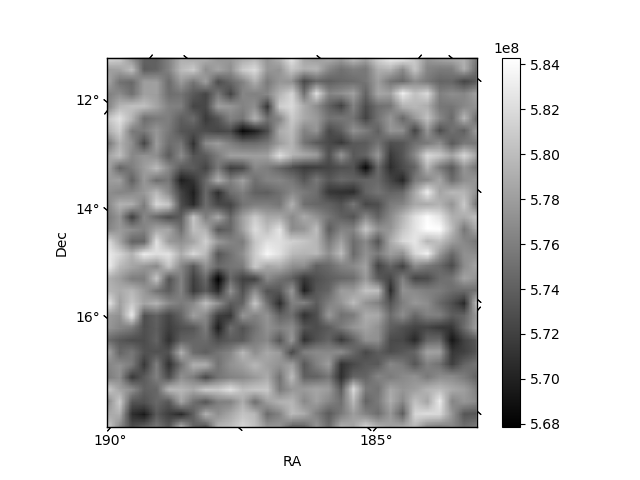
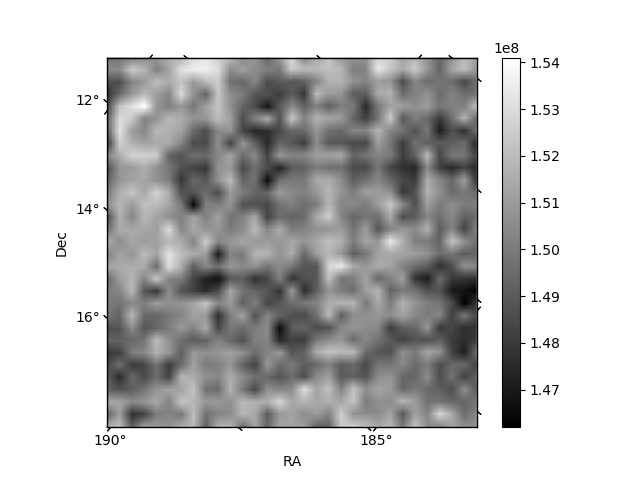
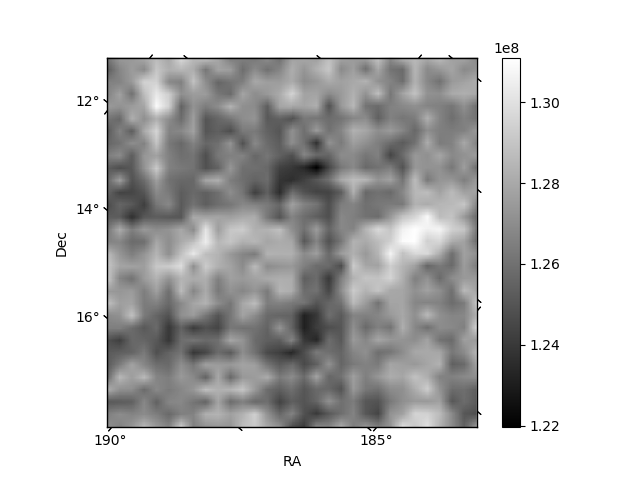
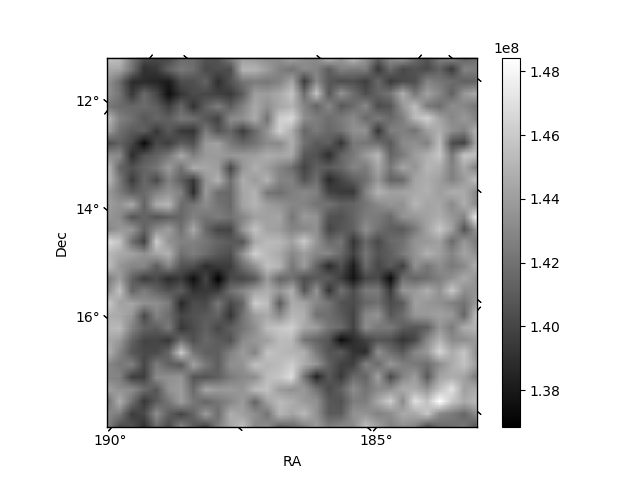
Histogram calculated using DETX and DETY for each event in the final _common_clean file
| Quadrant A | 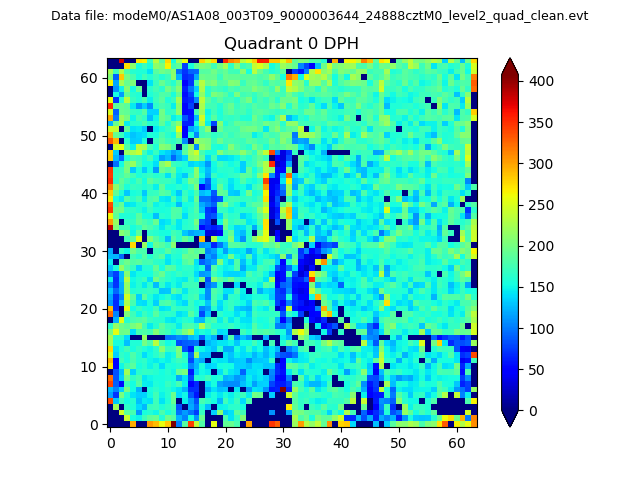 |
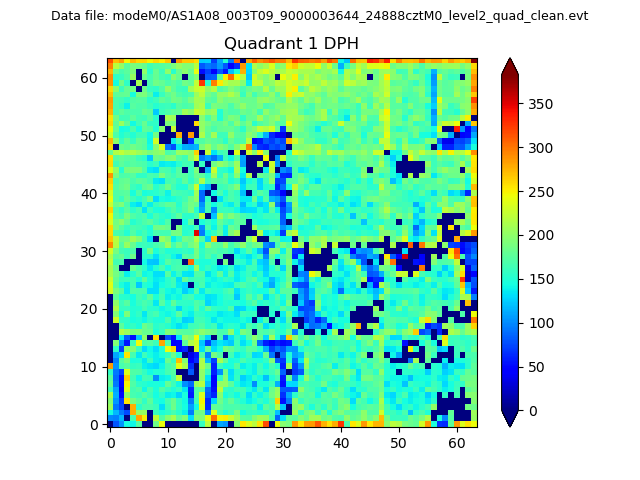 |
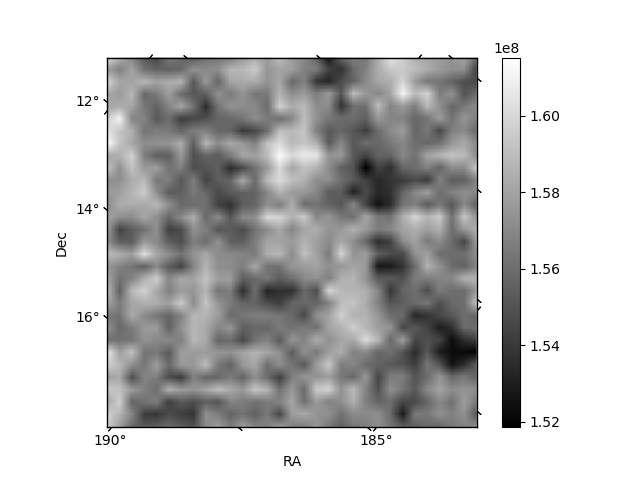
Quadrant B |
|---|---|---|---|
| Quadrant D | 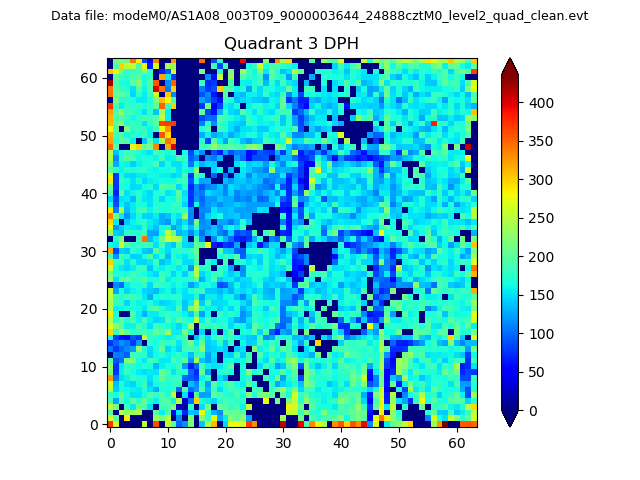 |
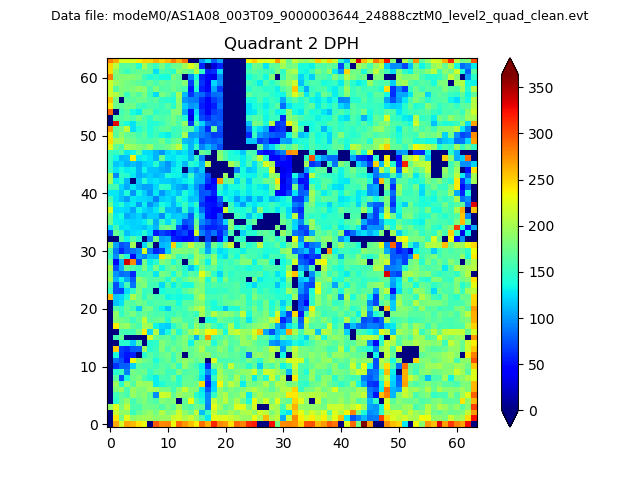 |
Quadrant C |
| Plot type | Count rate plots | Images |
|---|---|---|
| Comparison with Poisson distribution Blue bars denote a histogram of data divided into 1 sec bins. Red curve is a Poisson curve with rate = median count rate of data. |
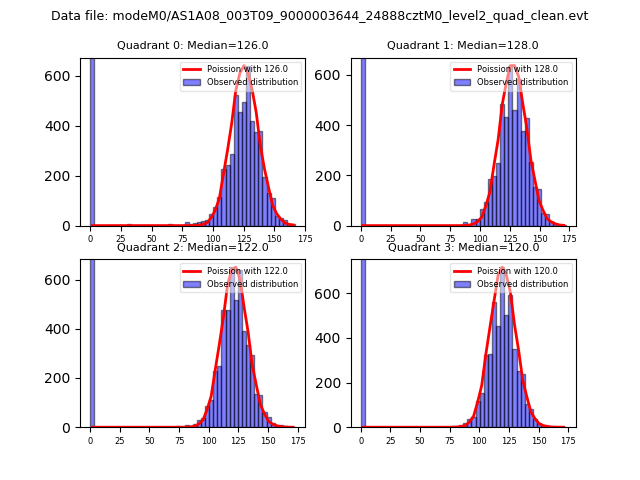 |
 |
| Quadrant-wise count rates Data is divided into 100 sec bins |
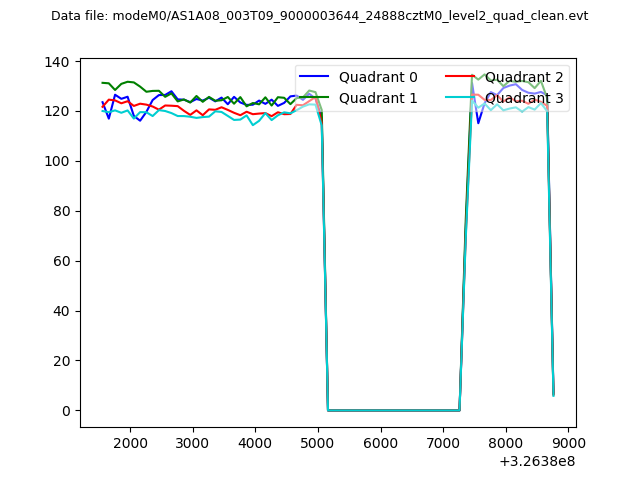 |
|
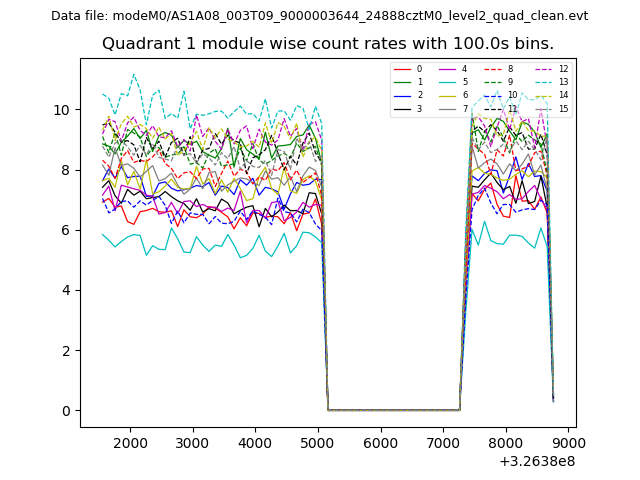
| Module-wise count rates for Quadrant A Data is divided into 100 sec bins |
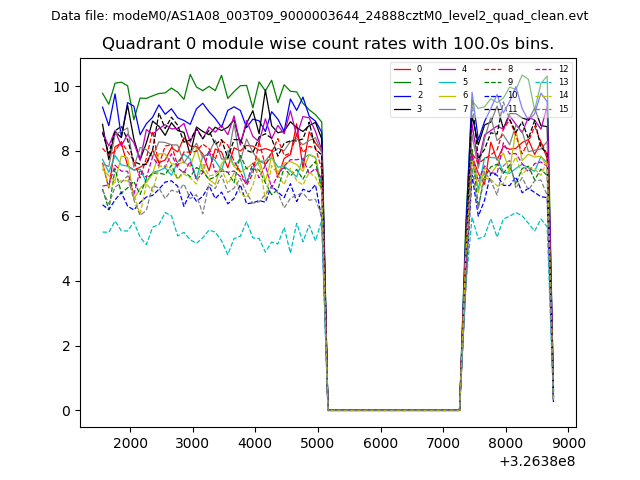 |
 |
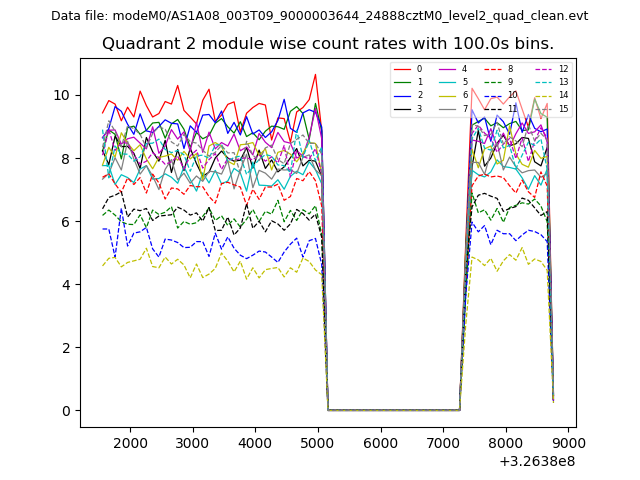
| Module-wise count rates for Quadrant B Data is divided into 100 sec bins |
 |
 |
| Module-wise count rates for Quadrant C Data is divided into 100 sec bins |
 |
 |
| Module-wise count rates for Quadrant D Data is divided into 100 sec bins |
 |
 |
| Parameter | Plot |
|---|---|
| CZT HV Monitor | 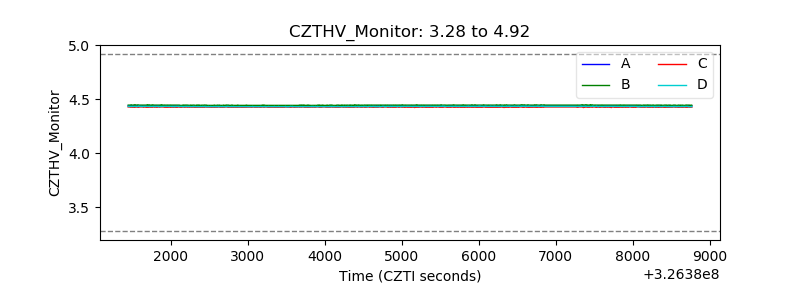 |
| D_VDD | 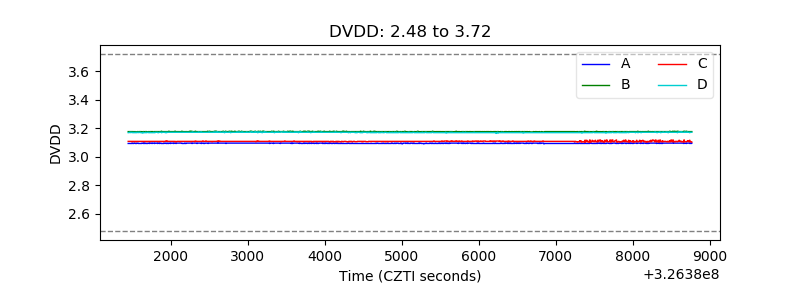 |
| Temperature 1 | 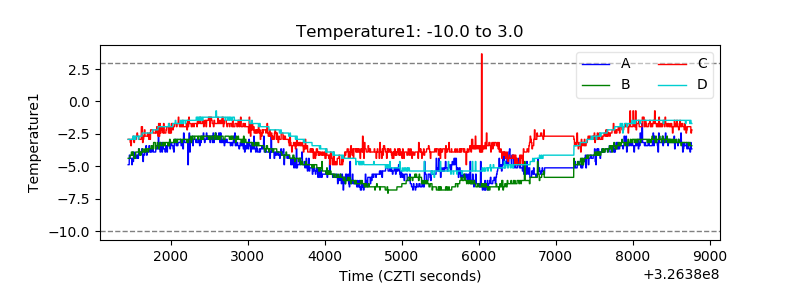 |
| Veto HV Monitor | 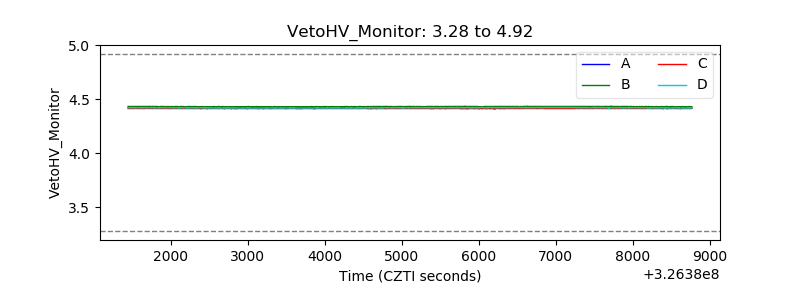 |
| Veto LLD | 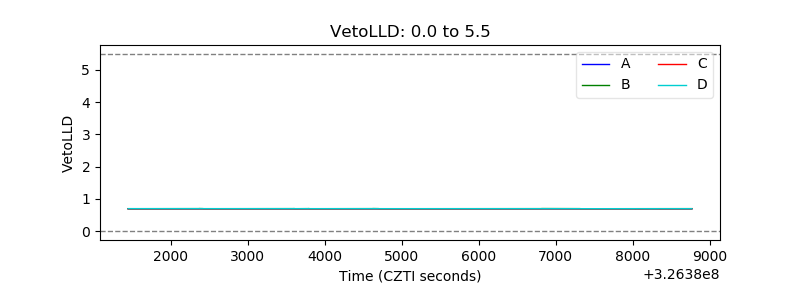 |
| Alpha Counter | 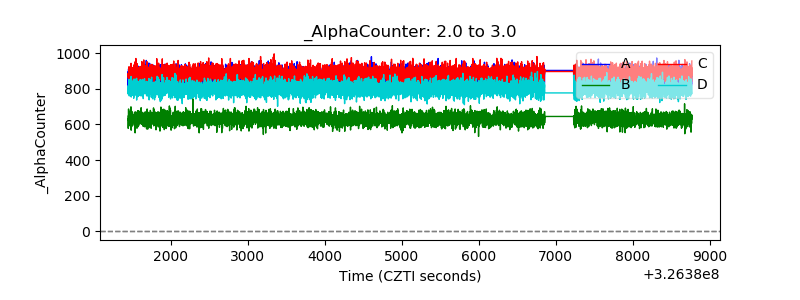 |
| _CPM_Rate | 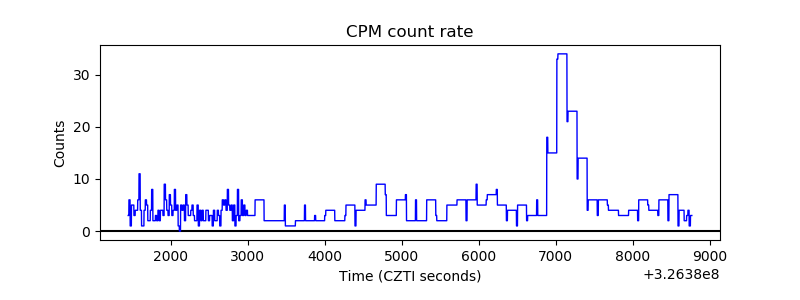 |
| CZT Counter | 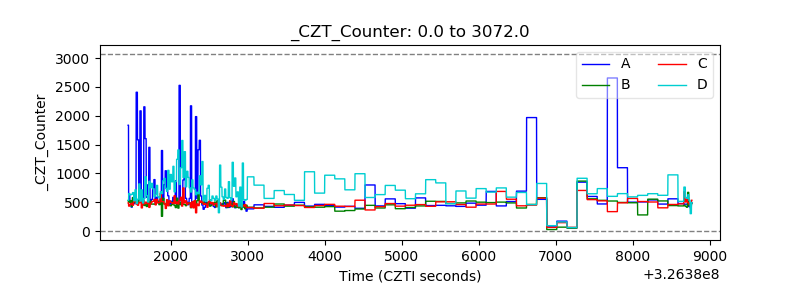 |
| +2.5 Volts monitor |  |
| +5 Volts monitor |  |
| _ROLL_ROT | 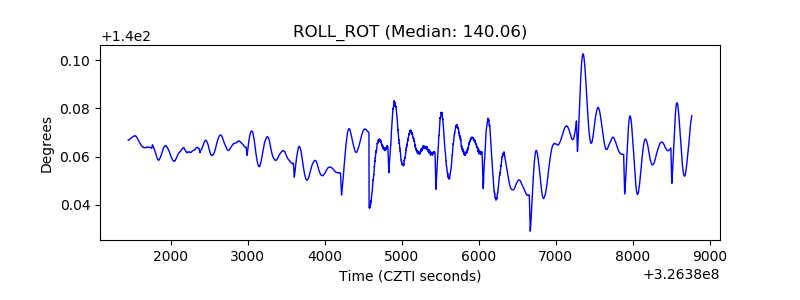 |
| _Roll_DEC | 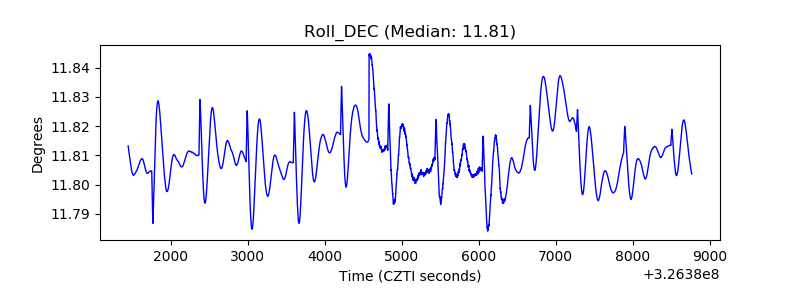 |
| _Roll_RA | 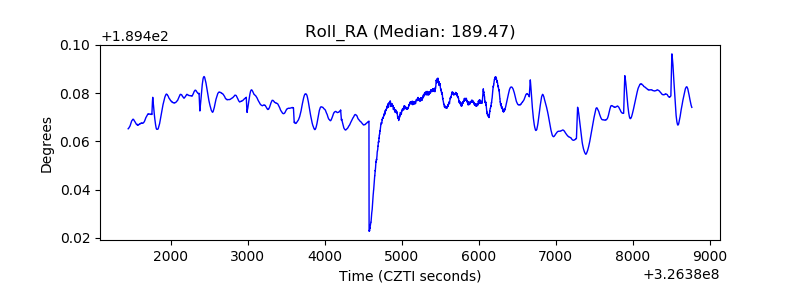 |
| Veto Counter |  |