| Param | Original file | Final file |
|---|---|---|
| Filename | modeM0/AS1A08_003T09_9000003644_24891cztM0_level2.evt | modeM0/AS1A08_003T09_9000003644_24891cztM0_level2_quad_clean.evt |
| Size (bytes) | 475,551,360 | 90,642,240 |
| Size | 453.5 MB | 86.4 MB |
| Events in quadrant A | 3,144,952 | 583,419 |
| Events in quadrant B | 3,209,410 | 592,132 |
| Events in quadrant C | 3,557,344 | 563,210 |
| Events in quadrant D | 4,039,381 | 543,096 |
| Mode M9 | |||
|---|---|---|---|
| Quadrant | BADHDUFLAG | Total packets | Discarded packets |
| A | 0 | 11 | 0 |
| B | 0 | 12 | 0 |
| C | 0 | 12 | 0 |
| D | 0 | 12 | 0 |
| Mode M0 | |||
|---|---|---|---|
| Quadrant | BADHDUFLAG | Total packets | Discarded packets |
| A | 0 | 13686 | 2 |
| B | 0 | 13784 | 2 |
| C | 0 | 14603 | 2 |
| D | 0 | 16623 | 3 |
| Mode SS | |||
|---|---|---|---|
| Quadrant | BADHDUFLAG | Total packets | Discarded packets |
| A | 0 | 134 | 0 |
| B | 0 | 134 | 0 |
| C | 0 | 134 | 0 |
| D | 0 | 134 | 0 |
| Quadrant | Total seconds | Saturated seconds | Saturation percentage |
|---|---|---|---|
| A | 6644 | 35 | 0.526791% |
| B | 6644 | 40 | 0.602047% |
| C | 6644 | 87 | 1.309452% |
| D | 6643 | 158 | 2.378443% |
Noise dominated data is calculated using 1-second bins in cleaned event files. If a bin has >2000 counts, and if more than 50% of those come from <1% of pixels, then it is considered to be noise-dominated and hence unusable.
| Quadrant | # 1 sec bins | Bins with >0 counts | Bins with >2000 counts | High rate bins dominated by noise | Noise dominated (total time) | Noise dominated (detector-on time) | Marked lightcurve |
|---|---|---|---|---|---|---|---|
| A | 7599 | 6645 | 0 | 0 | 0.00% | 0.00% | 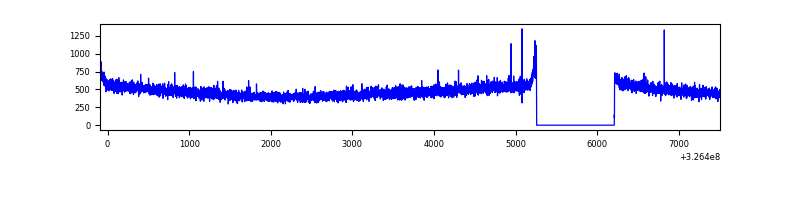 |
| B | 7599 | 6645 | 0 | 0 | 0.00% | 0.00% | 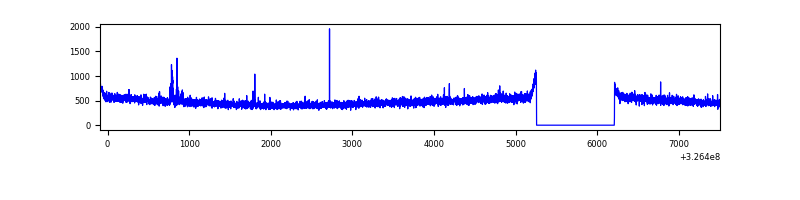 |
| C | 7599 | 6645 | 4 | 4 | 0.05% | 0.06% | 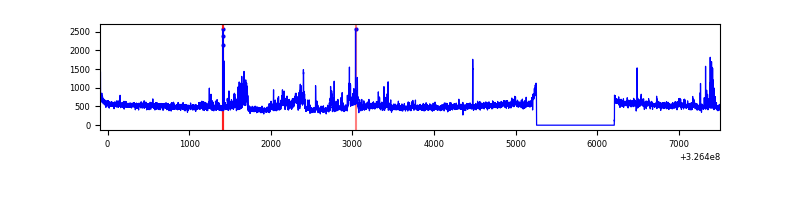 |
| D | 7598 | 6644 | 132 | 132 | 1.74% | 1.99% | 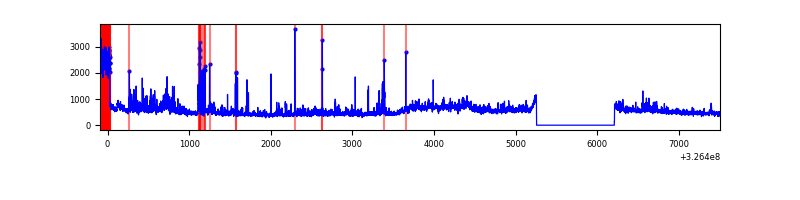 |
Top three noisy pixels from each quadrant. If the there are fewer than three noisy pixels in the level2.evt file, extra rows are filled as -1
| Pixel properties | Quadrant properties | ||||||
|---|---|---|---|---|---|---|---|
| Quadrant | DetID | PixID | Counts | Sigma | Mean | Median | Sigma |
| A | 13 | 254 | 10420 | 58.86 | 815 | 798 | 163.5 |
| A | 3 | 137 | 7528 | 41.17 | 815 | 798 | 163.5 |
| A | 0 | 226 | 7000 | 37.94 | 815 | 798 | 163.5 |
| B | 12 | 111 | 19315 | 118.35 | 808 | 785 | 156.6 |
| B | 0 | 190 | 18420 | 112.63 | 808 | 785 | 156.6 |
| B | 11 | 111 | 17768 | 108.47 | 808 | 785 | 156.6 |
| C | 7 | 247 | 343950 | 1868.53 | 782 | 790 | 183.7 |
| C | 14 | 238 | 123169 | 666.36 | 782 | 790 | 183.7 |
| C | 2 | 16 | 40149 | 214.31 | 782 | 790 | 183.7 |
| D | 7 | 238 | 510087 | 2691.47 | 782 | 759 | 189.2 |
| D | 1 | 52 | 389100 | 2052.13 | 782 | 759 | 189.2 |
| D | 8 | 195 | 174555 | 918.4 | 782 | 759 | 189.2 |
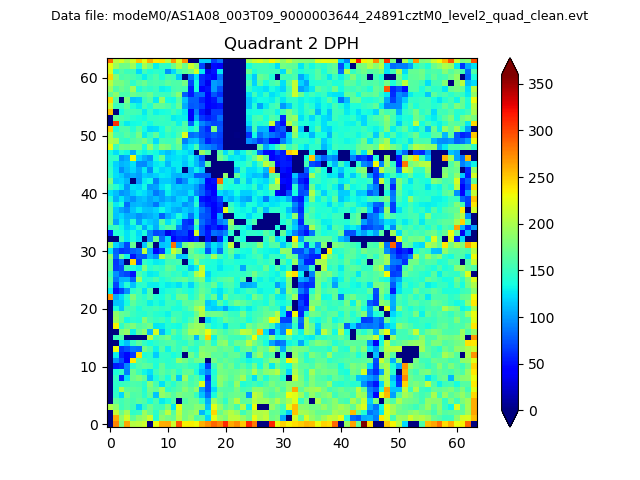
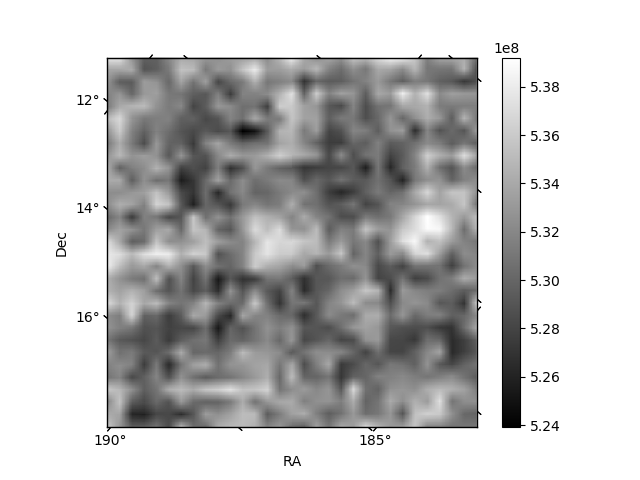
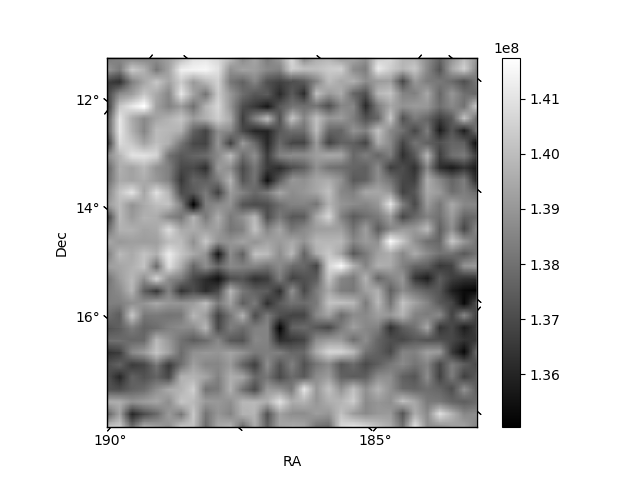
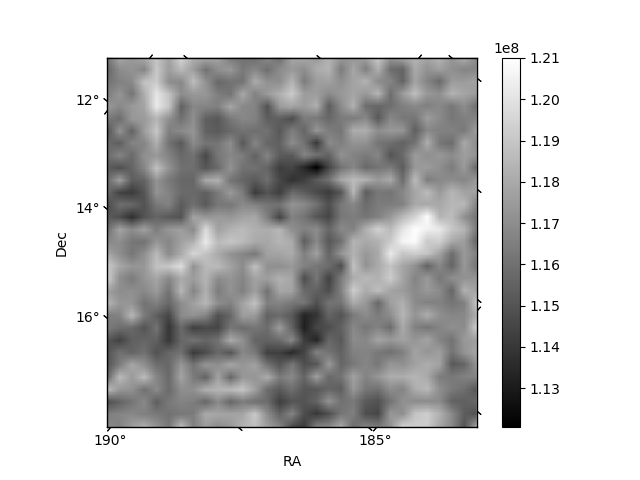
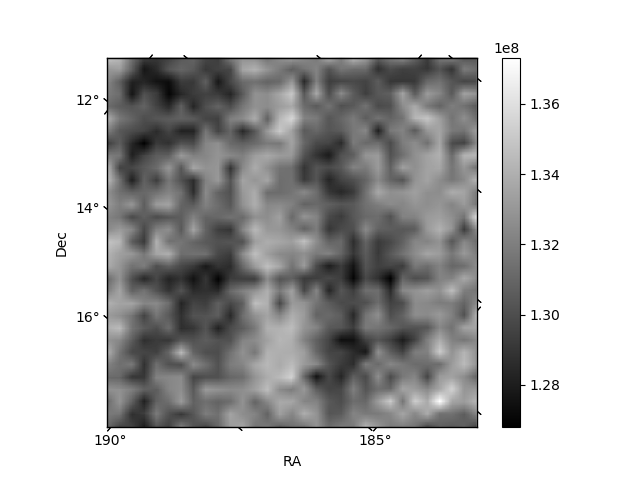
Histogram calculated using DETX and DETY for each event in the final _common_clean file
| Quadrant A | 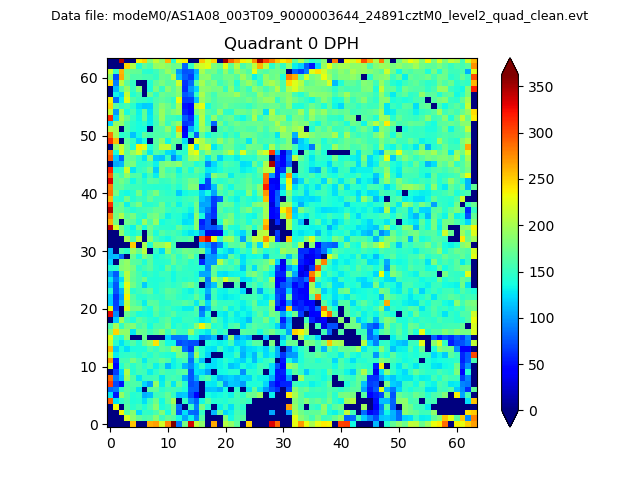 |
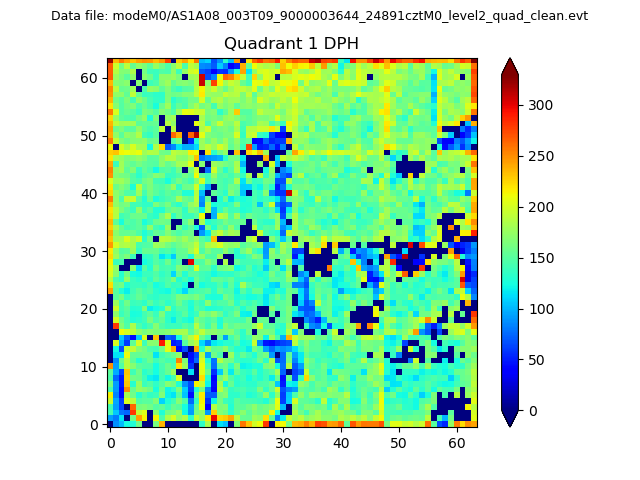 |
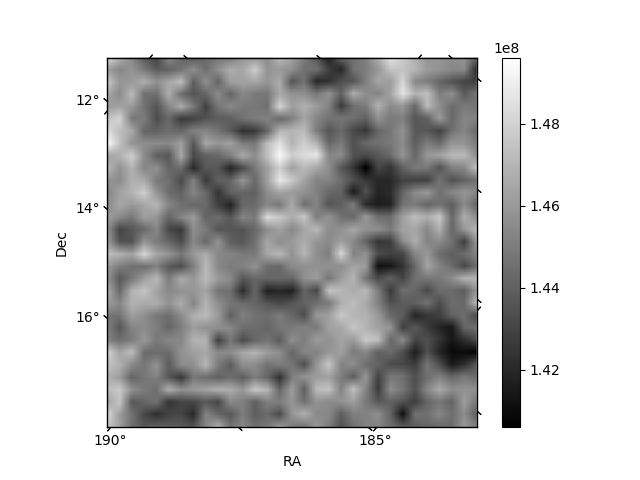
Quadrant B |
|---|---|---|---|
| Quadrant D | 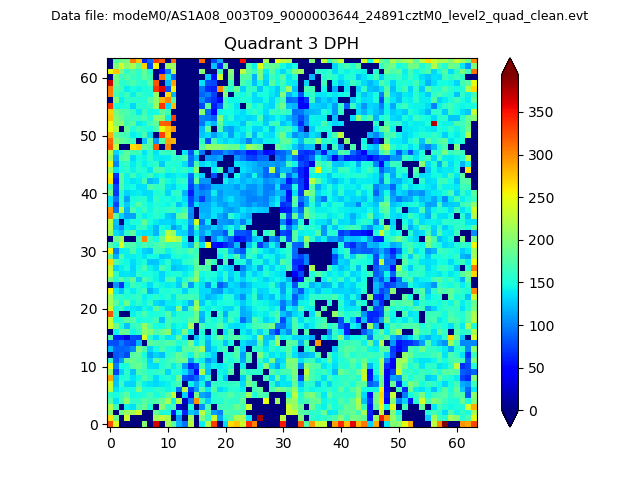 |
 |
Quadrant C |
| Plot type | Count rate plots | Images |
|---|---|---|
| Comparison with Poisson distribution Blue bars denote a histogram of data divided into 1 sec bins. Red curve is a Poisson curve with rate = median count rate of data. |
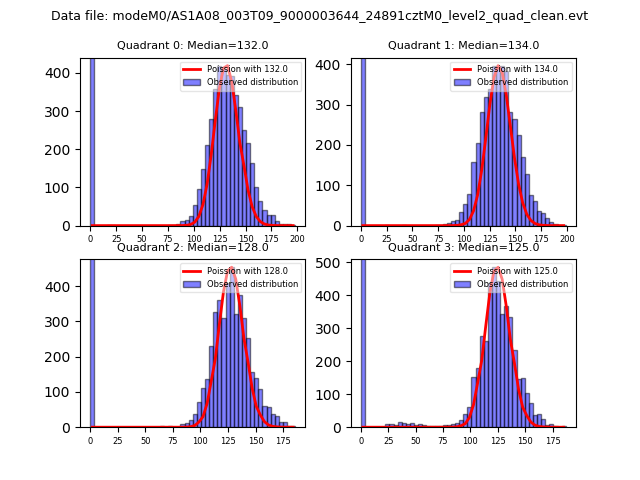 |
 |
| Quadrant-wise count rates Data is divided into 100 sec bins |
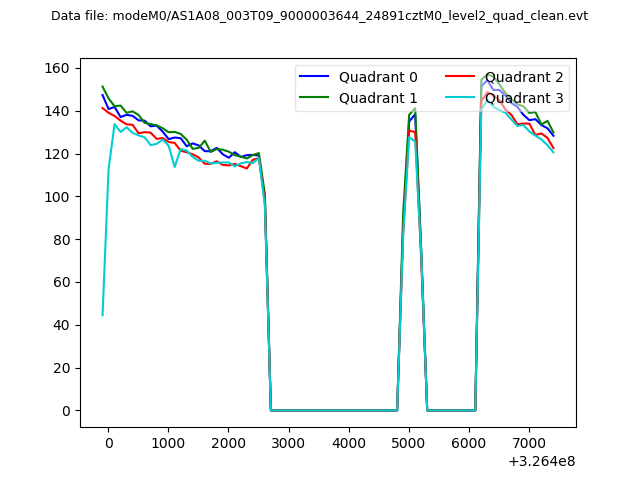 |
|
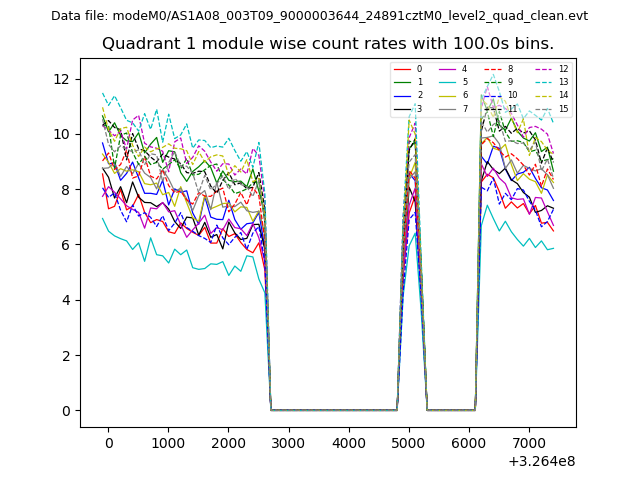
| Module-wise count rates for Quadrant A Data is divided into 100 sec bins |
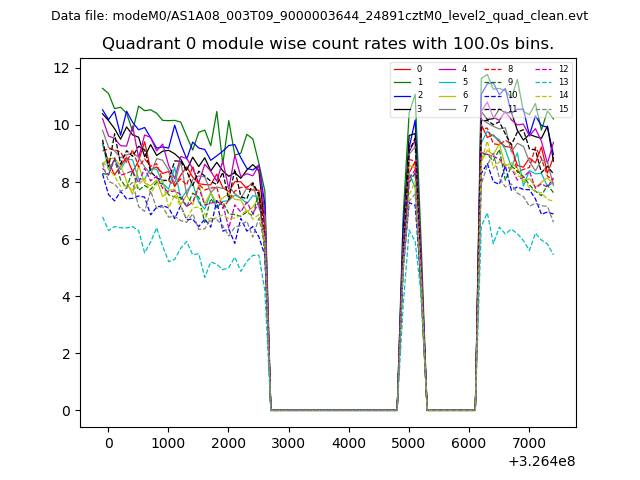 |
 |
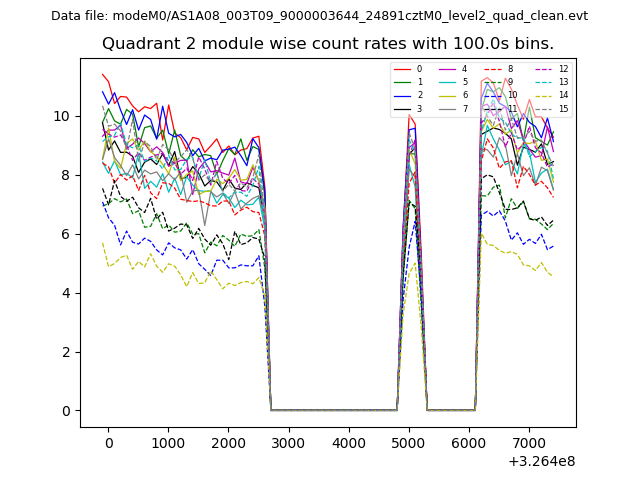
| Module-wise count rates for Quadrant B Data is divided into 100 sec bins |
 |
 |
| Module-wise count rates for Quadrant C Data is divided into 100 sec bins |
 |
 |
| Module-wise count rates for Quadrant D Data is divided into 100 sec bins |
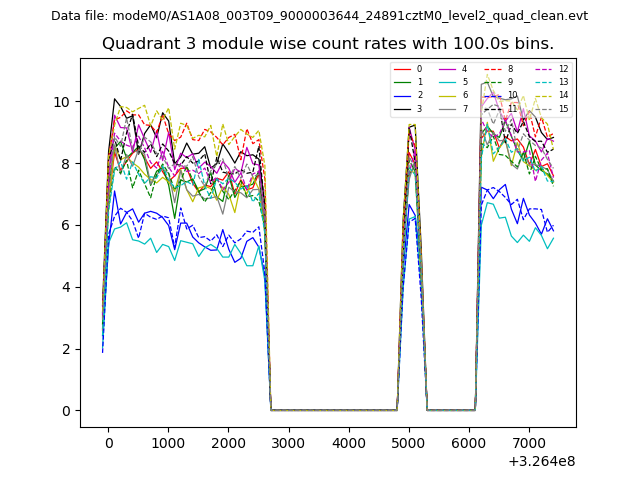 |
 |
| Parameter | Plot |
|---|---|
| CZT HV Monitor | 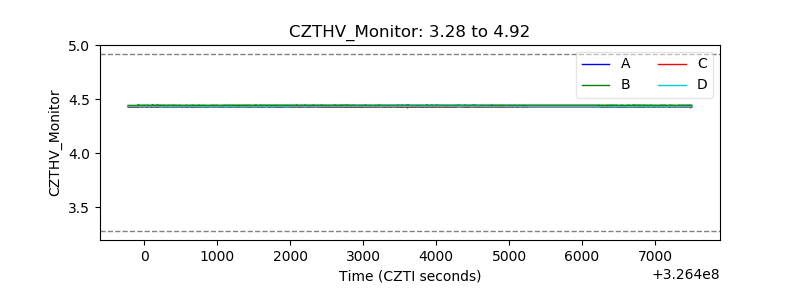 |
| D_VDD | 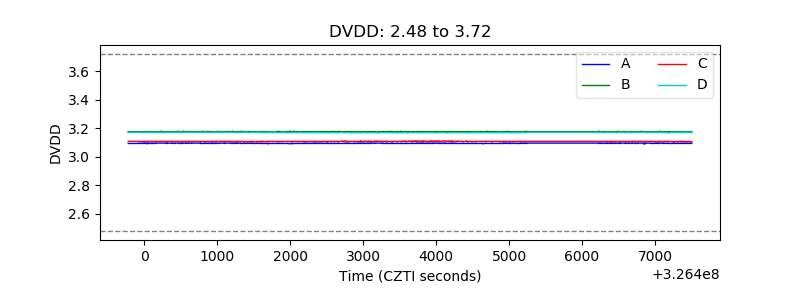 |
| Temperature 1 | 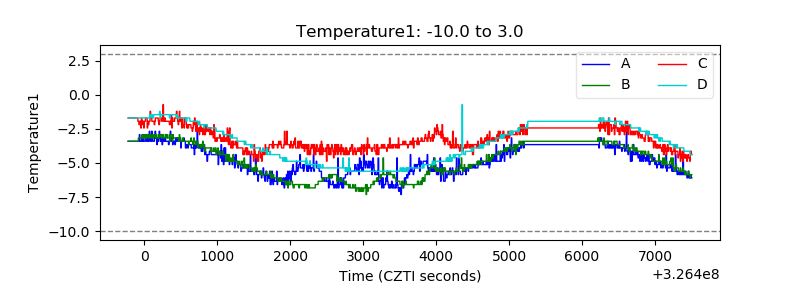 |
| Veto HV Monitor | 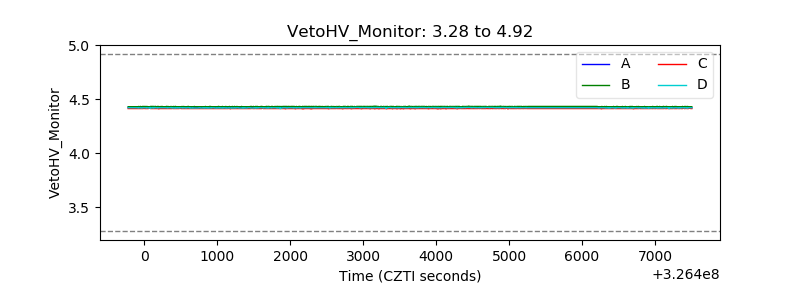 |
| Veto LLD | 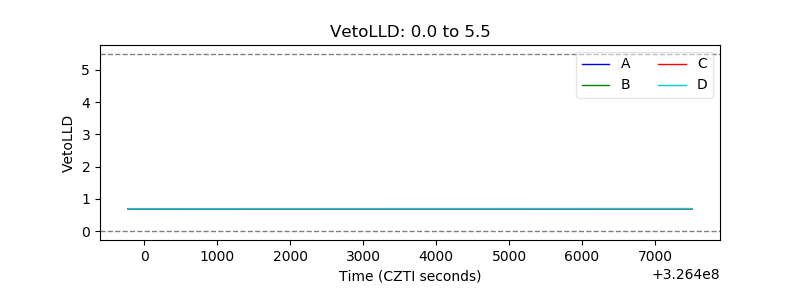 |
| Alpha Counter | 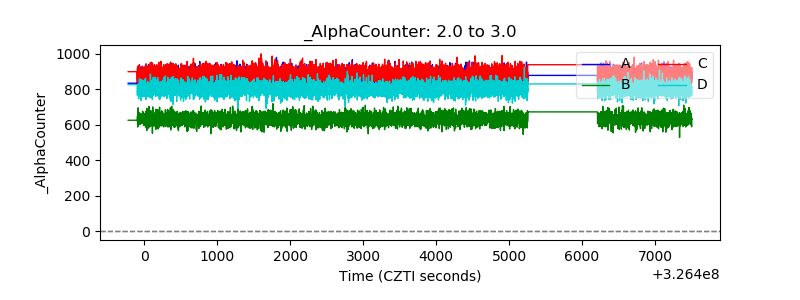 |
| _CPM_Rate | 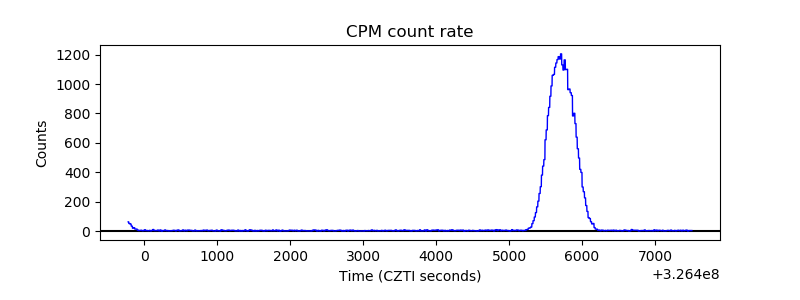 |
| CZT Counter | 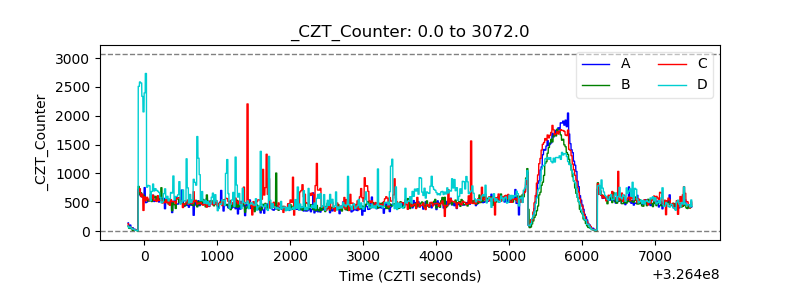 |
| +2.5 Volts monitor |  |
| +5 Volts monitor |  |
| _ROLL_ROT | 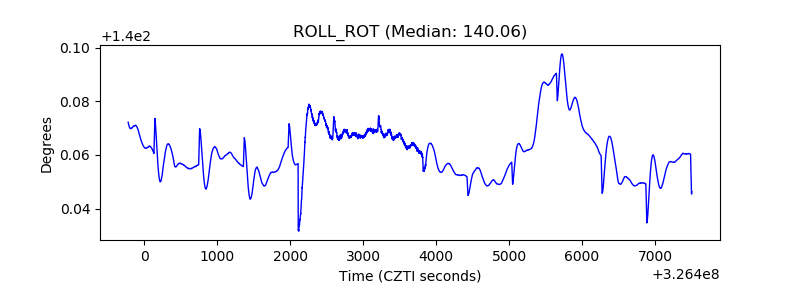 |
| _Roll_DEC | 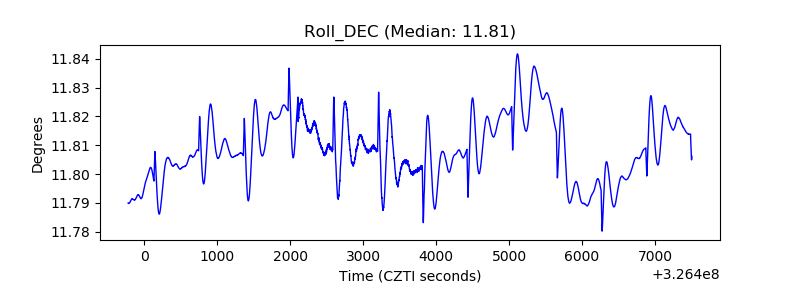 |
| _Roll_RA | 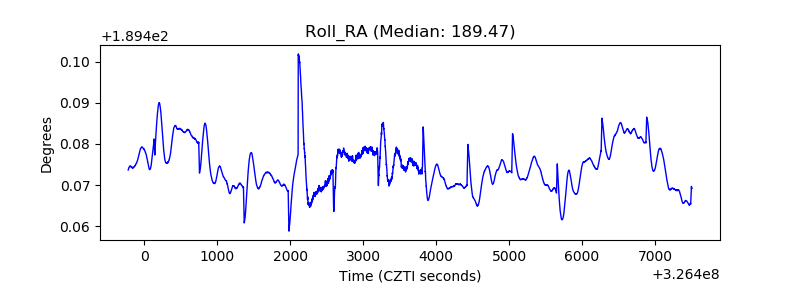 |
| Veto Counter | 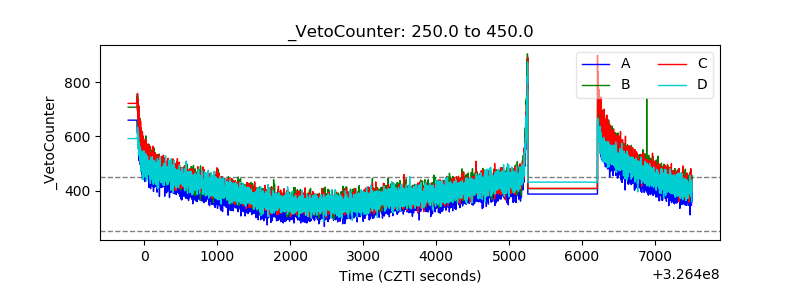 |