| Param | Original file | Final file |
|---|---|---|
| Filename | modeM0/AS1A08_003T09_9000003644_24894cztM0_level2.evt | modeM0/AS1A08_003T09_9000003644_24894cztM0_level2_quad_clean.evt |
| Size (bytes) | 86,569,920 | 25,776,000 |
| Size | 82.6 MB | 24.6 MB |
| Events in quadrant A | 592,557 | 176,970 |
| Events in quadrant B | 610,773 | 183,081 |
| Events in quadrant C | 636,471 | 170,104 |
| Events in quadrant D | 701,933 | 163,826 |
| Mode M9 | |||
|---|---|---|---|
| Quadrant | BADHDUFLAG | Total packets | Discarded packets |
| A | 0 | 8 | 0 |
| B | 0 | 9 | 0 |
| C | 0 | 9 | 0 |
| D | 0 | 9 | 0 |
| Mode M0 | |||
|---|---|---|---|
| Quadrant | BADHDUFLAG | Total packets | Discarded packets |
| A | 0 | 2433 | 1 |
| B | 0 | 2483 | 1 |
| C | 0 | 2572 | 1 |
| D | 0 | 2826 | 1 |
| Mode SS | |||
|---|---|---|---|
| Quadrant | BADHDUFLAG | Total packets | Discarded packets |
| A | 0 | 22 | 0 |
| B | 0 | 22 | 0 |
| C | 0 | 22 | 0 |
| D | 0 | 22 | 0 |
| Quadrant | Total seconds | Saturated seconds | Saturation percentage |
|---|---|---|---|
| A | 1136 | 2 | 0.176056% |
| B | 1136 | 4 | 0.352113% |
| C | 1136 | 21 | 1.848592% |
| D | 1136 | 8 | 0.704225% |
Noise dominated data is calculated using 1-second bins in cleaned event files. If a bin has >2000 counts, and if more than 50% of those come from <1% of pixels, then it is considered to be noise-dominated and hence unusable.
| Quadrant | # 1 sec bins | Bins with >0 counts | Bins with >2000 counts | High rate bins dominated by noise | Noise dominated (total time) | Noise dominated (detector-on time) | Marked lightcurve |
|---|---|---|---|---|---|---|---|
| A | 1136 | 1136 | 0 | 0 | 0.00% | 0.00% | 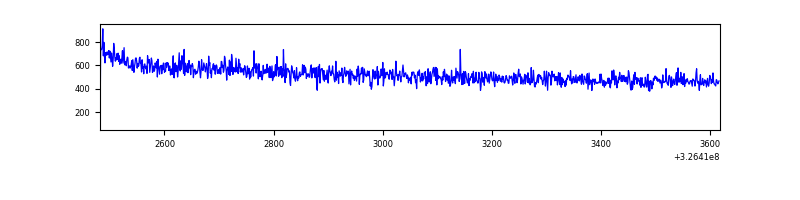 |
| B | 1136 | 1136 | 0 | 0 | 0.00% | 0.00% | 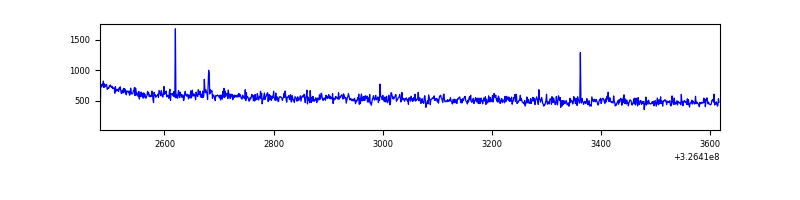 |
| C | 1136 | 1136 | 0 | 0 | 0.00% | 0.00% | 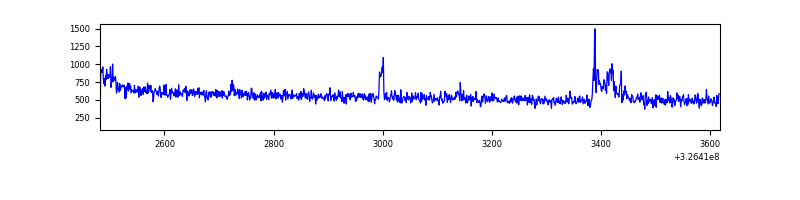 |
| D | 1136 | 1136 | 2 | 2 | 0.18% | 0.18% |  |
Top three noisy pixels from each quadrant. If the there are fewer than three noisy pixels in the level2.evt file, extra rows are filled as -1
| Pixel properties | Quadrant properties | ||||||
|---|---|---|---|---|---|---|---|
| Quadrant | DetID | PixID | Counts | Sigma | Mean | Median | Sigma |
| A | 13 | 254 | 1776 | 50.37 | 153 | 150 | 32.3 |
| A | 3 | 137 | 1332 | 36.62 | 153 | 150 | 32.3 |
| A | 0 | 226 | 1326 | 36.43 | 153 | 150 | 32.3 |
| B | 12 | 111 | 3391 | 104.56 | 154 | 150 | 31.0 |
| B | 0 | 190 | 3259 | 100.3 | 154 | 150 | 31.0 |
| B | 11 | 111 | 3038 | 93.17 | 154 | 150 | 31.0 |
| C | 14 | 238 | 23898 | 645.3 | 150 | 150 | 36.8 |
| C | 2 | 16 | 18624 | 501.99 | 150 | 150 | 36.8 |
| C | 5 | 112 | 5765 | 152.58 | 150 | 150 | 36.8 |
| D | 7 | 238 | 60208 | 1591.33 | 149 | 144 | 37.7 |
| D | 1 | 52 | 52702 | 1392.47 | 149 | 144 | 37.7 |
| D | 8 | 195 | 15460 | 405.78 | 149 | 144 | 37.7 |
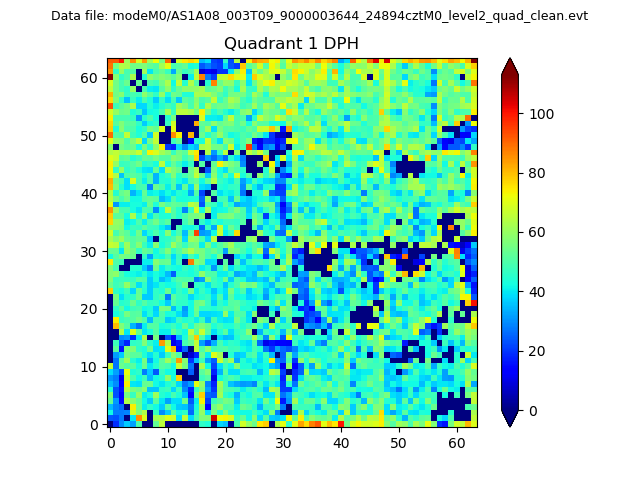
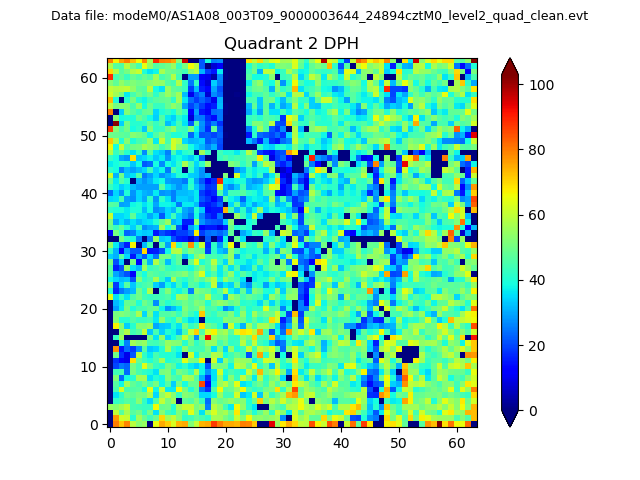
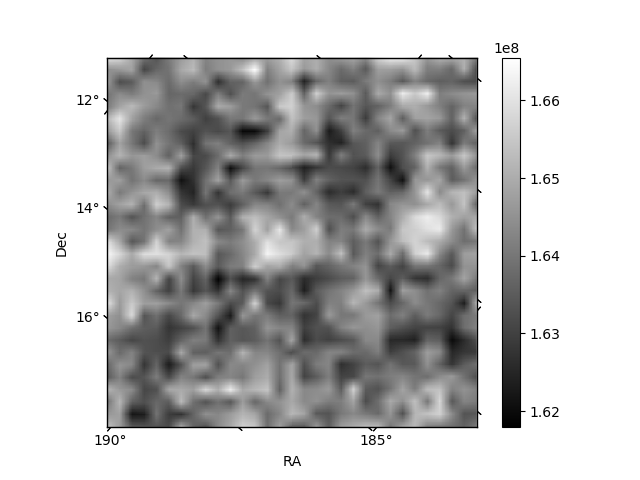
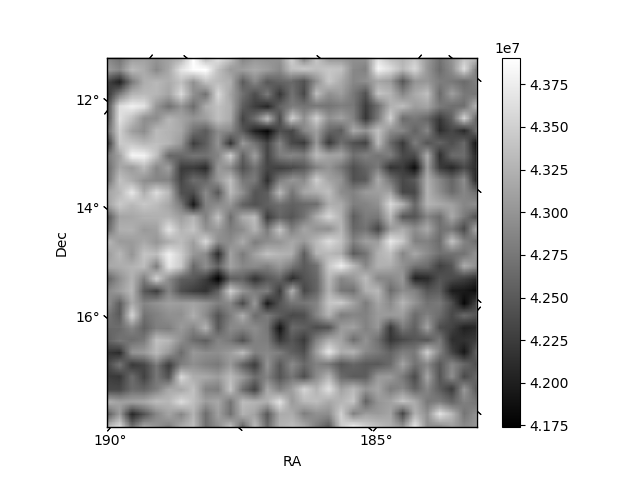
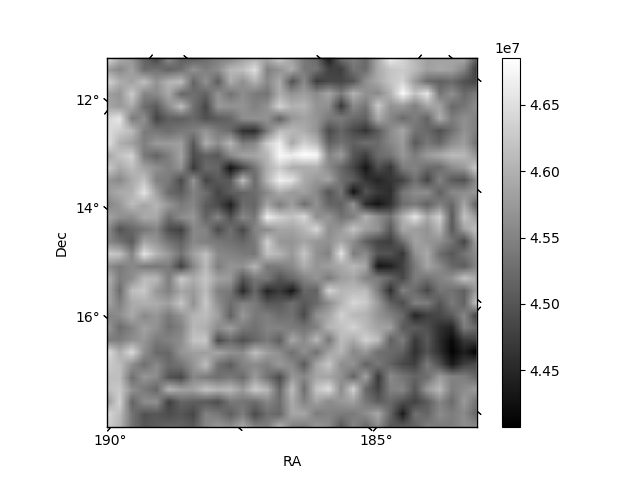
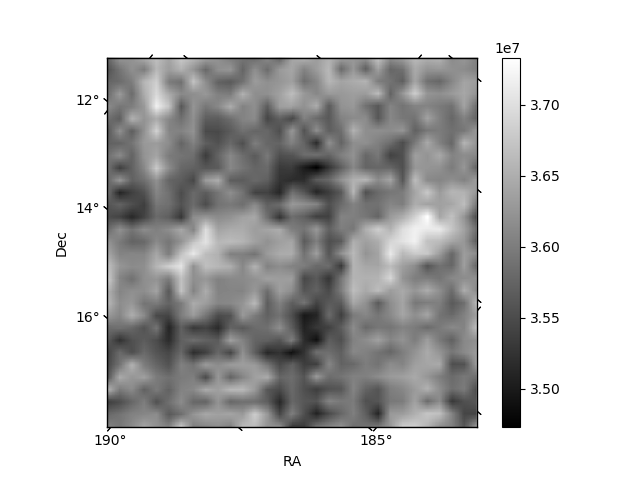
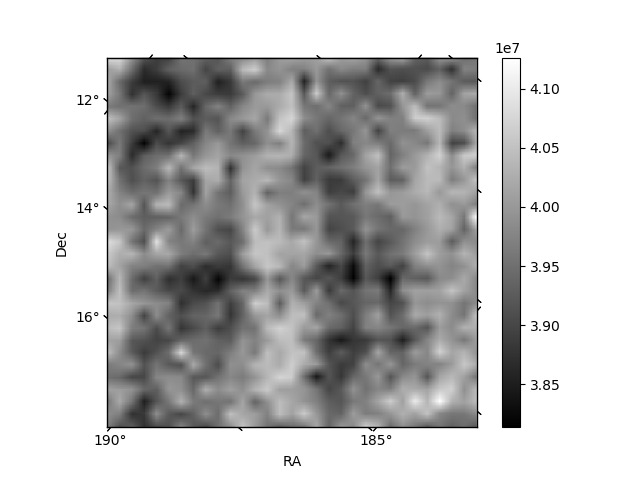
Histogram calculated using DETX and DETY for each event in the final _common_clean file
| Quadrant A | 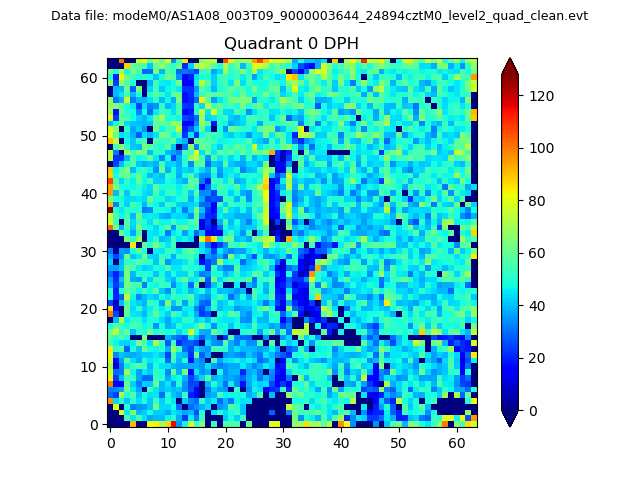 |
 |
Quadrant B |
|---|---|---|---|
| Quadrant D | 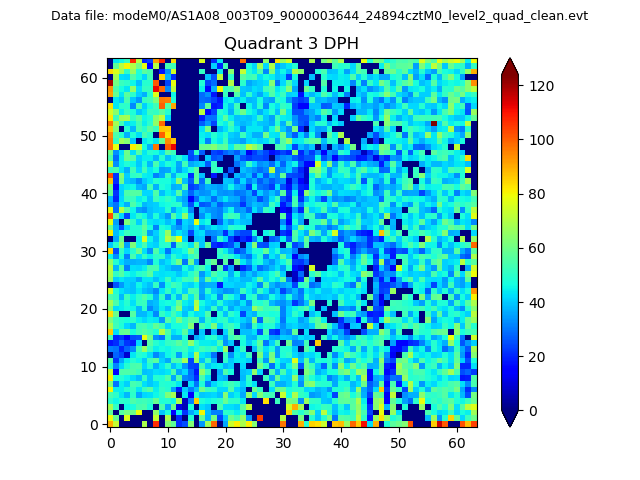 |
 |
Quadrant C |
| Plot type | Count rate plots | Images |
|---|---|---|
| Comparison with Poisson distribution Blue bars denote a histogram of data divided into 1 sec bins. Red curve is a Poisson curve with rate = median count rate of data. |
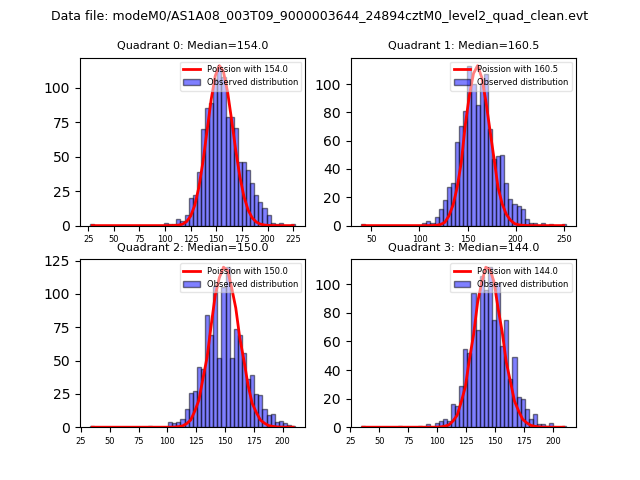 |
 |
| Quadrant-wise count rates Data is divided into 100 sec bins |
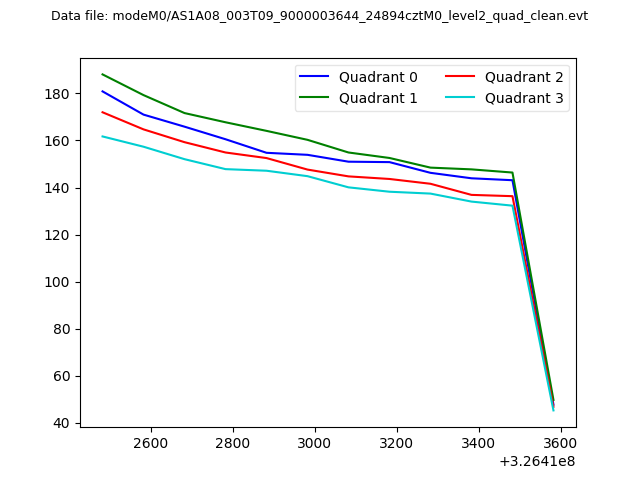 |
|
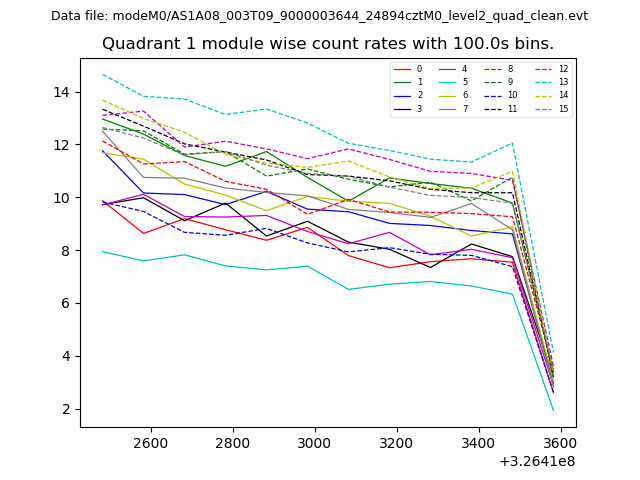
| Module-wise count rates for Quadrant A Data is divided into 100 sec bins |
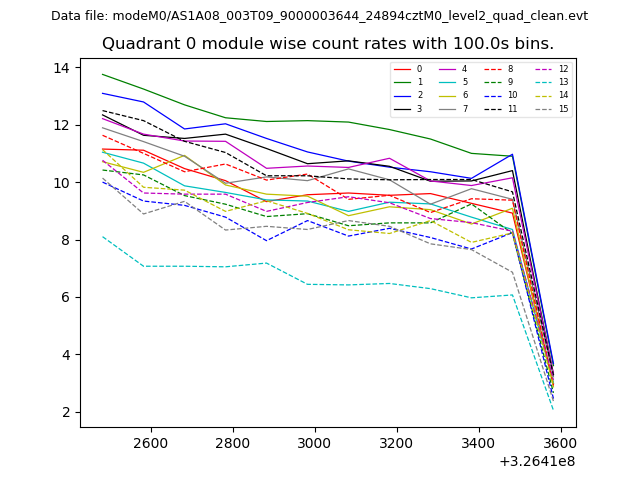 |
 |
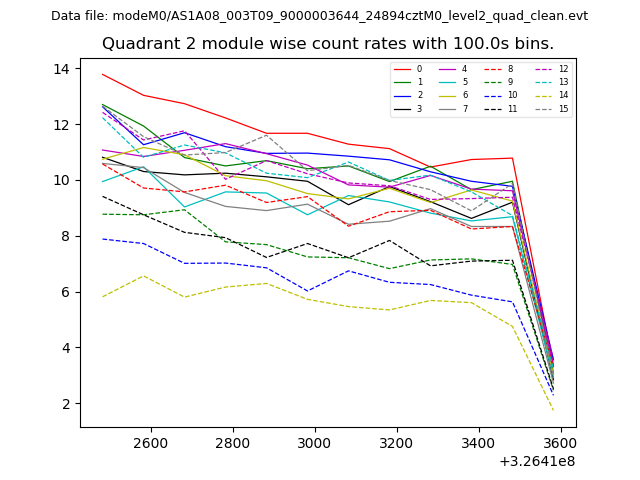
| Module-wise count rates for Quadrant B Data is divided into 100 sec bins |
 |
 |
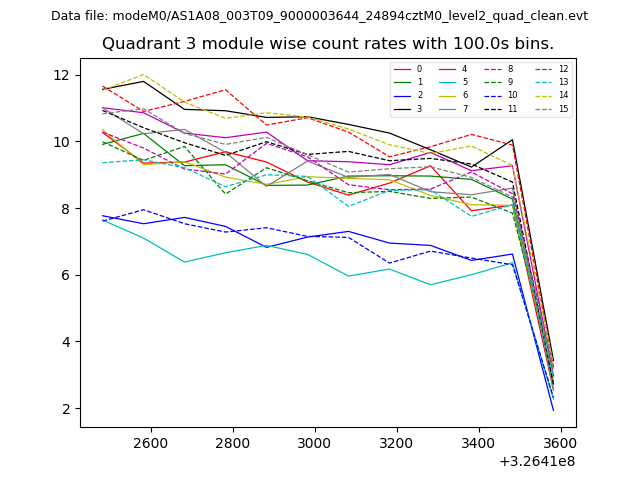
| Module-wise count rates for Quadrant C Data is divided into 100 sec bins |
 |
 |
| Module-wise count rates for Quadrant D Data is divided into 100 sec bins |
 |
 |
| Parameter | Plot |
|---|---|
| CZT HV Monitor | 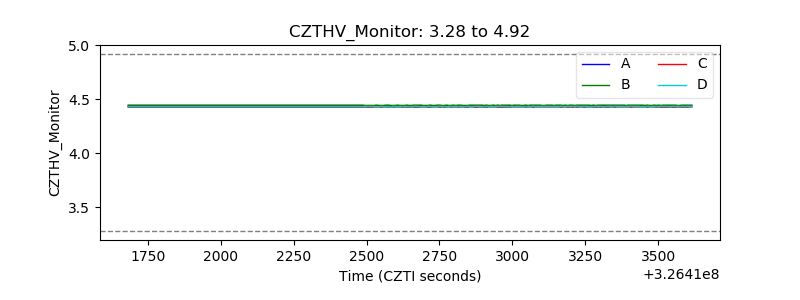 |
| D_VDD | 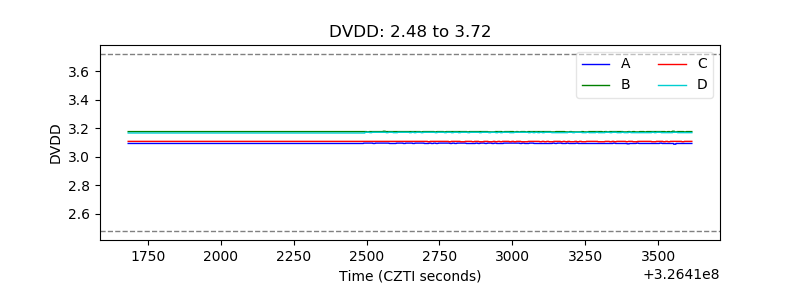 |
| Temperature 1 | 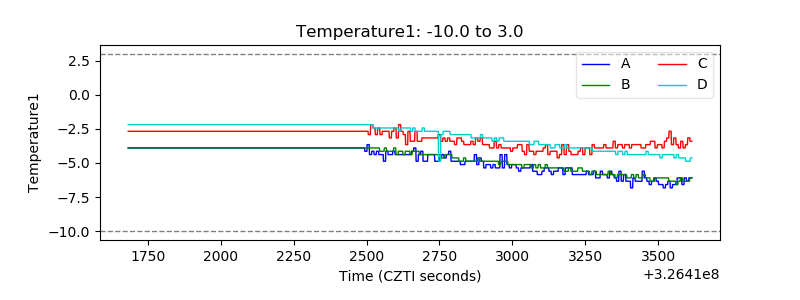 |
| Veto HV Monitor | 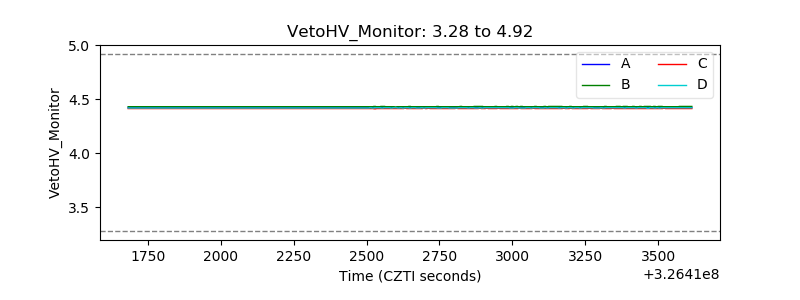 |
| Veto LLD | 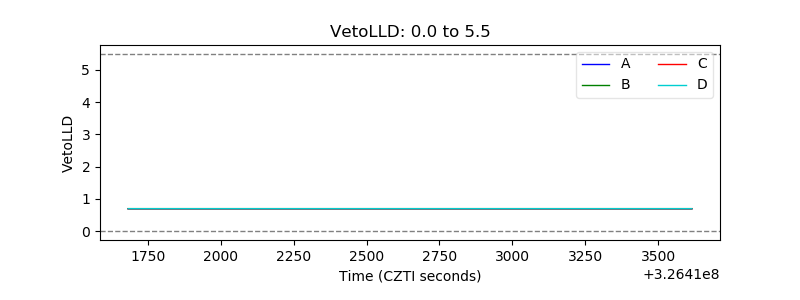 |
| Alpha Counter | 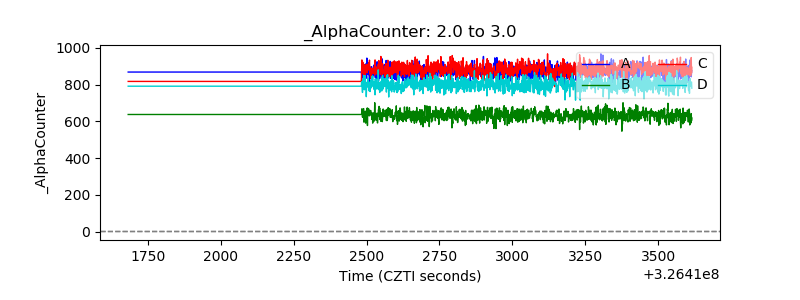 |
| _CPM_Rate | 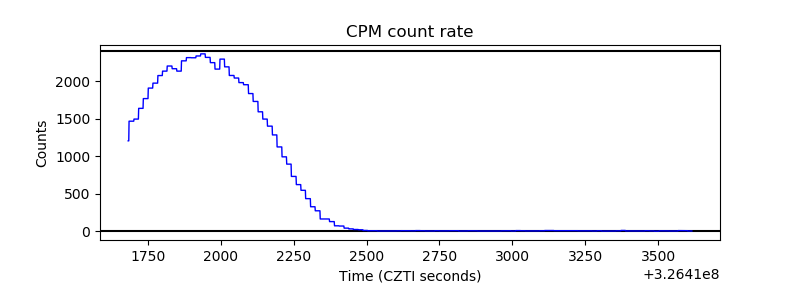 |
| CZT Counter | 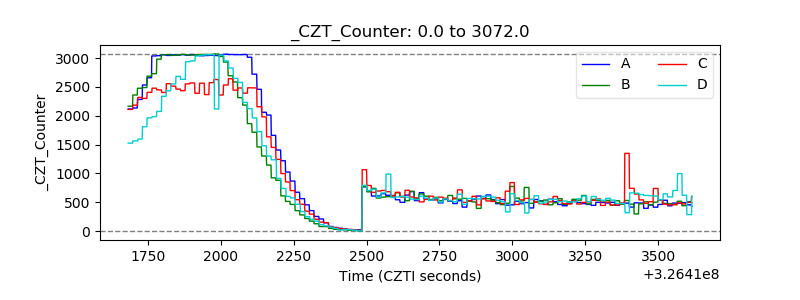 |
| +2.5 Volts monitor | 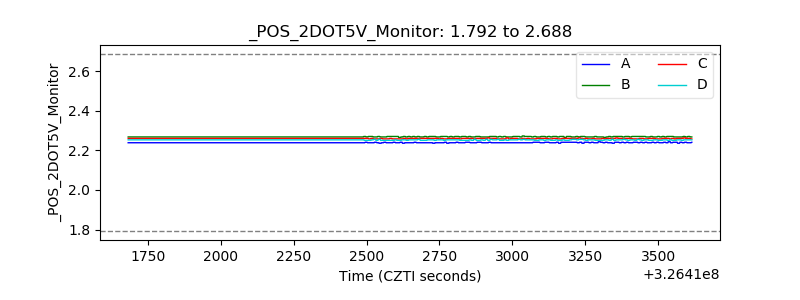 |
| +5 Volts monitor |  |
| _ROLL_ROT | 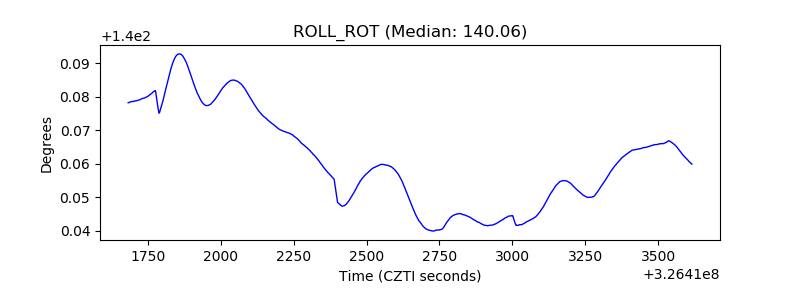 |
| _Roll_DEC |  |
| _Roll_RA | 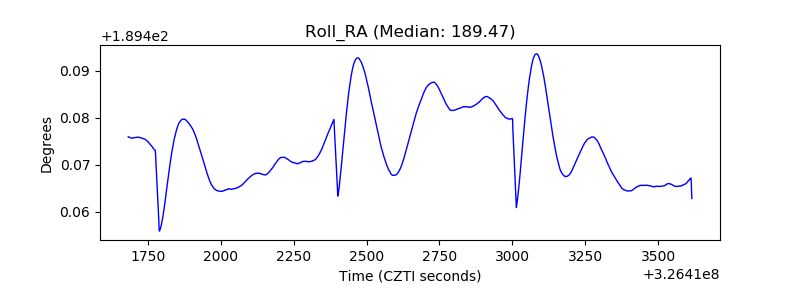 |
| Veto Counter | 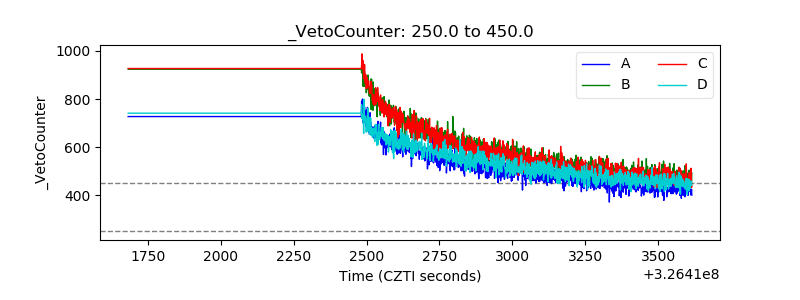 |