| Param | Original file | Final file |
|---|---|---|
| Filename | modeM0/AS1A08_003T13_9000003646cztM0_level2.fits | modeM0/AS1A08_003T13_9000003646cztM0_level2_quad_clean.evt |
| Size (bytes) | 464,068,800 | 313,467,840 |
| Size | 442.6 MB | 298.9 MB |
| Events in quadrant A | 2,924,092 | 1,708,188 |
| Events in quadrant B | 2,824,678 | 1,732,819 |
| Events in quadrant C | 2,804,064 | 1,603,300 |
| Events in quadrant D | 2,414,076 | 1,359,406 |
| Mode SS | |||
|---|---|---|---|
| Quadrant | BADHDUFLAG | Total packets | Discarded packets |
| A | 0 | 918 | 0 |
| B | 0 | 918 | 0 |
| C | 0 | 918 | 0 |
| D | 0 | 918 | 0 |
| Mode M0 | |||
|---|---|---|---|
| Quadrant | BADHDUFLAG | Total packets | Discarded packets |
| A | 0 | 96117 | 0 |
| B | 0 | 95224 | 0 |
| C | 0 | 97088 | 0 |
| D | 0 | 117116 | 0 |
| Mode M9 | |||
|---|---|---|---|
| Quadrant | BADHDUFLAG | Total packets | Discarded packets |
| A | 0 | 78 | 0 |
| B | 0 | 78 | 0 |
| C | 0 | 78 | 0 |
| D | 0 | 78 | 0 |
| Quadrant | Total seconds | Saturated seconds | Saturation percentage |
|---|---|---|---|
| A | 44972 | 854 | 1.898959% |
| B | 44972 | 783 | 1.741083% |
| C | 44972 | 986 | 2.192475% |
| D | 44972 | 2126 | 4.727386% |
Noise dominated data is calculated using 1-second bins in cleaned event files. If a bin has >2000 counts, and if more than 50% of those come from <1% of pixels, then it is considered to be noise-dominated and hence unusable.
| Quadrant | # 1 sec bins | Bins with >0 counts | Bins with >2000 counts | High rate bins dominated by noise | Noise dominated (total time) | Noise dominated (detector-on time) | Marked lightcurve |
|---|---|---|---|---|---|---|---|
| A | 52717 | 44972 | 0 | 0 | 0.00% | 0.00% |  |
| B | 52717 | 44972 | 0 | 0 | 0.00% | 0.00% |  |
| C | 52717 | 44974 | 0 | 0 | 0.00% | 0.00% |  |
| D | 52717 | 44918 | 0 | 0 | 0.00% | 0.00% |  |
Top three noisy pixels from each quadrant. If the there are fewer than three noisy pixels in the level2.evt file, extra rows are filled as -1
| Pixel properties | Quadrant properties | ||||||
|---|---|---|---|---|---|---|---|
| Quadrant | DetID | PixID | Counts | Sigma | Mean | Median | Sigma |
| A | 0 | 29 | 2750 | 11.01 | 761 | 717 | 184.7 |
| A | 7 | 110 | 2324 | 8.7 | 761 | 717 | 184.7 |
| A | 0 | 30 | 2198 | 8.02 | 761 | 717 | 184.7 |
| B | 2 | 9 | 2298 | 10.74 | 746 | 712 | 147.6 |
| B | 2 | 8 | 1921 | 8.19 | 746 | 712 | 147.6 |
| B | 3 | 80 | 1845 | 7.68 | 746 | 712 | 147.6 |
| C | 1 | 81 | 2123 | 7.58 | 740 | 695 | 188.4 |
| C | 1 | 80 | 2073 | 7.31 | 740 | 695 | 188.4 |
| C | 9 | 209 | 1885 | 6.31 | 740 | 695 | 188.4 |
| D | 10 | 189 | 1713 | 6.0 | 687 | 626 | 181.2 |
| D | 3 | 14 | 1694 | 5.89 | 687 | 626 | 181.2 |
| D | 6 | 67 | 1693 | 5.89 | 687 | 626 | 181.2 |
Histogram calculated using DETX and DETY for each event in the final _common_clean file
| Quadrant A | 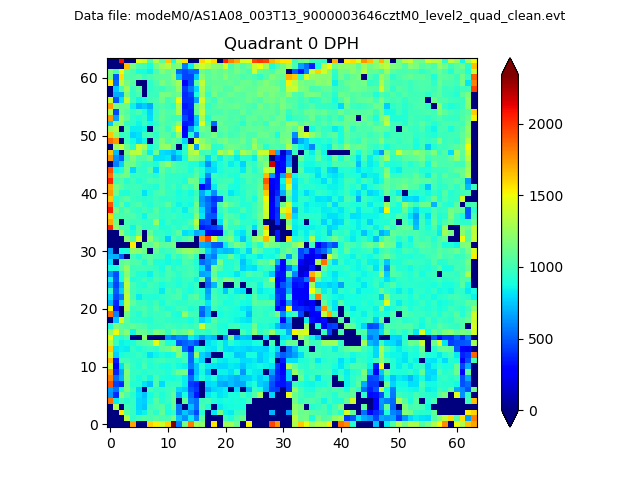 |
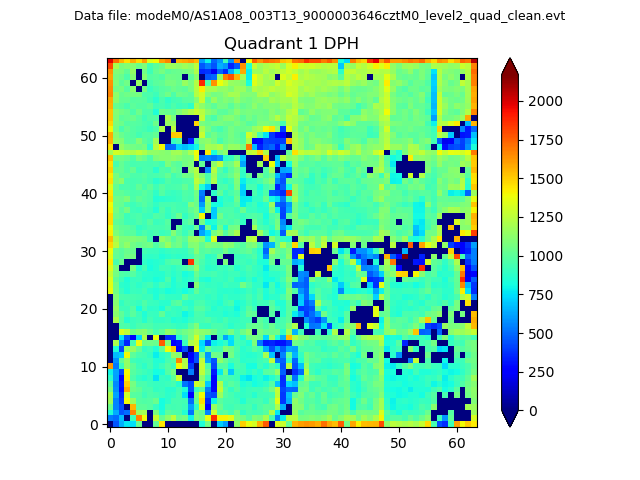 |
Quadrant B |
|---|---|---|---|
| Quadrant D | 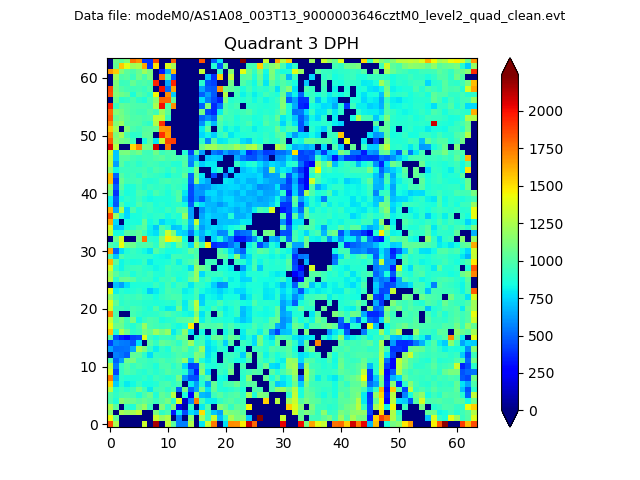 |
 |
Quadrant C |
| Plot type | Count rate plots | Images |
|---|---|---|
| Comparison with Poisson distribution Blue bars denote a histogram of data divided into 1 sec bins. Red curve is a Poisson curve with rate = median count rate of data. |
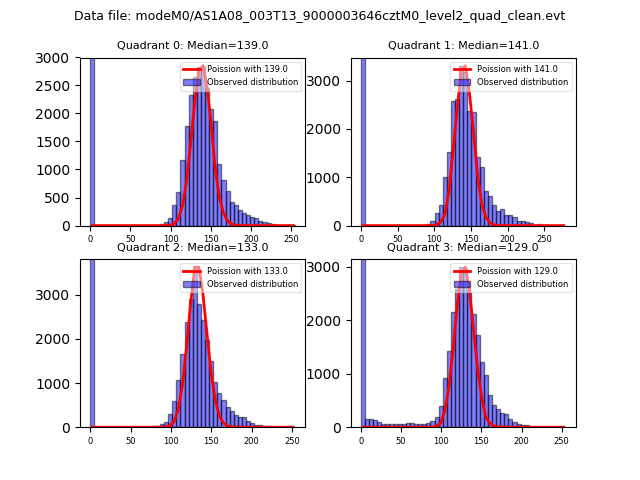 |
 |
| Quadrant-wise count rates Data is divided into 100 sec bins |
 |
|
| Module-wise count rates for Quadrant A Data is divided into 100 sec bins |
 |
 |
| Module-wise count rates for Quadrant B Data is divided into 100 sec bins |
 |
 |
| Module-wise count rates for Quadrant C Data is divided into 100 sec bins |
 |
 |
| Module-wise count rates for Quadrant D Data is divided into 100 sec bins |
 |
 |
| Parameter | Plot |
|---|---|
| CZT HV Monitor |  |
| D_VDD | 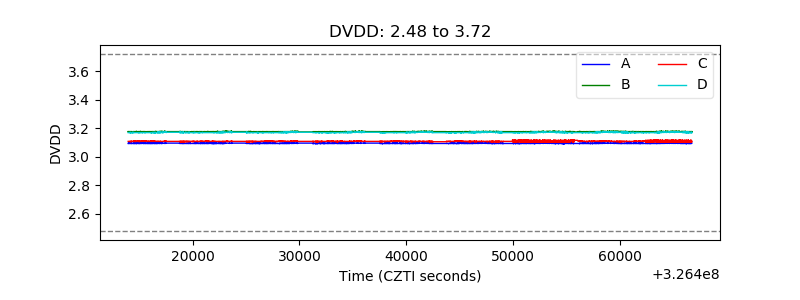 |
| Temperature 1 |  |
| Veto HV Monitor |  |
| Veto LLD |  |
| Alpha Counter |  |
| _CPM_Rate |  |
| CZT Counter |  |
| +2.5 Volts monitor |  |
| +5 Volts monitor |  |
| _ROLL_ROT |  |
| _Roll_DEC |  |
| _Roll_RA |  |
| Veto Counter |  |