| Param | Original file | Final file |
|---|---|---|
| Filename | modeM0/AS1A08_003T13_9000003646_24894cztM0_level2.evt | modeM0/AS1A08_003T13_9000003646_24894cztM0_level2_quad_clean.evt |
| Size (bytes) | 354,548,160 | 63,305,280 |
| Size | 338.1 MB | 60.4 MB |
| Events in quadrant A | 2,437,642 | 401,746 |
| Events in quadrant B | 2,483,295 | 414,528 |
| Events in quadrant C | 2,526,104 | 384,629 |
| Events in quadrant D | 2,956,770 | 371,923 |
| Mode SS | |||
|---|---|---|---|
| Quadrant | BADHDUFLAG | Total packets | Discarded packets |
| A | 0 | 102 | 0 |
| B | 0 | 102 | 0 |
| C | 0 | 102 | 0 |
| D | 0 | 102 | 0 |
| Mode M0 | |||
|---|---|---|---|
| Quadrant | BADHDUFLAG | Total packets | Discarded packets |
| A | 0 | 10313 | 1 |
| B | 0 | 10367 | 1 |
| C | 0 | 10605 | 1 |
| D | 0 | 11854 | 1 |
| Mode M9 | |||
|---|---|---|---|
| Quadrant | BADHDUFLAG | Total packets | Discarded packets |
| A | 0 | 12 | 0 |
| B | 0 | 12 | 0 |
| C | 0 | 12 | 0 |
| D | 0 | 12 | 0 |
| Quadrant | Total seconds | Saturated seconds | Saturation percentage |
|---|---|---|---|
| A | 4895 | 24 | 0.490296% |
| B | 4895 | 31 | 0.633299% |
| C | 4895 | 48 | 0.980592% |
| D | 4895 | 21 | 0.429009% |
Noise dominated data is calculated using 1-second bins in cleaned event files. If a bin has >2000 counts, and if more than 50% of those come from <1% of pixels, then it is considered to be noise-dominated and hence unusable.
| Quadrant | # 1 sec bins | Bins with >0 counts | Bins with >2000 counts | High rate bins dominated by noise | Noise dominated (total time) | Noise dominated (detector-on time) | Marked lightcurve |
|---|---|---|---|---|---|---|---|
| A | 6110 | 4896 | 0 | 0 | 0.00% | 0.00% | 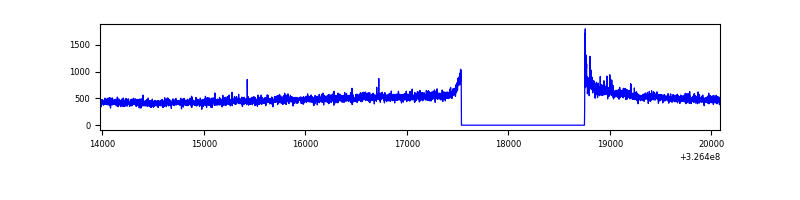 |
| B | 6110 | 4896 | 0 | 0 | 0.00% | 0.00% | 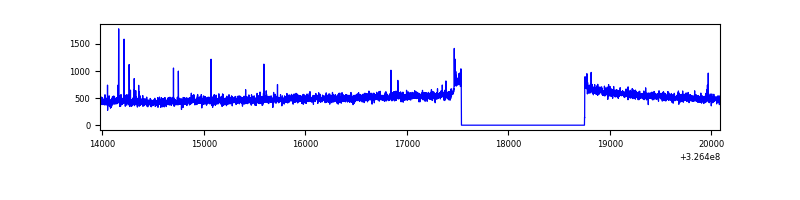 |
| C | 6110 | 4896 | 1 | 1 | 0.02% | 0.02% | 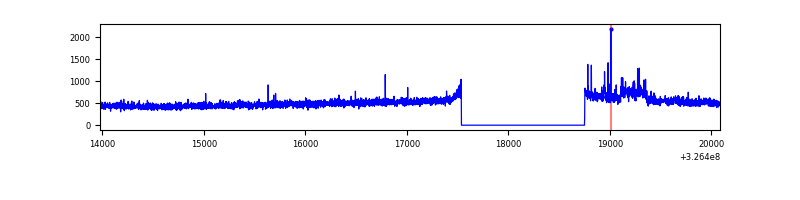 |
| D | 6110 | 4896 | 12 | 12 | 0.20% | 0.25% | 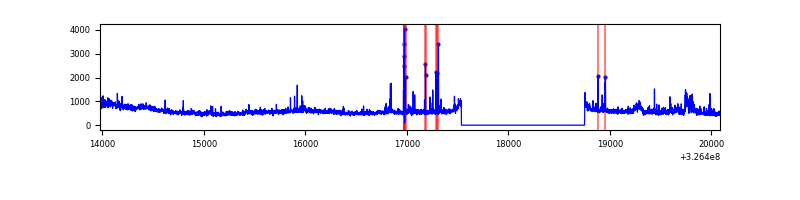 |
Top three noisy pixels from each quadrant. If the there are fewer than three noisy pixels in the level2.evt file, extra rows are filled as -1
| Pixel properties | Quadrant properties | ||||||
|---|---|---|---|---|---|---|---|
| Quadrant | DetID | PixID | Counts | Sigma | Mean | Median | Sigma |
| A | 4 | 2 | 35061 | 272.25 | 623 | 610 | 126.5 |
| A | 13 | 254 | 7791 | 56.75 | 623 | 610 | 126.5 |
| A | 3 | 137 | 5762 | 40.71 | 623 | 610 | 126.5 |
| B | 12 | 111 | 14282 | 114.54 | 622 | 606 | 119.4 |
| B | 11 | 111 | 13021 | 103.98 | 622 | 606 | 119.4 |
| B | 4 | 80 | 12526 | 99.83 | 622 | 606 | 119.4 |
| C | 14 | 238 | 95382 | 672.15 | 597 | 603 | 141.0 |
| C | 7 | 247 | 79656 | 560.63 | 597 | 603 | 141.0 |
| C | 2 | 16 | 12768 | 86.27 | 597 | 603 | 141.0 |
| D | 7 | 238 | 453866 | 3128.95 | 596 | 580 | 144.9 |
| D | 1 | 52 | 100043 | 686.58 | 596 | 580 | 144.9 |
| D | 8 | 195 | 97354 | 668.01 | 596 | 580 | 144.9 |
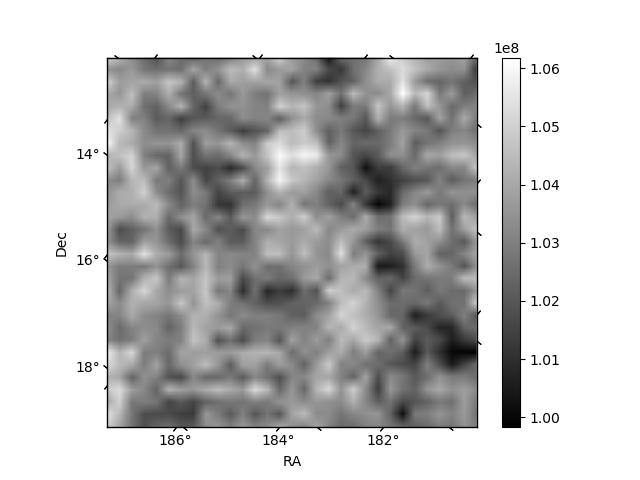
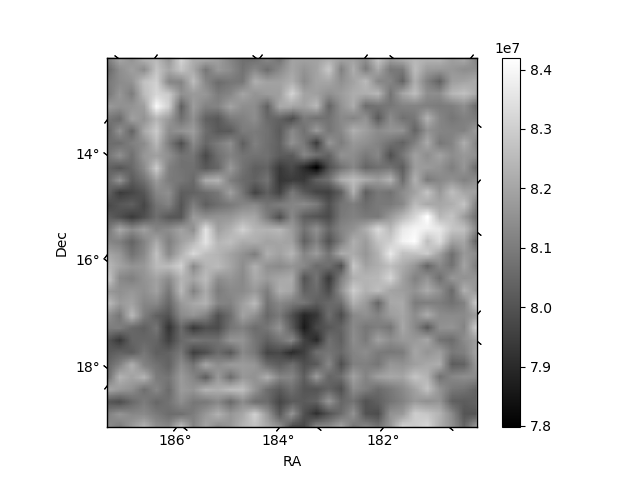
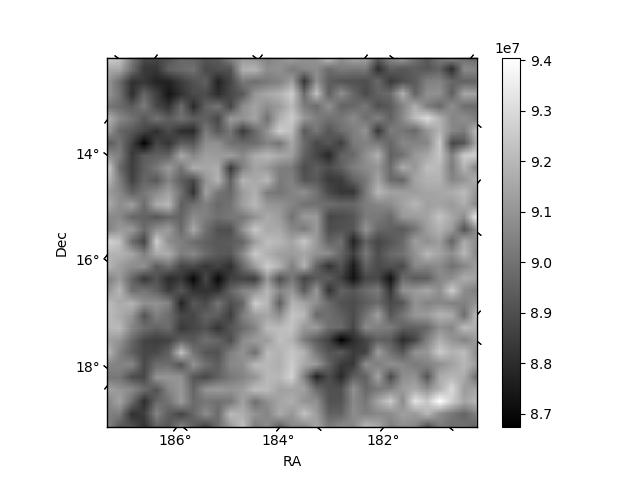
Histogram calculated using DETX and DETY for each event in the final _common_clean file
| Quadrant A | 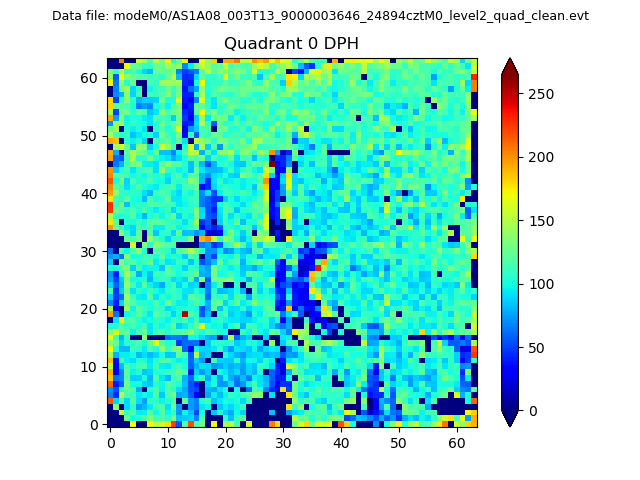 |
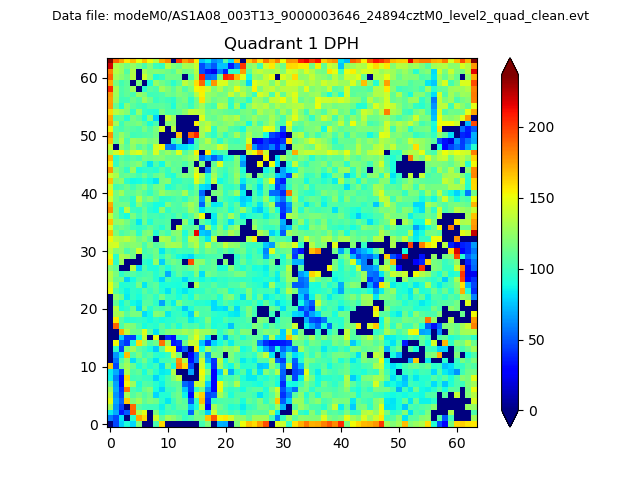 |
Quadrant B |
|---|---|---|---|
| Quadrant D | 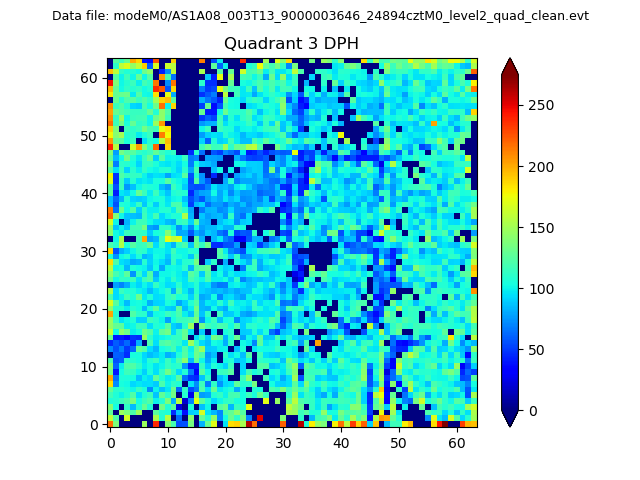 |
 |
Quadrant C |
| Plot type | Count rate plots | Images |
|---|---|---|
| Comparison with Poisson distribution Blue bars denote a histogram of data divided into 1 sec bins. Red curve is a Poisson curve with rate = median count rate of data. |
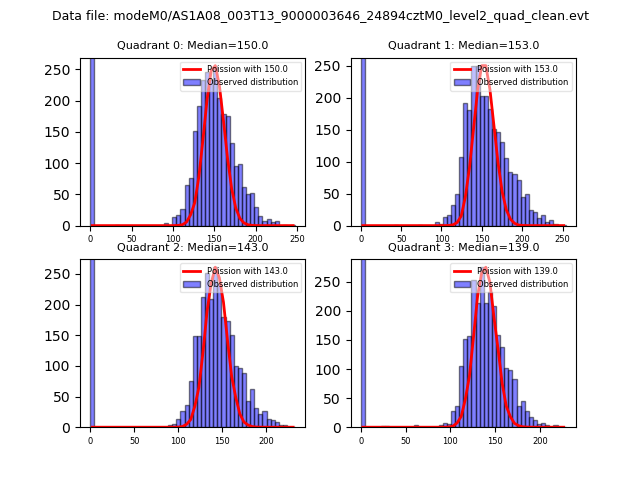 |
 |
| Quadrant-wise count rates Data is divided into 100 sec bins |
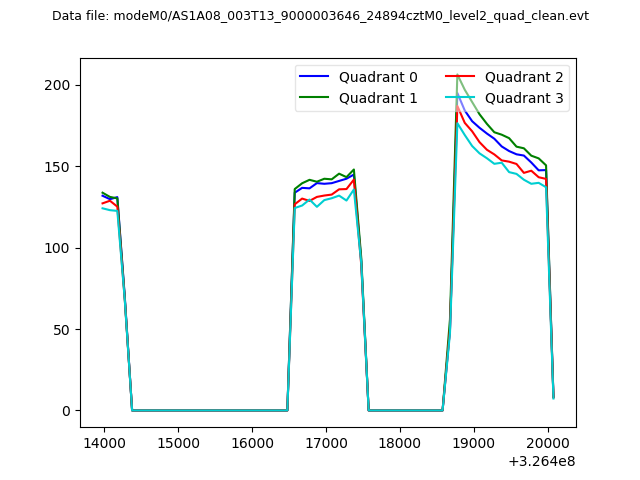 |
|
| Module-wise count rates for Quadrant A Data is divided into 100 sec bins |
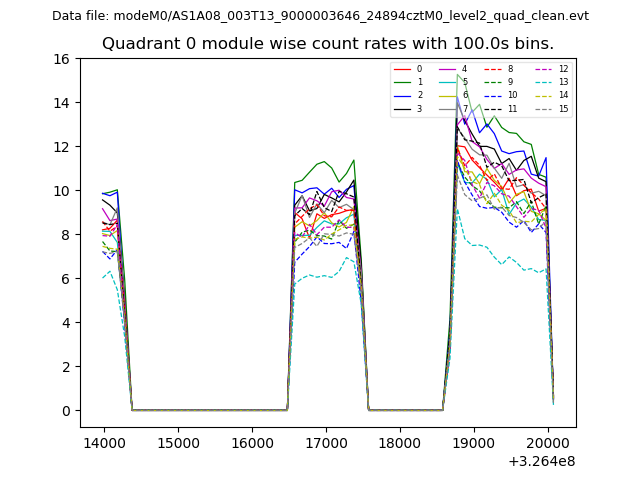 |
 |
| Module-wise count rates for Quadrant B Data is divided into 100 sec bins |
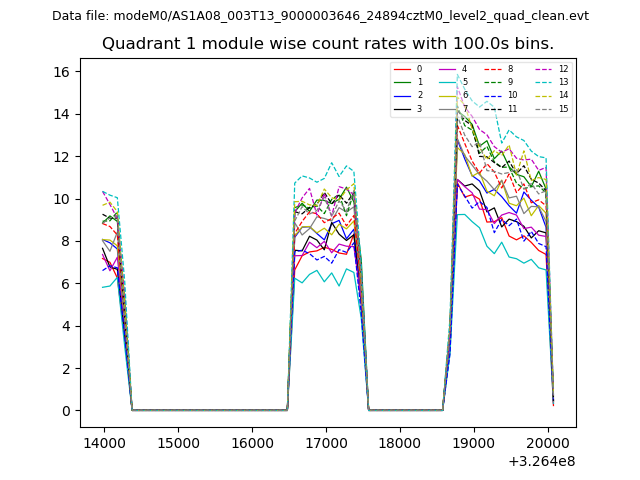 |
 |
| Module-wise count rates for Quadrant C Data is divided into 100 sec bins |
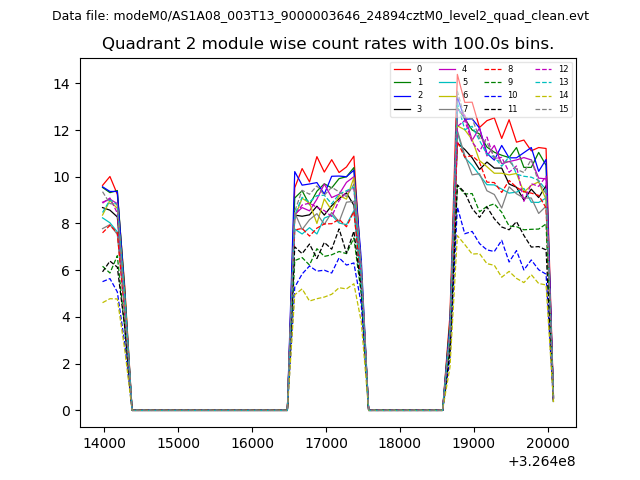 |
 |
| Module-wise count rates for Quadrant D Data is divided into 100 sec bins |
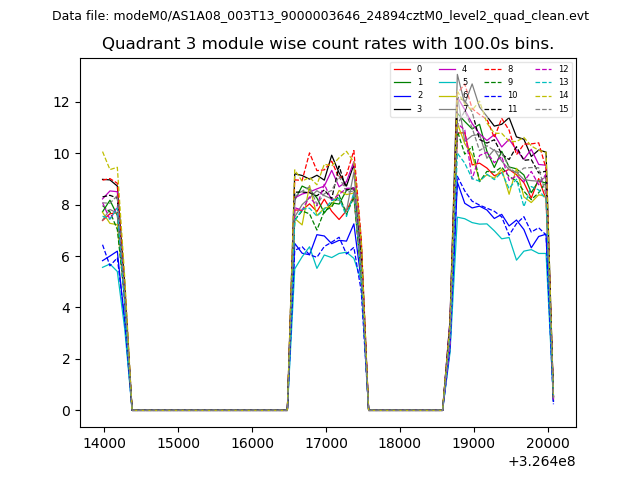 |
 |
| Parameter | Plot |
|---|---|
| CZT HV Monitor | 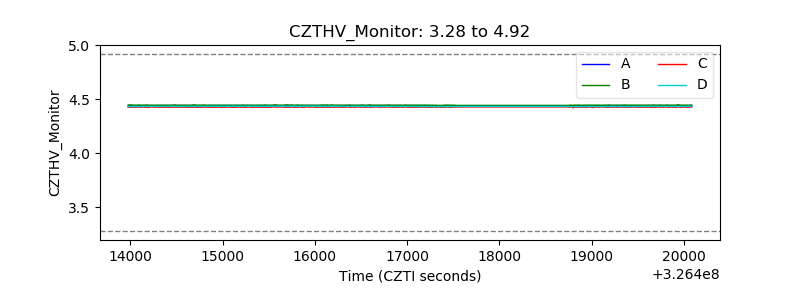 |
| D_VDD | 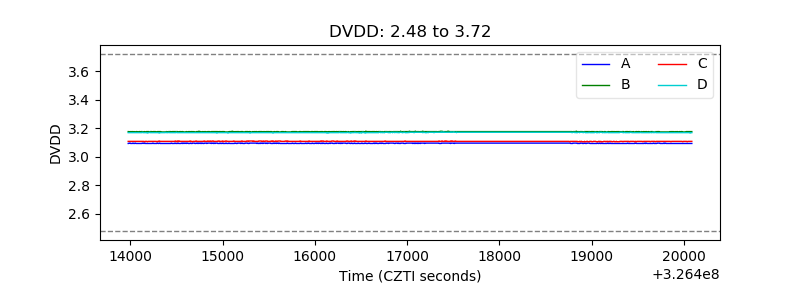 |
| Temperature 1 | 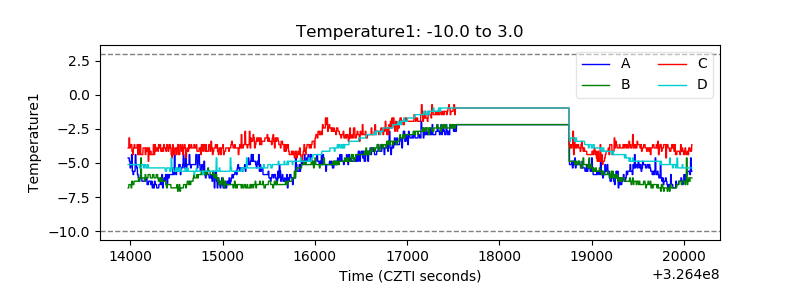 |
| Veto HV Monitor | 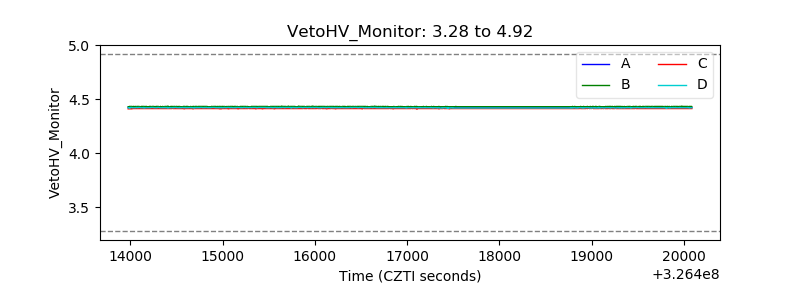 |
| Veto LLD | 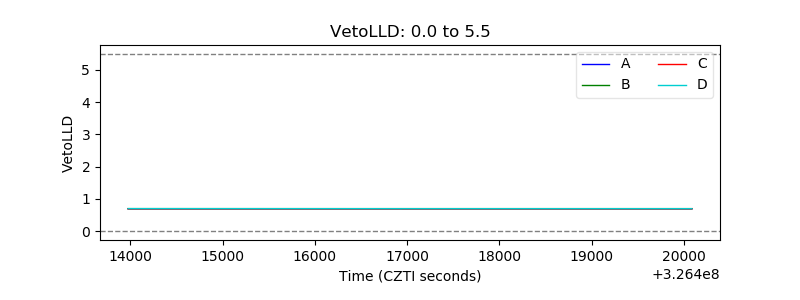 |
| Alpha Counter | 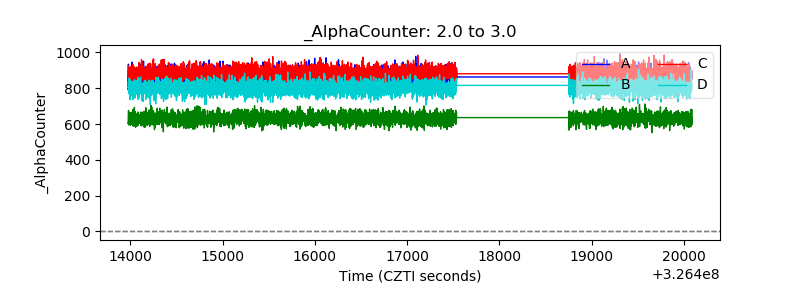 |
| _CPM_Rate | 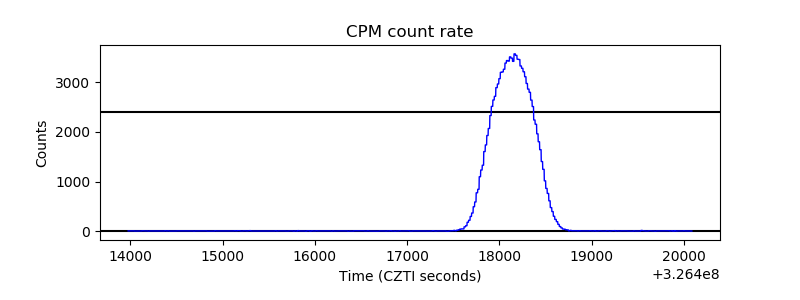 |
| CZT Counter |  |
| +2.5 Volts monitor |  |
| +5 Volts monitor |  |
| _ROLL_ROT | 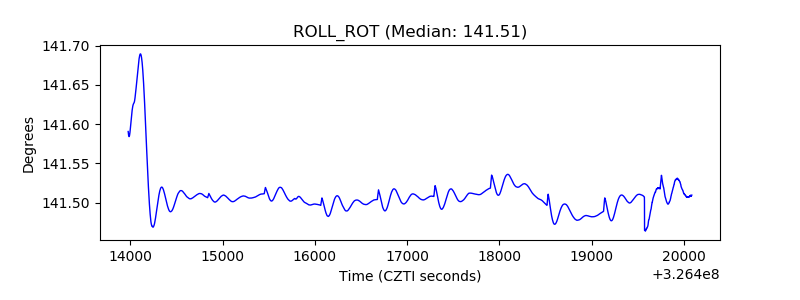 |
| _Roll_DEC | 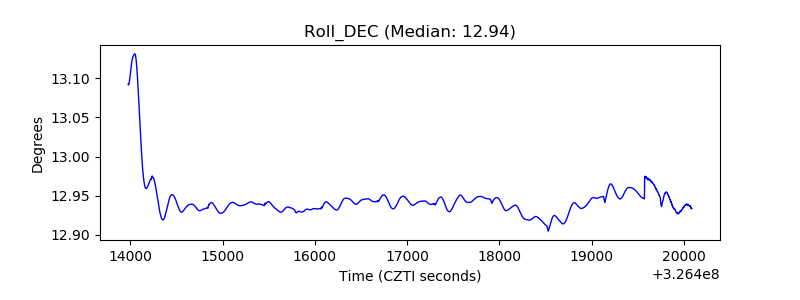 |
| _Roll_RA |  |
| Veto Counter | 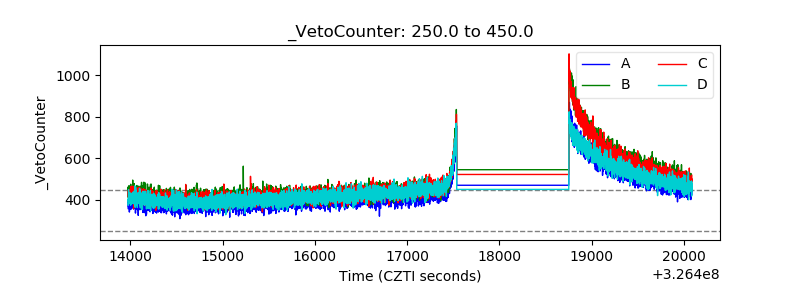 |