| Param | Original file | Final file |
|---|---|---|
| Filename | modeM0/AS1A08_003T13_9000003646_24895cztM0_level2.evt | modeM0/AS1A08_003T13_9000003646_24895cztM0_level2_quad_clean.evt |
| Size (bytes) | 489,591,360 | 91,621,440 |
| Size | 466.9 MB | 87.4 MB |
| Events in quadrant A | 3,232,852 | 601,549 |
| Events in quadrant B | 3,292,415 | 621,756 |
| Events in quadrant C | 3,566,726 | 575,725 |
| Events in quadrant D | 4,314,654 | 542,596 |
| Mode SS | |||
|---|---|---|---|
| Quadrant | BADHDUFLAG | Total packets | Discarded packets |
| A | 0 | 126 | 0 |
| B | 0 | 126 | 0 |
| C | 0 | 126 | 0 |
| D | 0 | 126 | 0 |
| Mode M0 | |||
|---|---|---|---|
| Quadrant | BADHDUFLAG | Total packets | Discarded packets |
| A | 0 | 13287 | 2 |
| B | 0 | 13469 | 2 |
| C | 0 | 14330 | 2 |
| D | 0 | 17017 | 4 |
| Mode M9 | |||
|---|---|---|---|
| Quadrant | BADHDUFLAG | Total packets | Discarded packets |
| A | 0 | 21 | 0 |
| B | 0 | 22 | 0 |
| C | 0 | 22 | 0 |
| D | 0 | 22 | 0 |
| Quadrant | Total seconds | Saturated seconds | Saturation percentage |
|---|---|---|---|
| A | 6205 | 22 | 0.354553% |
| B | 6205 | 33 | 0.531829% |
| C | 6205 | 100 | 1.611604% |
| D | 6204 | 109 | 1.756931% |
Noise dominated data is calculated using 1-second bins in cleaned event files. If a bin has >2000 counts, and if more than 50% of those come from <1% of pixels, then it is considered to be noise-dominated and hence unusable.
| Quadrant | # 1 sec bins | Bins with >0 counts | Bins with >2000 counts | High rate bins dominated by noise | Noise dominated (total time) | Noise dominated (detector-on time) | Marked lightcurve |
|---|---|---|---|---|---|---|---|
| A | 7515 | 6206 | 0 | 0 | 0.00% | 0.00% | 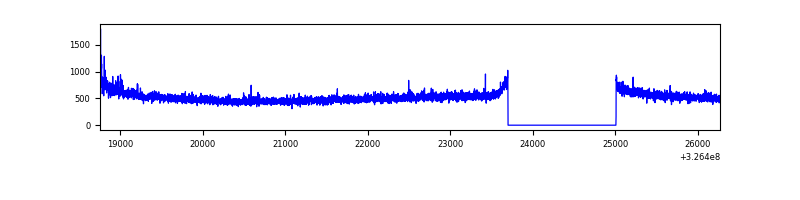 |
| B | 7515 | 6206 | 0 | 0 | 0.00% | 0.00% | 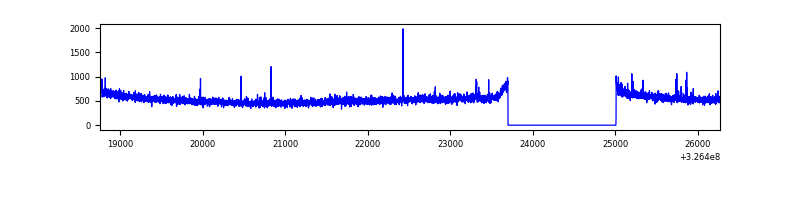 |
| C | 7515 | 6206 | 36 | 36 | 0.48% | 0.58% | 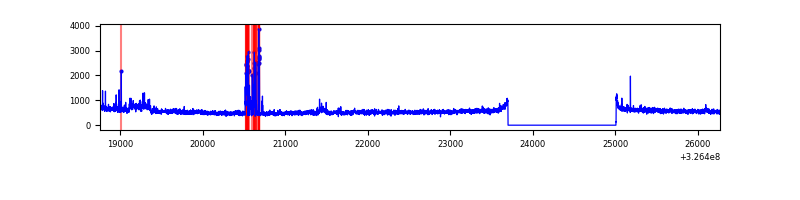 |
| D | 7514 | 6205 | 70 | 70 | 0.93% | 1.13% | 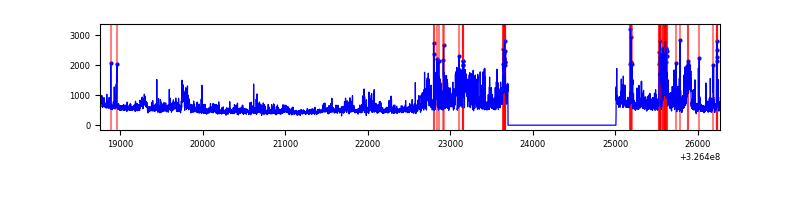 |
Top three noisy pixels from each quadrant. If the there are fewer than three noisy pixels in the level2.evt file, extra rows are filled as -1
| Pixel properties | Quadrant properties | ||||||
|---|---|---|---|---|---|---|---|
| Quadrant | DetID | PixID | Counts | Sigma | Mean | Median | Sigma |
| A | 4 | 2 | 34842 | 206.3 | 829 | 815 | 164.9 |
| A | 13 | 254 | 9750 | 54.17 | 829 | 815 | 164.9 |
| A | 3 | 137 | 7141 | 38.35 | 829 | 815 | 164.9 |
| B | 12 | 111 | 18604 | 112.57 | 832 | 811 | 158.1 |
| B | 11 | 111 | 16603 | 99.91 | 832 | 811 | 158.1 |
| B | 14 | 111 | 15654 | 93.91 | 832 | 811 | 158.1 |
| C | 7 | 247 | 171941 | 932.97 | 791 | 797 | 183.4 |
| C | 5 | 112 | 161702 | 877.15 | 791 | 797 | 183.4 |
| C | 14 | 238 | 129494 | 701.58 | 791 | 797 | 183.4 |
| D | 1 | 52 | 913610 | 4796.64 | 786 | 766 | 190.3 |
| D | 8 | 195 | 299093 | 1567.59 | 786 | 766 | 190.3 |
| D | 7 | 238 | 73794 | 383.73 | 786 | 766 | 190.3 |
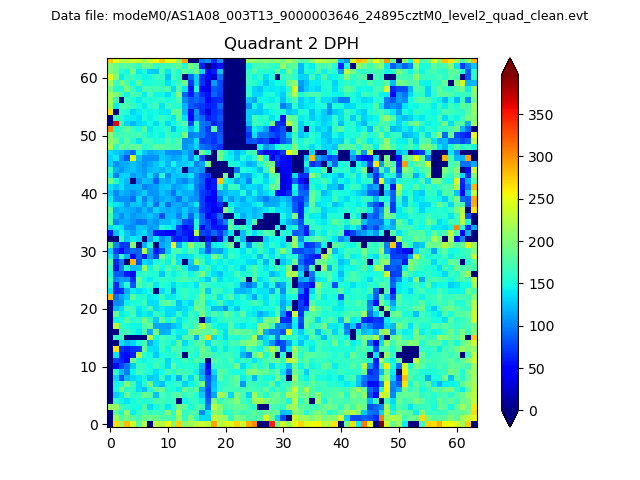
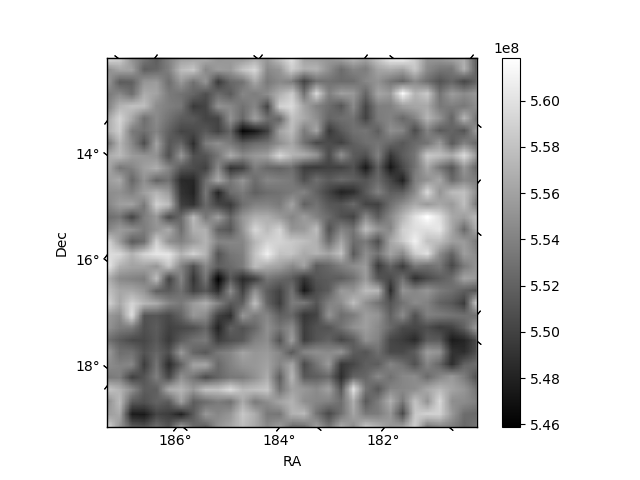
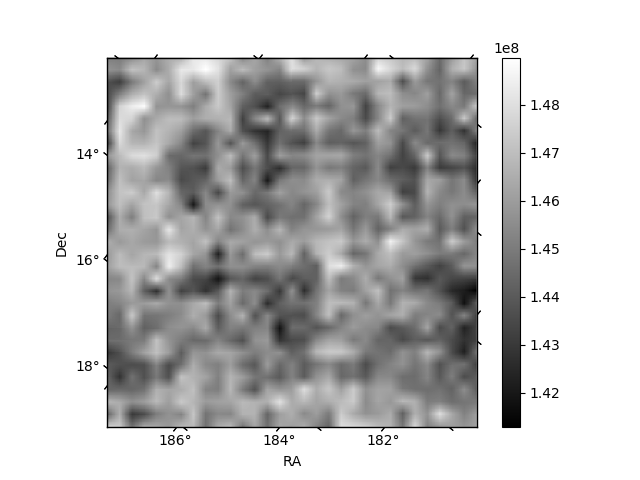
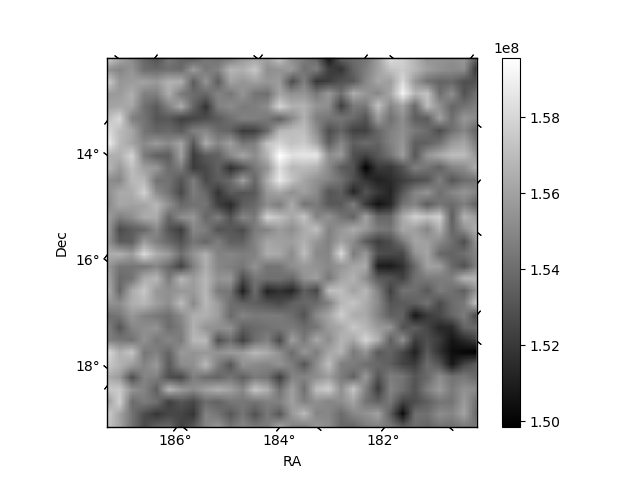
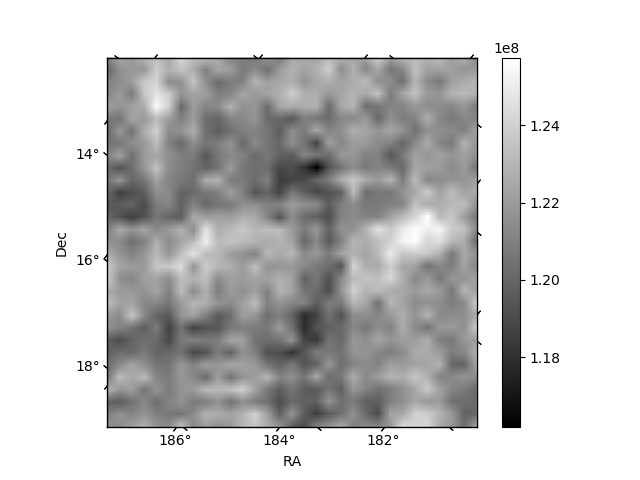
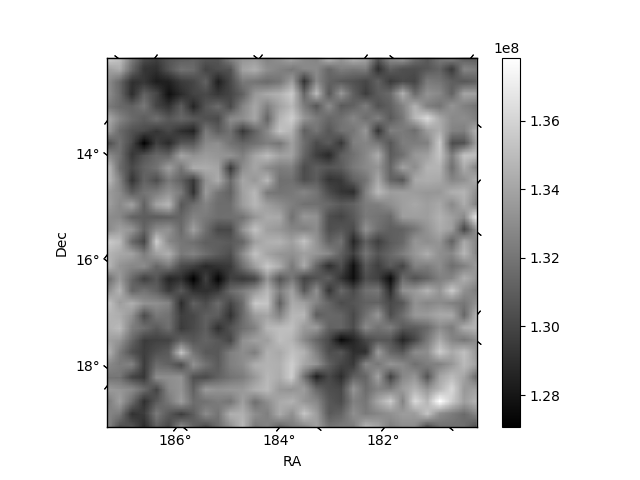
Histogram calculated using DETX and DETY for each event in the final _common_clean file
| Quadrant A | 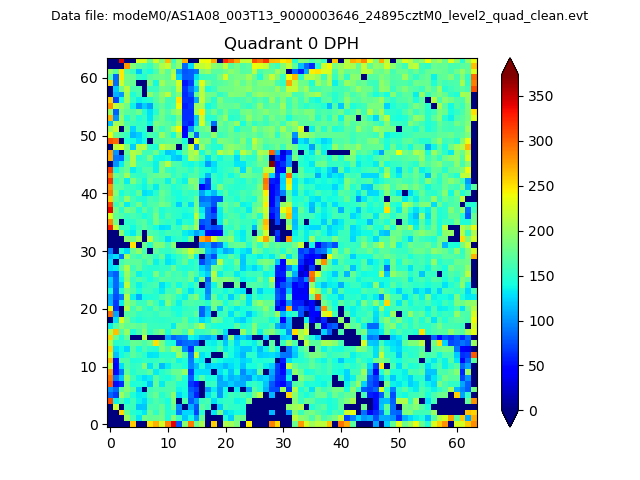 |
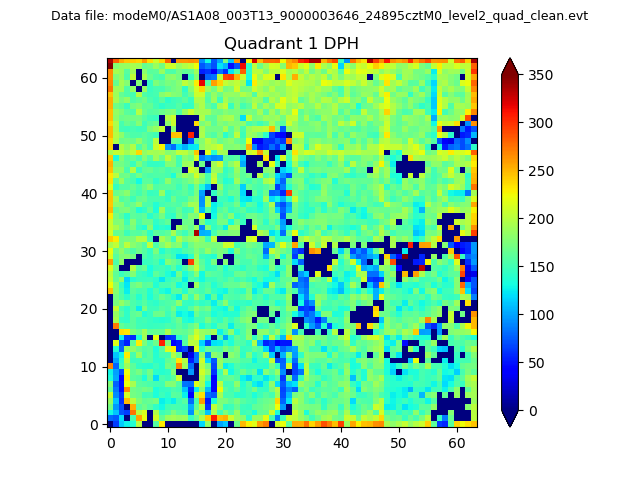 |
Quadrant B |
|---|---|---|---|
| Quadrant D | 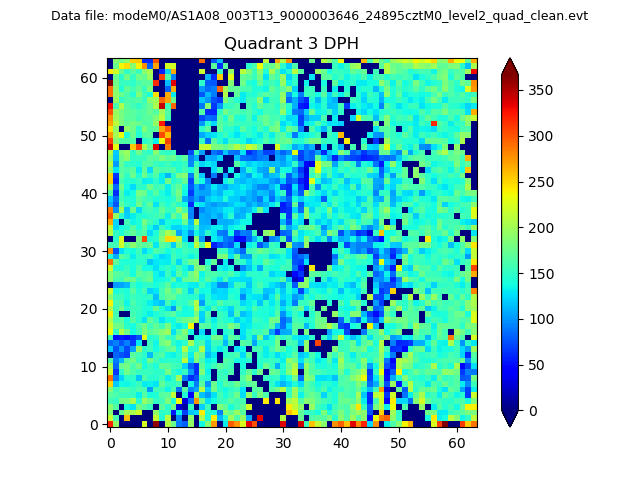 |
 |
Quadrant C |
| Plot type | Count rate plots | Images |
|---|---|---|
| Comparison with Poisson distribution Blue bars denote a histogram of data divided into 1 sec bins. Red curve is a Poisson curve with rate = median count rate of data. |
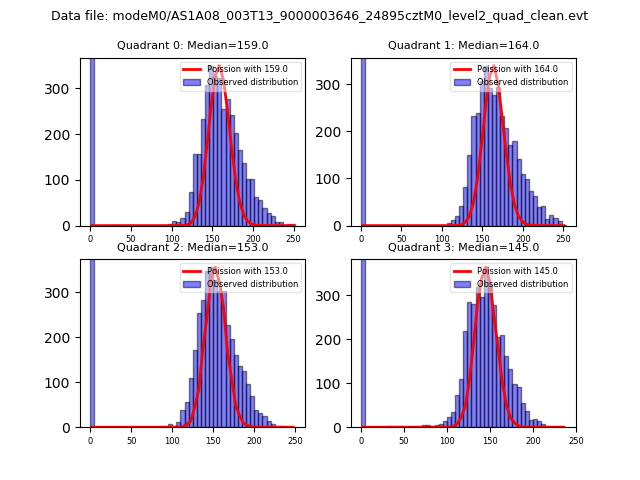 |
 |
| Quadrant-wise count rates Data is divided into 100 sec bins |
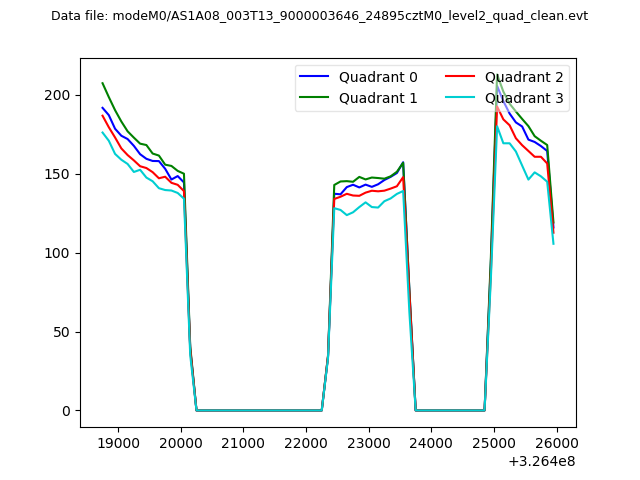 |
|
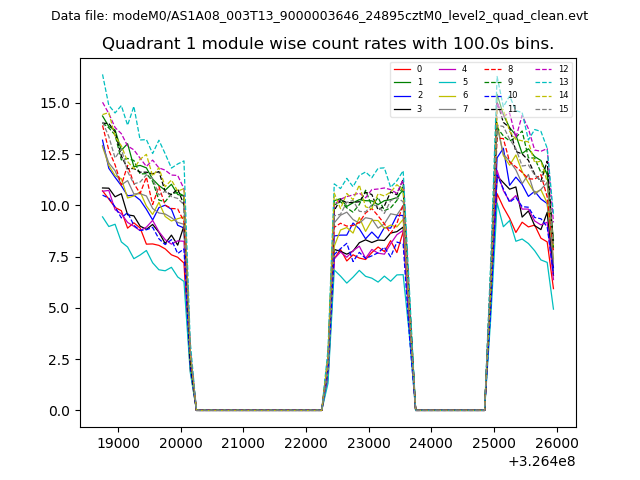
| Module-wise count rates for Quadrant A Data is divided into 100 sec bins |
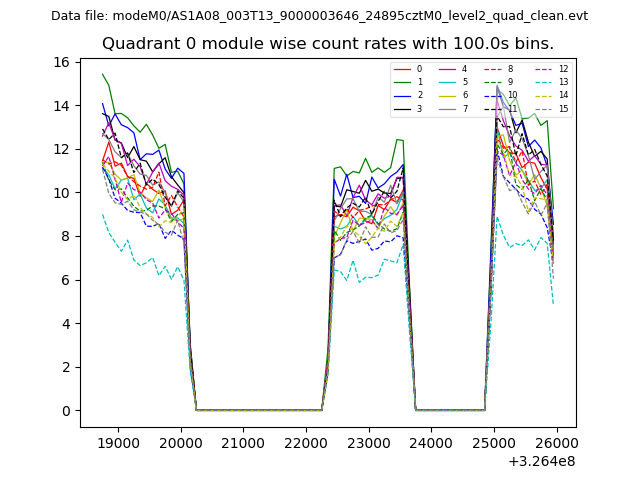 |
 |
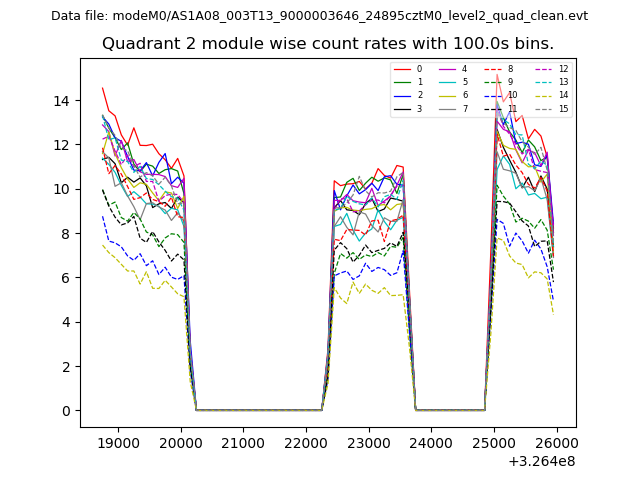
| Module-wise count rates for Quadrant B Data is divided into 100 sec bins |
 |
 |
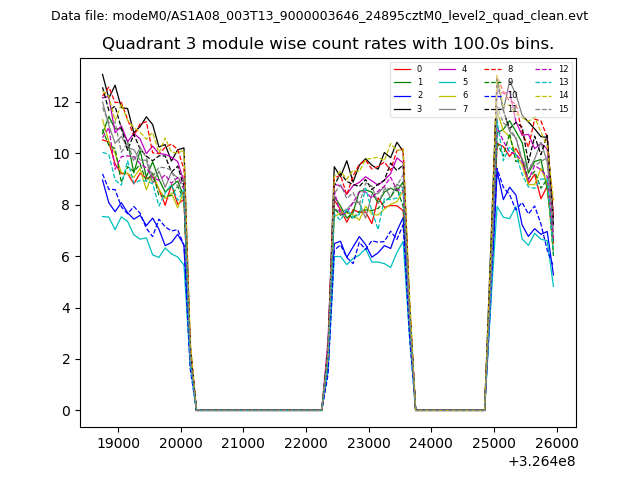
| Module-wise count rates for Quadrant C Data is divided into 100 sec bins |
 |
 |
| Module-wise count rates for Quadrant D Data is divided into 100 sec bins |
 |
 |
| Parameter | Plot |
|---|---|
| CZT HV Monitor | 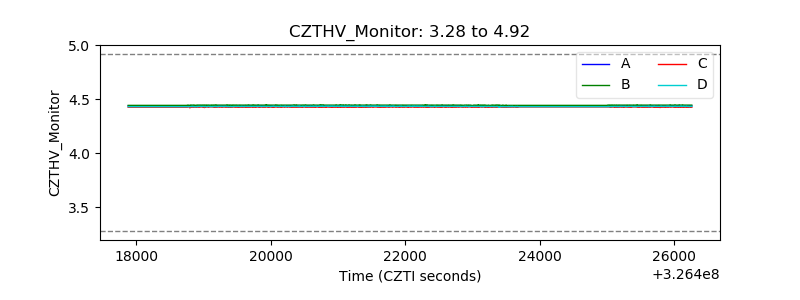 |
| D_VDD |  |
| Temperature 1 | 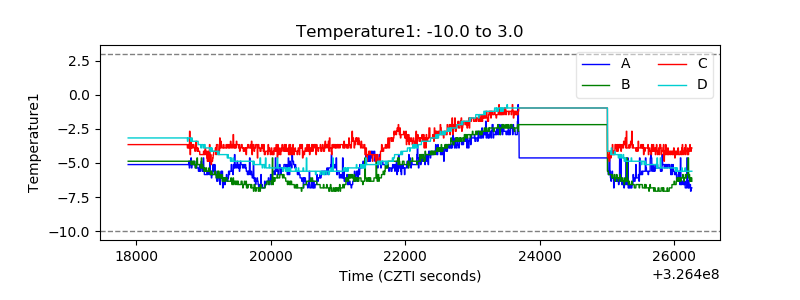 |
| Veto HV Monitor | 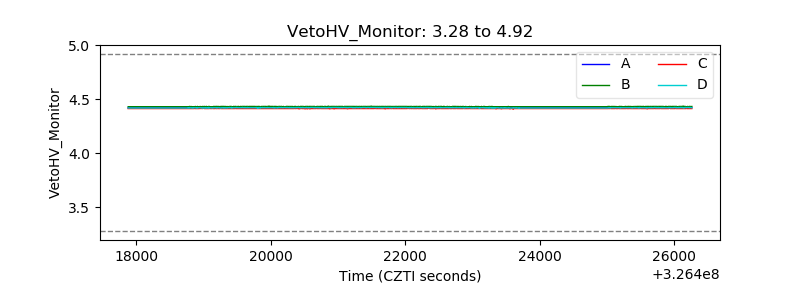 |
| Veto LLD | 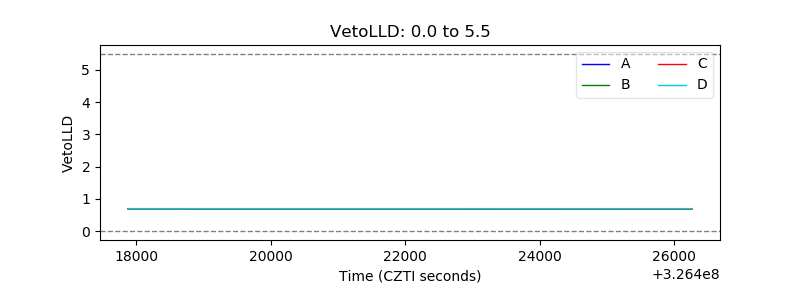 |
| Alpha Counter | 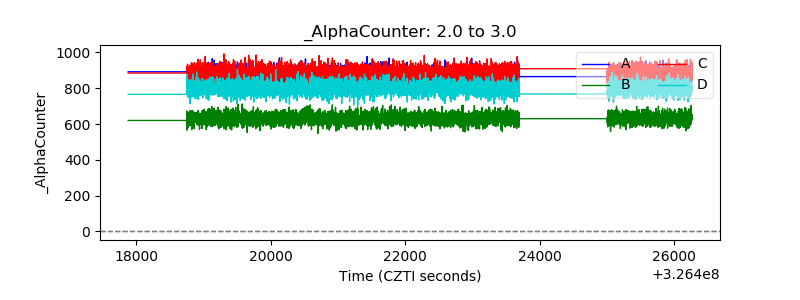 |
| _CPM_Rate | 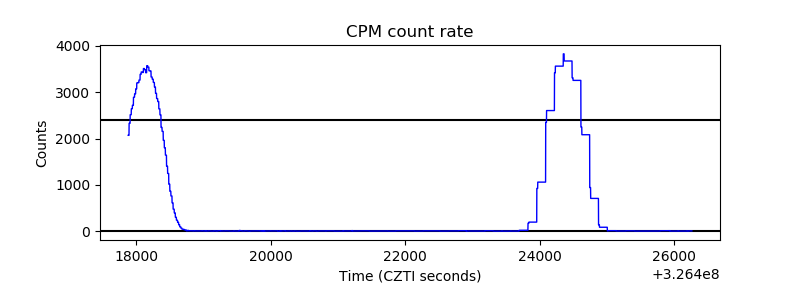 |
| CZT Counter | 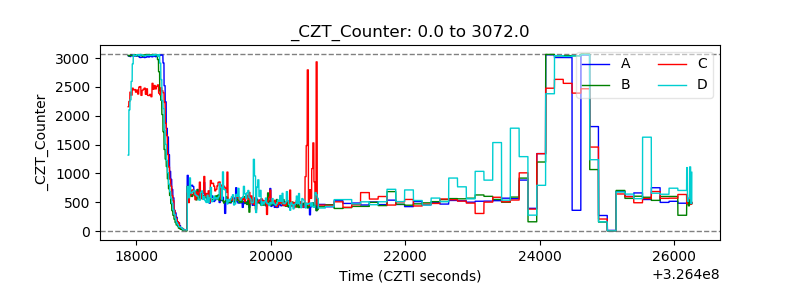 |
| +2.5 Volts monitor |  |
| +5 Volts monitor |  |
| _ROLL_ROT | 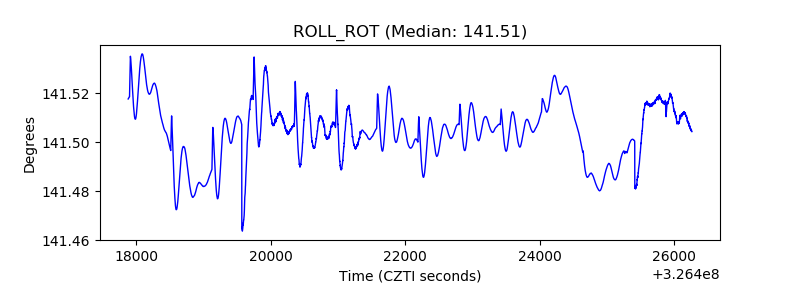 |
| _Roll_DEC | 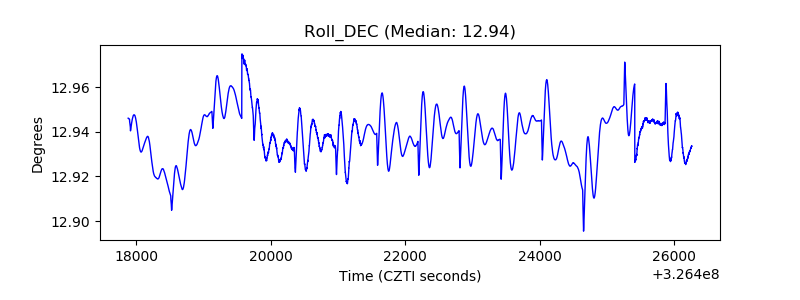 |
| _Roll_RA | 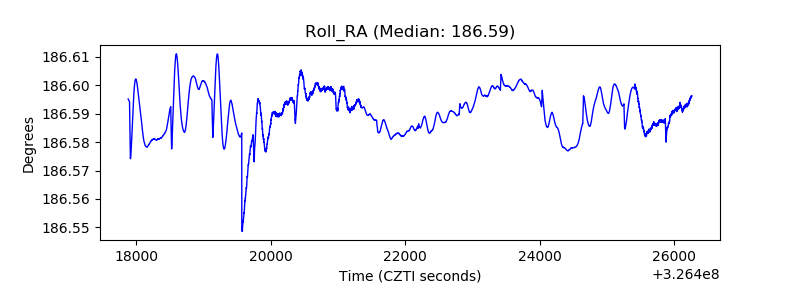 |
| Veto Counter | 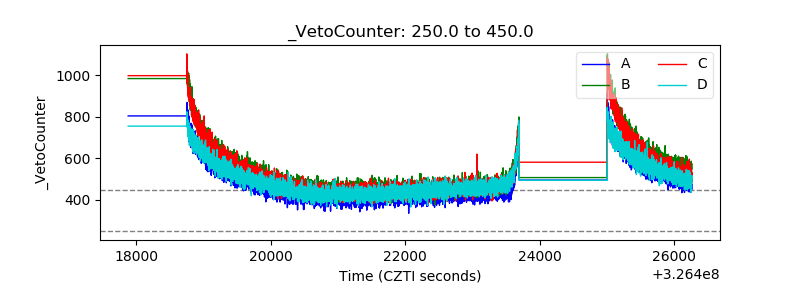 |