| Param | Original file | Final file |
|---|---|---|
| Filename | modeM0/AS1A08_003T13_9000003646_24896cztM0_level2.evt | modeM0/AS1A08_003T13_9000003646_24896cztM0_level2_quad_clean.evt |
| Size (bytes) | 474,192,000 | 82,503,360 |
| Size | 452.2 MB | 78.7 MB |
| Events in quadrant A | 3,248,465 | 533,644 |
| Events in quadrant B | 3,335,823 | 549,326 |
| Events in quadrant C | 3,498,479 | 502,263 |
| Events in quadrant D | 3,862,562 | 485,362 |
| Mode SS | |||
|---|---|---|---|
| Quadrant | BADHDUFLAG | Total packets | Discarded packets |
| A | 0 | 124 | 0 |
| B | 0 | 124 | 0 |
| C | 0 | 124 | 0 |
| D | 0 | 124 | 0 |
| Mode M0 | |||
|---|---|---|---|
| Quadrant | BADHDUFLAG | Total packets | Discarded packets |
| A | 0 | 13165 | 2 |
| B | 0 | 13478 | 2 |
| C | 0 | 13991 | 2 |
| D | 0 | 15340 | 2 |
| Mode M9 | |||
|---|---|---|---|
| Quadrant | BADHDUFLAG | Total packets | Discarded packets |
| A | 0 | 14 | 0 |
| B | 0 | 14 | 0 |
| C | 0 | 14 | 0 |
| D | 0 | 14 | 0 |
| Quadrant | Total seconds | Saturated seconds | Saturation percentage |
|---|---|---|---|
| A | 6128 | 23 | 0.375326% |
| B | 6128 | 34 | 0.554830% |
| C | 6128 | 124 | 2.023499% |
| D | 6128 | 48 | 0.783290% |
Noise dominated data is calculated using 1-second bins in cleaned event files. If a bin has >2000 counts, and if more than 50% of those come from <1% of pixels, then it is considered to be noise-dominated and hence unusable.
| Quadrant | # 1 sec bins | Bins with >0 counts | Bins with >2000 counts | High rate bins dominated by noise | Noise dominated (total time) | Noise dominated (detector-on time) | Marked lightcurve |
|---|---|---|---|---|---|---|---|
| A | 7488 | 6129 | 0 | 0 | 0.00% | 0.00% |  |
| B | 7488 | 6129 | 0 | 0 | 0.00% | 0.00% |  |
| C | 7488 | 6129 | 36 | 36 | 0.48% | 0.59% |  |
| D | 7488 | 6129 | 55 | 55 | 0.73% | 0.90% |  |
Top three noisy pixels from each quadrant. If the there are fewer than three noisy pixels in the level2.evt file, extra rows are filled as -1
| Pixel properties | Quadrant properties | ||||||
|---|---|---|---|---|---|---|---|
| Quadrant | DetID | PixID | Counts | Sigma | Mean | Median | Sigma |
| A | 13 | 254 | 9827 | 53.76 | 842 | 828 | 167.4 |
| A | 0 | 226 | 7289 | 38.6 | 842 | 828 | 167.4 |
| A | 3 | 137 | 7120 | 37.59 | 842 | 828 | 167.4 |
| B | 12 | 111 | 18730 | 112.41 | 844 | 825 | 159.3 |
| B | 11 | 111 | 16744 | 99.94 | 844 | 825 | 159.3 |
| B | 14 | 111 | 16151 | 96.22 | 844 | 825 | 159.3 |
| C | 14 | 238 | 131117 | 703.46 | 796 | 803 | 185.2 |
| C | 5 | 112 | 124968 | 670.26 | 796 | 803 | 185.2 |
| C | 7 | 247 | 80827 | 431.98 | 796 | 803 | 185.2 |
| D | 1 | 52 | 490265 | 2511.69 | 798 | 774 | 194.9 |
| D | 8 | 195 | 292225 | 1495.5 | 798 | 774 | 194.9 |
| D | 7 | 238 | 43922 | 221.4 | 798 | 774 | 194.9 |
Histogram calculated using DETX and DETY for each event in the final _common_clean file
| Quadrant A |  |
 |
Quadrant B |
|---|---|---|---|
| Quadrant D |  |
 |
Quadrant C |
| Plot type | Count rate plots | Images |
|---|---|---|
| Comparison with Poisson distribution Blue bars denote a histogram of data divided into 1 sec bins. Red curve is a Poisson curve with rate = median count rate of data. |
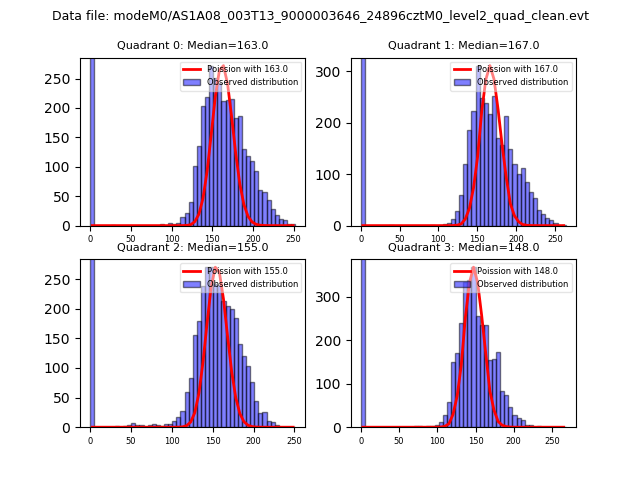 |
 |
| Quadrant-wise count rates Data is divided into 100 sec bins |
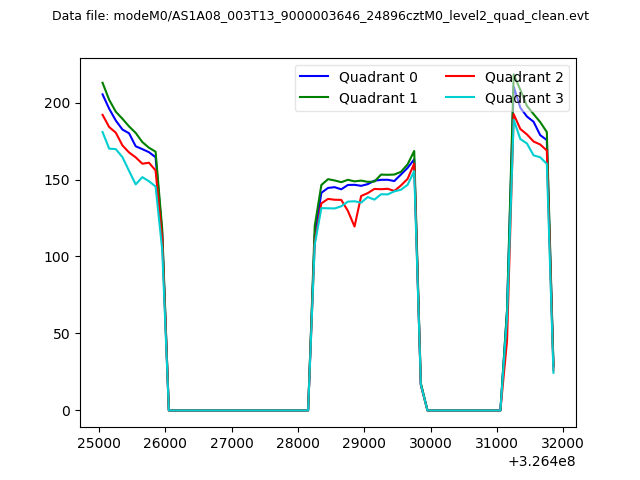 |
|
| Module-wise count rates for Quadrant A Data is divided into 100 sec bins |
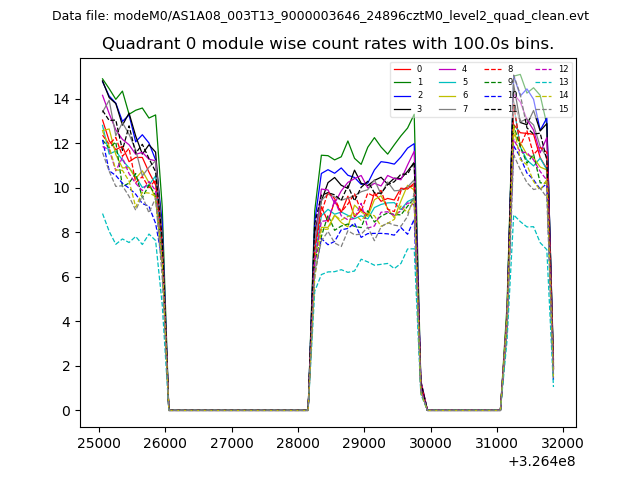 |
 |
| Module-wise count rates for Quadrant B Data is divided into 100 sec bins |
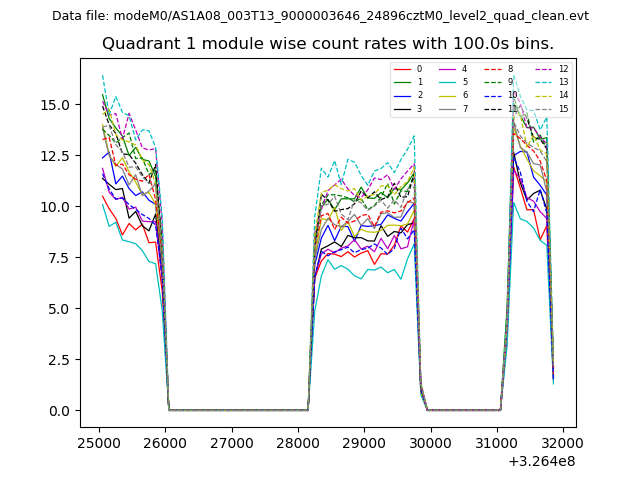 |
 |
| Module-wise count rates for Quadrant C Data is divided into 100 sec bins |
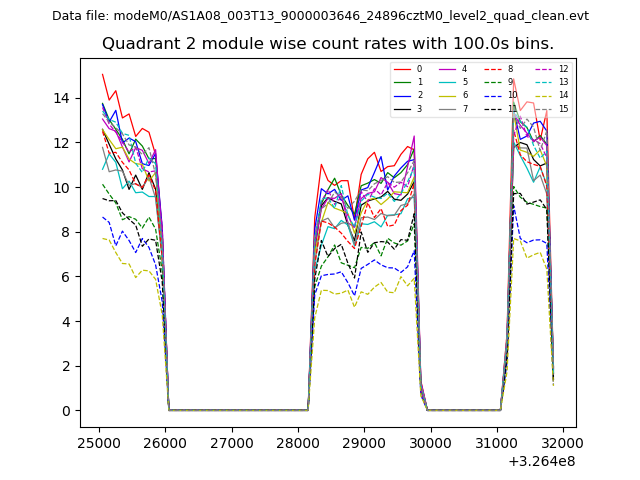 |
 |
| Module-wise count rates for Quadrant D Data is divided into 100 sec bins |
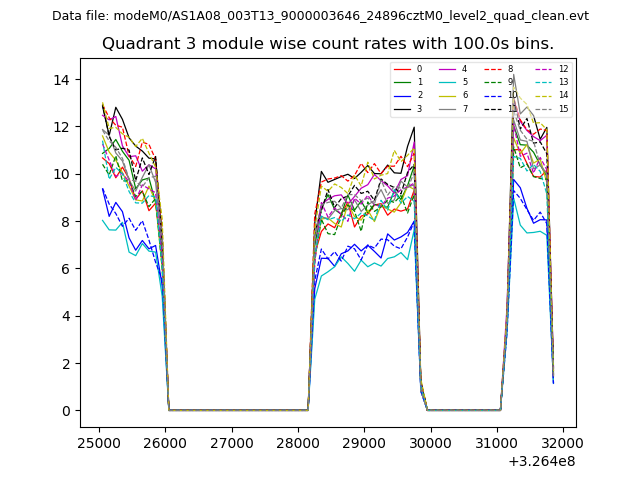 |
 |
| Parameter | Plot |
|---|---|
| CZT HV Monitor | 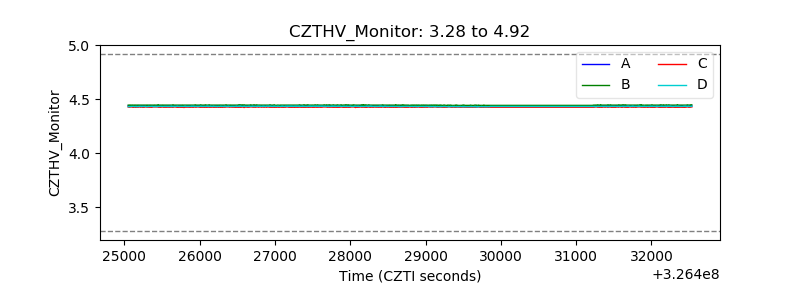 |
| D_VDD |  |
| Temperature 1 |  |
| Veto HV Monitor |  |
| Veto LLD |  |
| Alpha Counter | 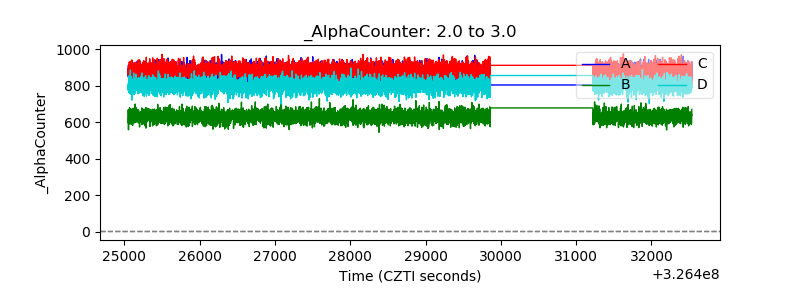 |
| _CPM_Rate | 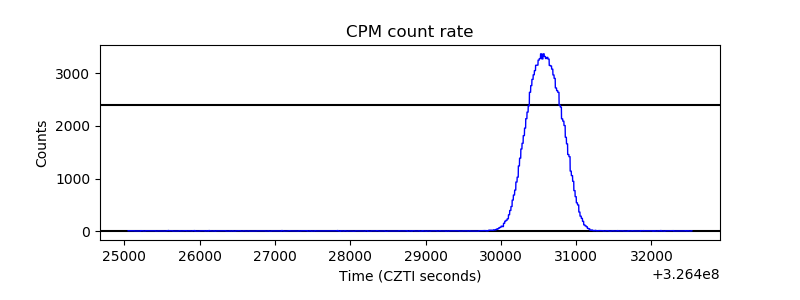 |
| CZT Counter |  |
| +2.5 Volts monitor |  |
| +5 Volts monitor |  |
| _ROLL_ROT | 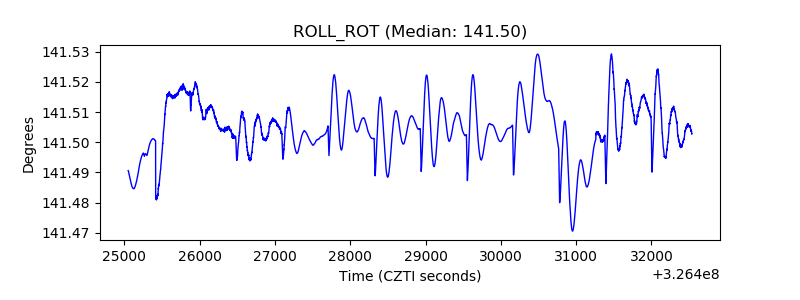 |
| _Roll_DEC | 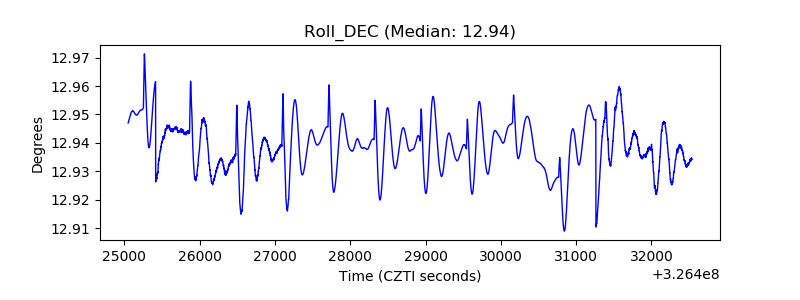 |
| _Roll_RA |  |
| Veto Counter | 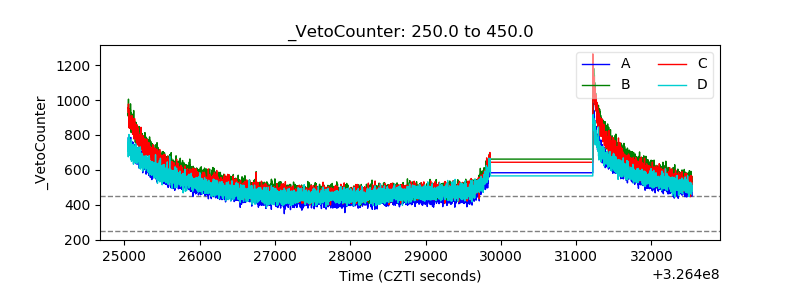 |