| Param | Original file | Final file |
|---|---|---|
| Filename | modeM0/AS1A08_003T13_9000003646_24897cztM0_level2.evt | modeM0/AS1A08_003T13_9000003646_24897cztM0_level2_quad_clean.evt |
| Size (bytes) | 461,468,160 | 73,903,680 |
| Size | 440.1 MB | 70.5 MB |
| Events in quadrant A | 3,257,735 | 466,615 |
| Events in quadrant B | 3,317,034 | 480,727 |
| Events in quadrant C | 3,372,465 | 440,971 |
| Events in quadrant D | 3,617,634 | 426,863 |
| Mode SS | |||
|---|---|---|---|
| Quadrant | BADHDUFLAG | Total packets | Discarded packets |
| A | 0 | 122 | 0 |
| B | 0 | 122 | 0 |
| C | 0 | 122 | 0 |
| D | 0 | 122 | 0 |
| Mode M0 | |||
|---|---|---|---|
| Quadrant | BADHDUFLAG | Total packets | Discarded packets |
| A | 0 | 13024 | 2 |
| B | 0 | 13222 | 2 |
| C | 0 | 13426 | 2 |
| D | 0 | 14543 | 2 |
| Mode M9 | |||
|---|---|---|---|
| Quadrant | BADHDUFLAG | Total packets | Discarded packets |
| A | 0 | 16 | 0 |
| B | 0 | 17 | 0 |
| C | 0 | 17 | 0 |
| D | 0 | 17 | 0 |
| Quadrant | Total seconds | Saturated seconds | Saturation percentage |
|---|---|---|---|
| A | 6055 | 59 | 0.974401% |
| B | 6055 | 74 | 1.222130% |
| C | 6055 | 100 | 1.651528% |
| D | 6055 | 75 | 1.238646% |
Noise dominated data is calculated using 1-second bins in cleaned event files. If a bin has >2000 counts, and if more than 50% of those come from <1% of pixels, then it is considered to be noise-dominated and hence unusable.
| Quadrant | # 1 sec bins | Bins with >0 counts | Bins with >2000 counts | High rate bins dominated by noise | Noise dominated (total time) | Noise dominated (detector-on time) | Marked lightcurve |
|---|---|---|---|---|---|---|---|
| A | 7415 | 6056 | 0 | 0 | 0.00% | 0.00% | 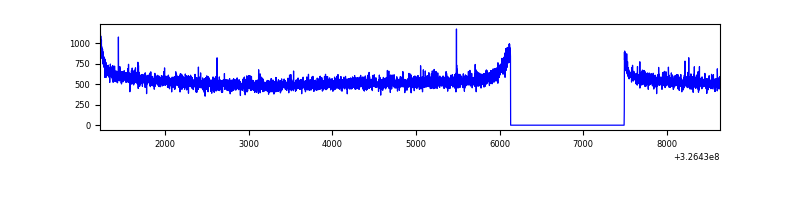 |
| B | 7415 | 6056 | 0 | 0 | 0.00% | 0.00% |  |
| C | 7415 | 6056 | 12 | 12 | 0.16% | 0.20% | 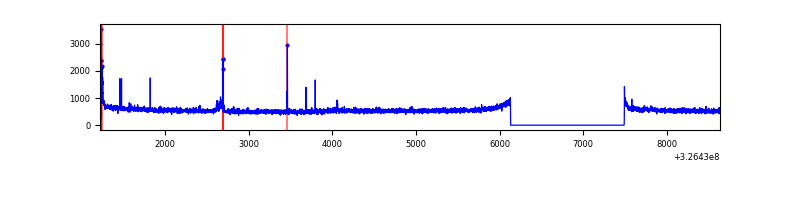 |
| D | 7415 | 6056 | 46 | 46 | 0.62% | 0.76% |  |
Top three noisy pixels from each quadrant. If the there are fewer than three noisy pixels in the level2.evt file, extra rows are filled as -1
| Pixel properties | Quadrant properties | ||||||
|---|---|---|---|---|---|---|---|
| Quadrant | DetID | PixID | Counts | Sigma | Mean | Median | Sigma |
| A | 4 | 2 | 10808 | 60.26 | 842 | 830 | 165.6 |
| A | 13 | 254 | 9317 | 51.26 | 842 | 830 | 165.6 |
| A | 3 | 137 | 7222 | 38.6 | 842 | 830 | 165.6 |
| B | 12 | 111 | 18623 | 112.33 | 840 | 821 | 158.5 |
| B | 11 | 111 | 16655 | 99.91 | 840 | 821 | 158.5 |
| B | 14 | 111 | 15935 | 95.37 | 840 | 821 | 158.5 |
| C | 14 | 238 | 128440 | 692.85 | 792 | 800 | 184.2 |
| C | 7 | 247 | 64985 | 348.41 | 792 | 800 | 184.2 |
| C | 2 | 16 | 52080 | 278.36 | 792 | 800 | 184.2 |
| D | 8 | 195 | 306199 | 1582.2 | 795 | 774 | 193.0 |
| D | 7 | 238 | 178848 | 922.48 | 795 | 774 | 193.0 |
| D | 1 | 52 | 131882 | 679.18 | 795 | 774 | 193.0 |
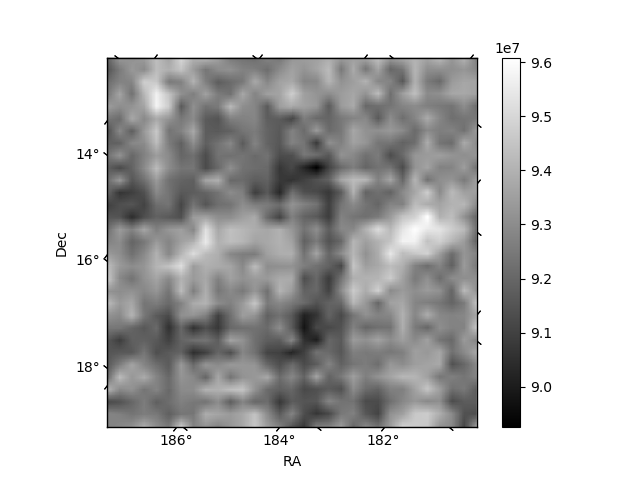
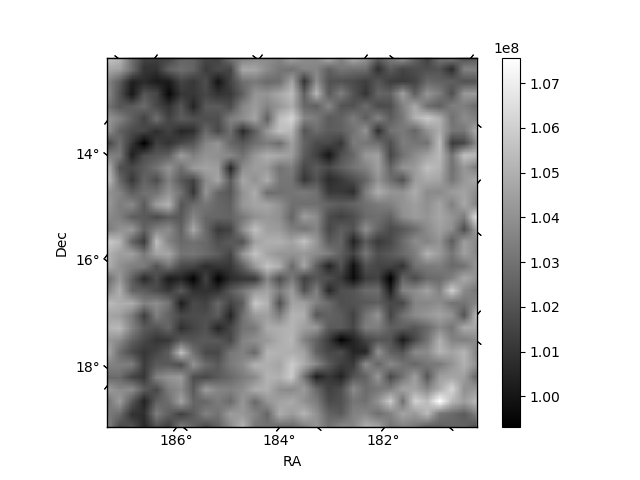
Histogram calculated using DETX and DETY for each event in the final _common_clean file
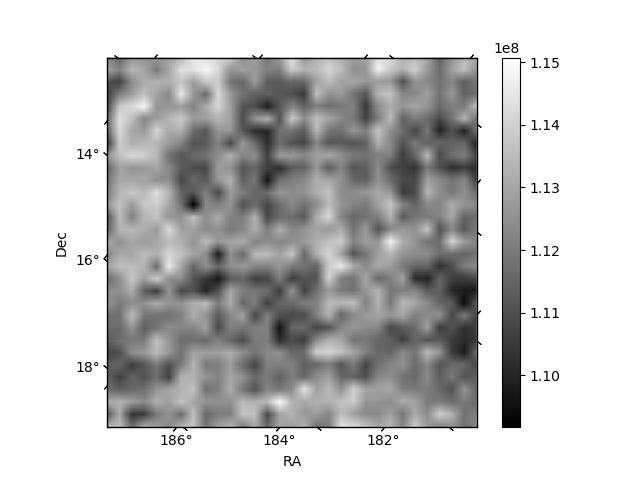
| Quadrant A | 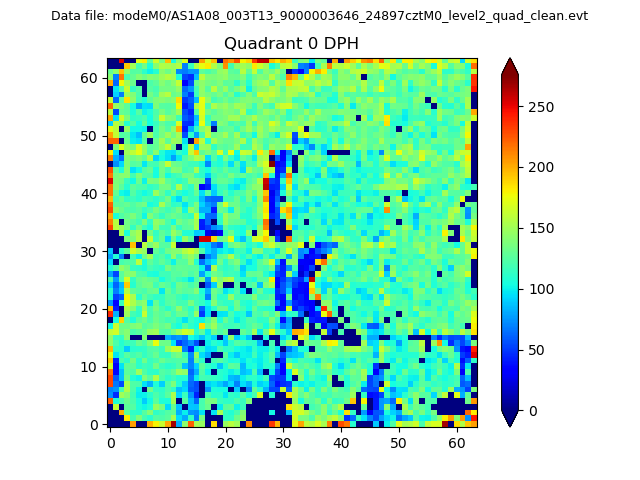 |
 |
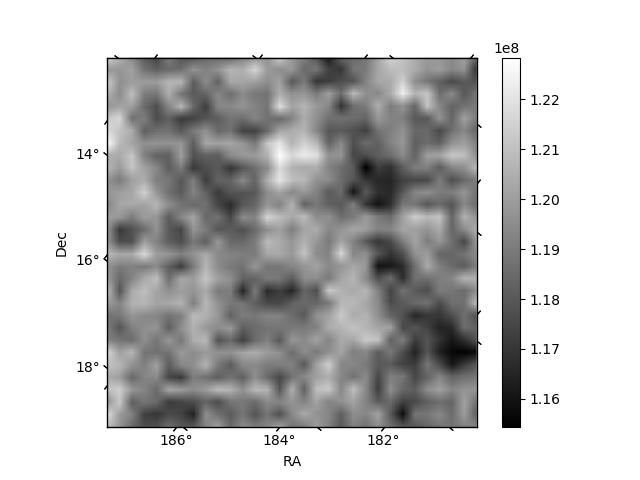
Quadrant B |
|---|---|---|---|
| Quadrant D | 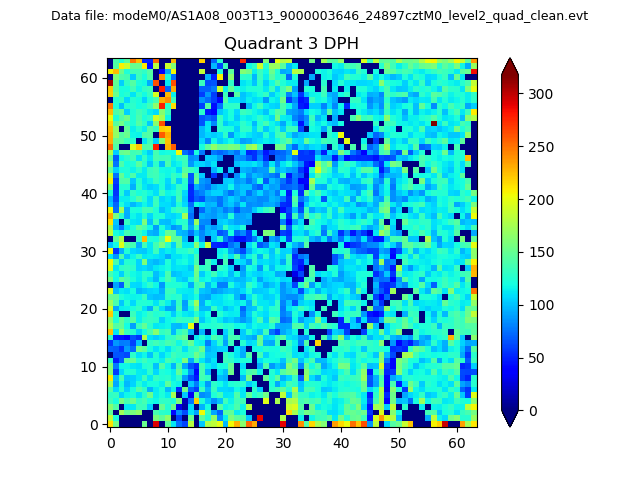 |
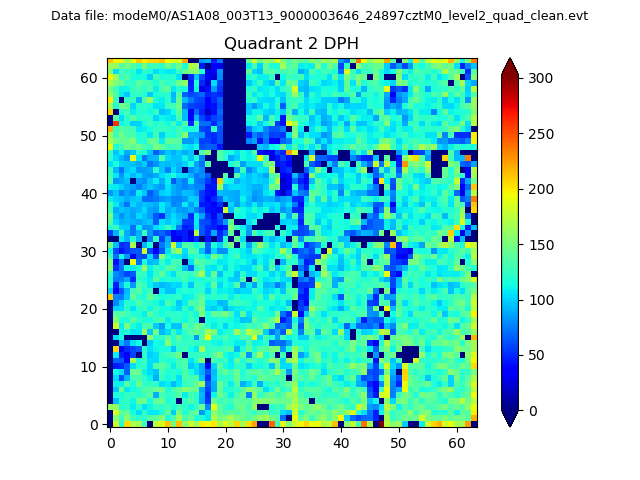 |
Quadrant C |
| Plot type | Count rate plots | Images |
|---|---|---|
| Comparison with Poisson distribution Blue bars denote a histogram of data divided into 1 sec bins. Red curve is a Poisson curve with rate = median count rate of data. |
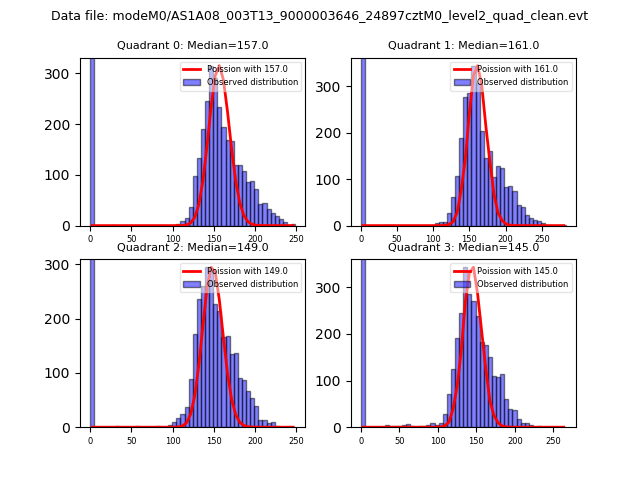 |
 |
| Quadrant-wise count rates Data is divided into 100 sec bins |
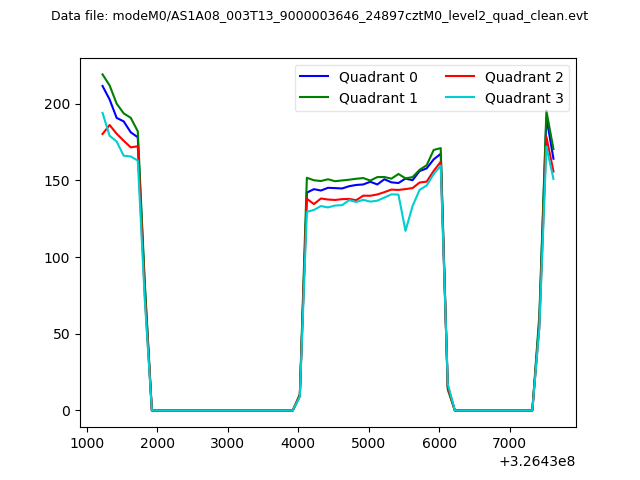 |
|
| Module-wise count rates for Quadrant A Data is divided into 100 sec bins |
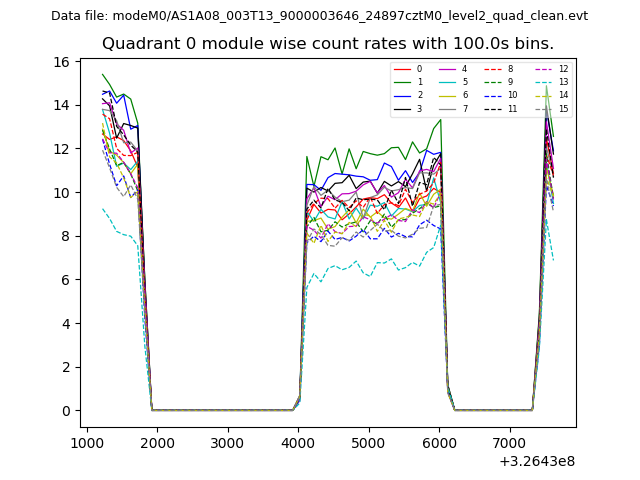 |
 |
| Module-wise count rates for Quadrant B Data is divided into 100 sec bins |
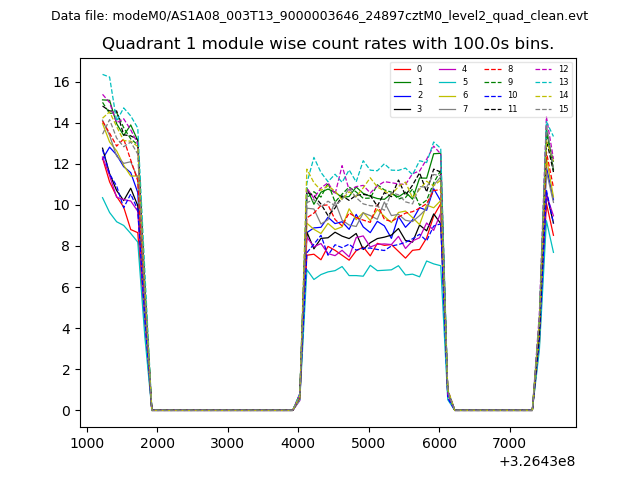 |
 |
| Module-wise count rates for Quadrant C Data is divided into 100 sec bins |
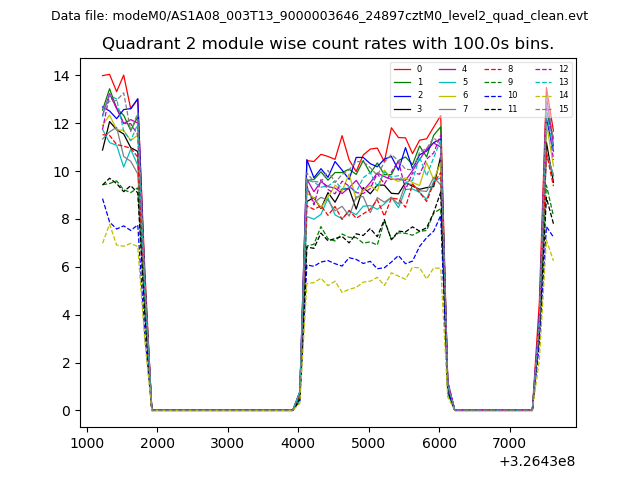 |
 |
| Module-wise count rates for Quadrant D Data is divided into 100 sec bins |
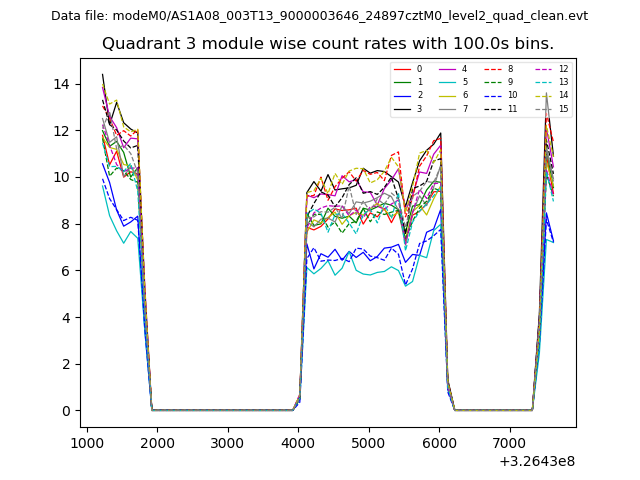 |
 |
| Parameter | Plot |
|---|---|
| CZT HV Monitor | 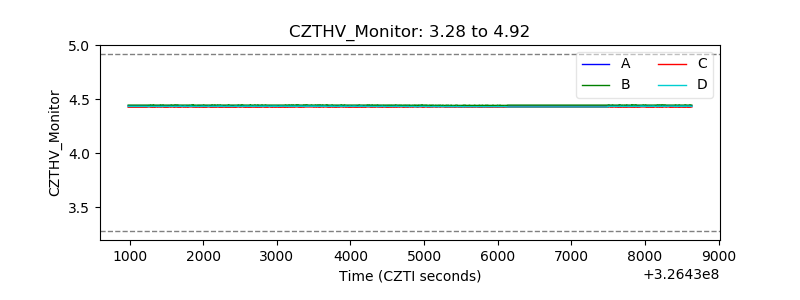 |
| D_VDD | 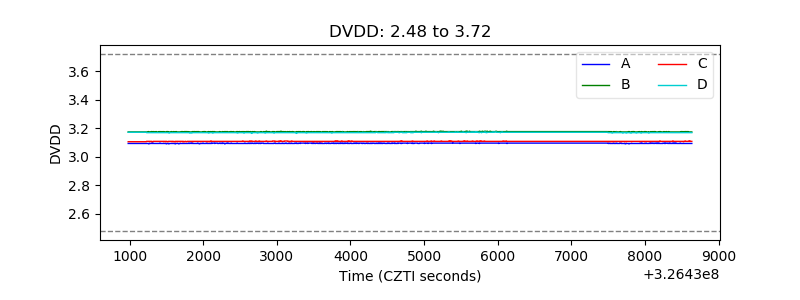 |
| Temperature 1 | 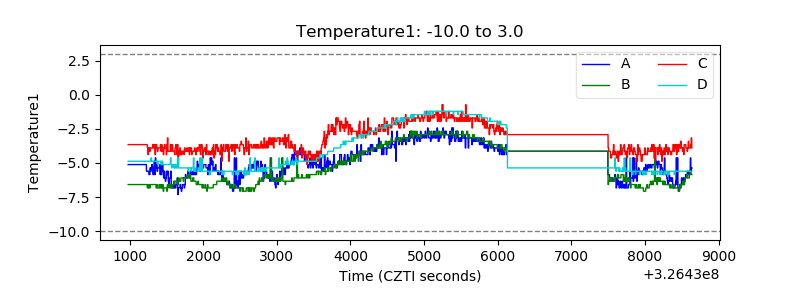 |
| Veto HV Monitor | 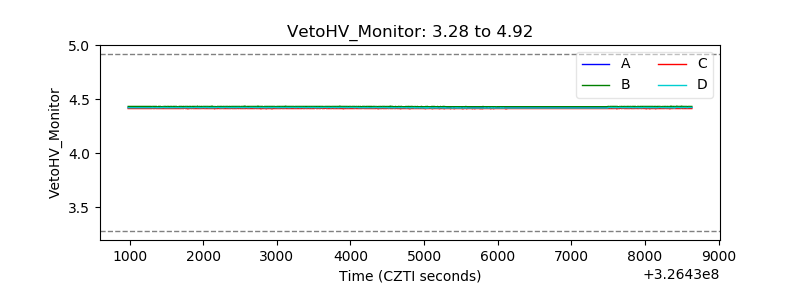 |
| Veto LLD | 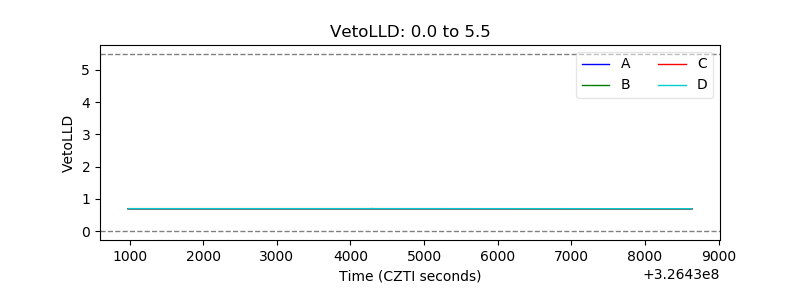 |
| Alpha Counter | 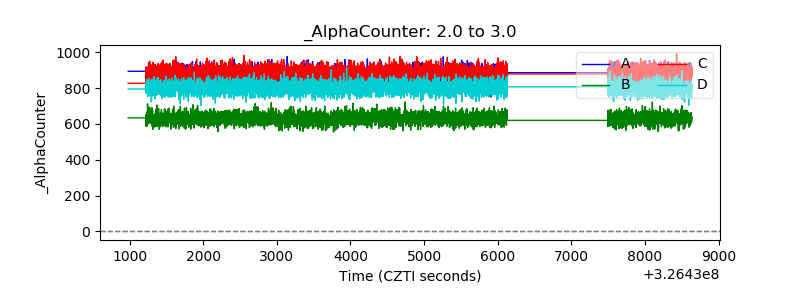 |
| _CPM_Rate | 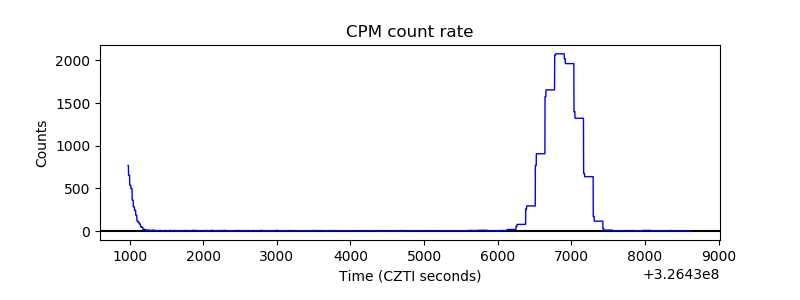 |
| CZT Counter | 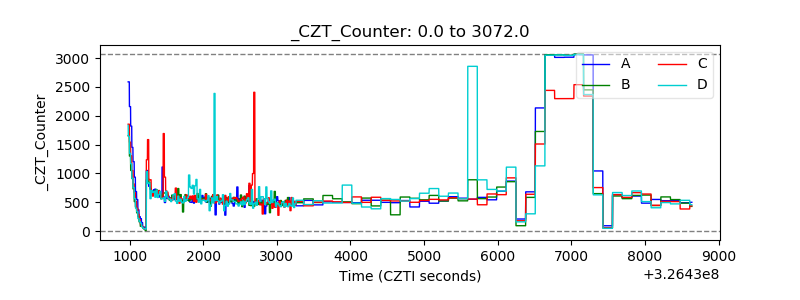 |
| +2.5 Volts monitor |  |
| +5 Volts monitor | 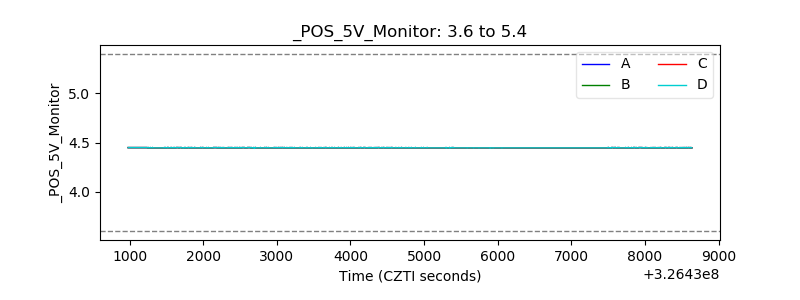 |
| _ROLL_ROT | 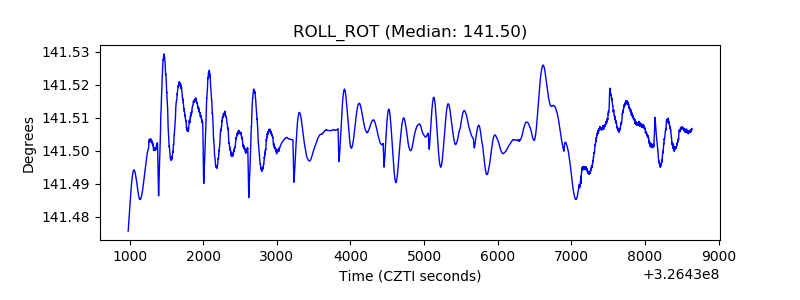 |
| _Roll_DEC | 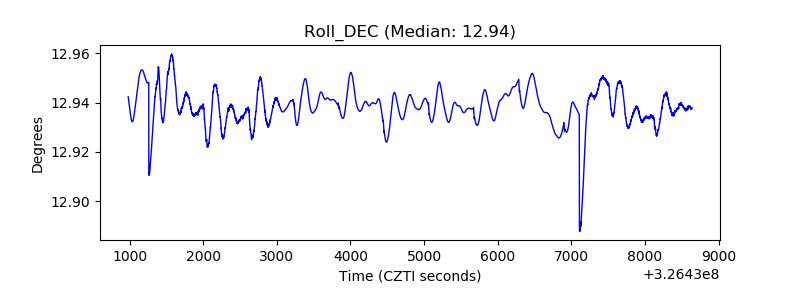 |
| _Roll_RA | 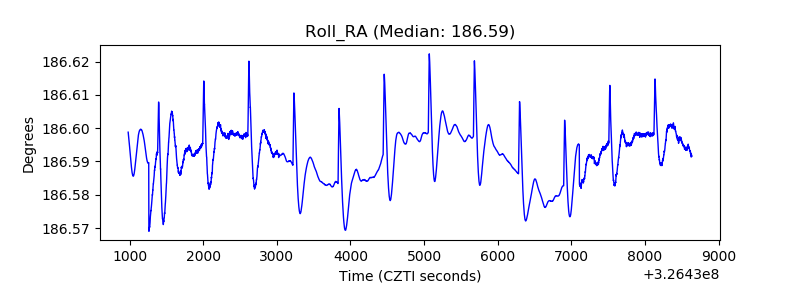 |
| Veto Counter | 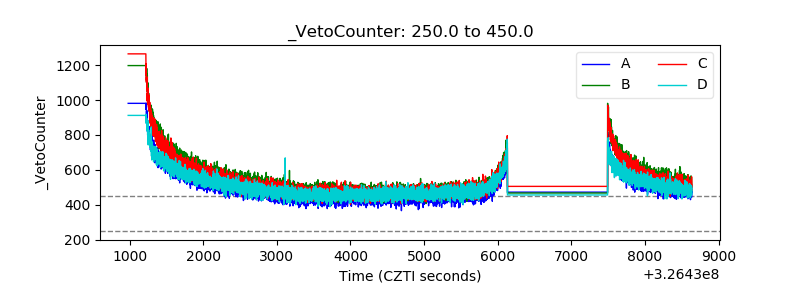 |