| Param | Original file | Final file |
|---|---|---|
| Filename | modeM0/AS1A08_003T13_9000003646_24898cztM0_level2.evt | modeM0/AS1A08_003T13_9000003646_24898cztM0_level2_quad_clean.evt |
| Size (bytes) | 475,571,520 | 67,512,960 |
| Size | 453.5 MB | 64.4 MB |
| Events in quadrant A | 3,285,195 | 412,721 |
| Events in quadrant B | 3,376,897 | 421,907 |
| Events in quadrant C | 3,451,050 | 391,595 |
| Events in quadrant D | 3,862,903 | 379,104 |
| Mode SS | |||
|---|---|---|---|
| Quadrant | BADHDUFLAG | Total packets | Discarded packets |
| A | 0 | 128 | 0 |
| B | 0 | 128 | 0 |
| C | 0 | 128 | 0 |
| D | 0 | 128 | 0 |
| Mode M0 | |||
|---|---|---|---|
| Quadrant | BADHDUFLAG | Total packets | Discarded packets |
| A | 0 | 13250 | 2 |
| B | 0 | 13501 | 2 |
| C | 0 | 13759 | 2 |
| D | 0 | 15531 | 2 |
| Mode M9 | |||
|---|---|---|---|
| Quadrant | BADHDUFLAG | Total packets | Discarded packets |
| A | 0 | 15 | 0 |
| B | 0 | 16 | 0 |
| C | 0 | 16 | 0 |
| D | 0 | 16 | 0 |
| Quadrant | Total seconds | Saturated seconds | Saturation percentage |
|---|---|---|---|
| A | 6285 | 57 | 0.906921% |
| B | 6285 | 83 | 1.320605% |
| C | 6284 | 129 | 2.052833% |
| D | 6284 | 50 | 0.795672% |
Noise dominated data is calculated using 1-second bins in cleaned event files. If a bin has >2000 counts, and if more than 50% of those come from <1% of pixels, then it is considered to be noise-dominated and hence unusable.
| Quadrant | # 1 sec bins | Bins with >0 counts | Bins with >2000 counts | High rate bins dominated by noise | Noise dominated (total time) | Noise dominated (detector-on time) | Marked lightcurve |
|---|---|---|---|---|---|---|---|
| A | 7490 | 6286 | 0 | 0 | 0.00% | 0.00% | 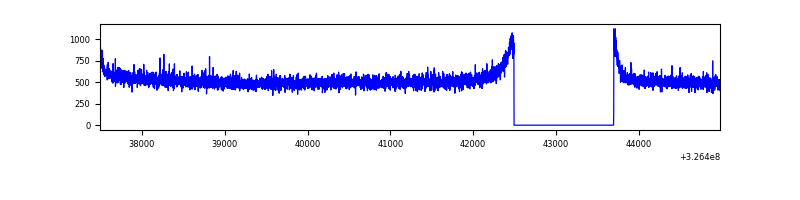 |
| B | 7490 | 6286 | 1 | 1 | 0.01% | 0.02% | 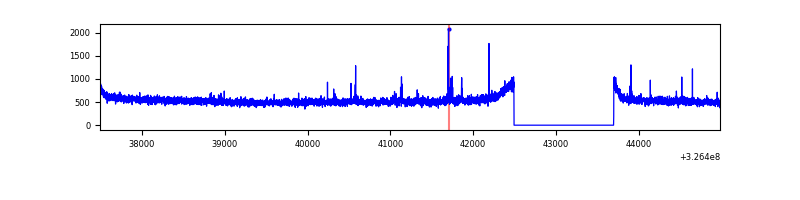 |
| C | 7489 | 6285 | 13 | 13 | 0.17% | 0.21% | 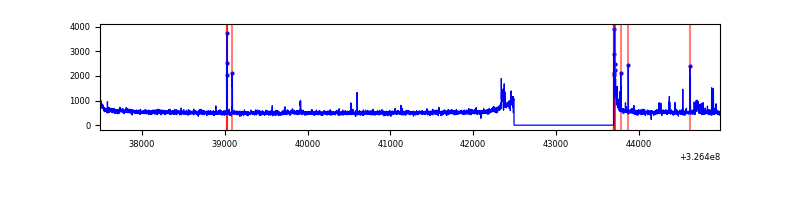 |
| D | 7489 | 6285 | 12 | 12 | 0.16% | 0.19% | 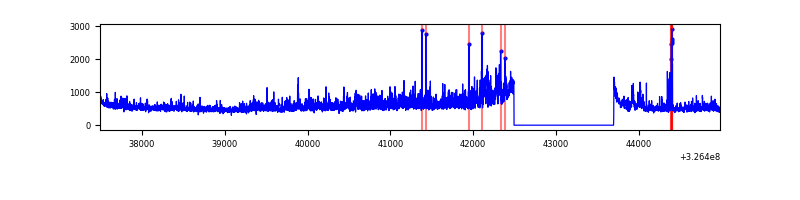 |
Top three noisy pixels from each quadrant. If the there are fewer than three noisy pixels in the level2.evt file, extra rows are filled as -1
| Pixel properties | Quadrant properties | ||||||
|---|---|---|---|---|---|---|---|
| Quadrant | DetID | PixID | Counts | Sigma | Mean | Median | Sigma |
| A | 13 | 254 | 8992 | 47.75 | 852 | 836 | 170.8 |
| A | 3 | 137 | 7563 | 39.39 | 852 | 836 | 170.8 |
| A | 0 | 226 | 7172 | 37.1 | 852 | 836 | 170.8 |
| B | 0 | 190 | 31089 | 187.44 | 849 | 827 | 161.5 |
| B | 12 | 111 | 19470 | 115.47 | 849 | 827 | 161.5 |
| B | 11 | 111 | 17539 | 103.51 | 849 | 827 | 161.5 |
| C | 2 | 16 | 129861 | 694.68 | 799 | 807 | 185.8 |
| C | 14 | 238 | 129395 | 692.17 | 799 | 807 | 185.8 |
| C | 0 | 10 | 43123 | 227.78 | 799 | 807 | 185.8 |
| D | 8 | 195 | 458152 | 2323.0 | 809 | 789 | 196.9 |
| D | 1 | 52 | 314611 | 1593.94 | 809 | 789 | 196.9 |
| D | 7 | 238 | 31811 | 157.56 | 809 | 789 | 196.9 |
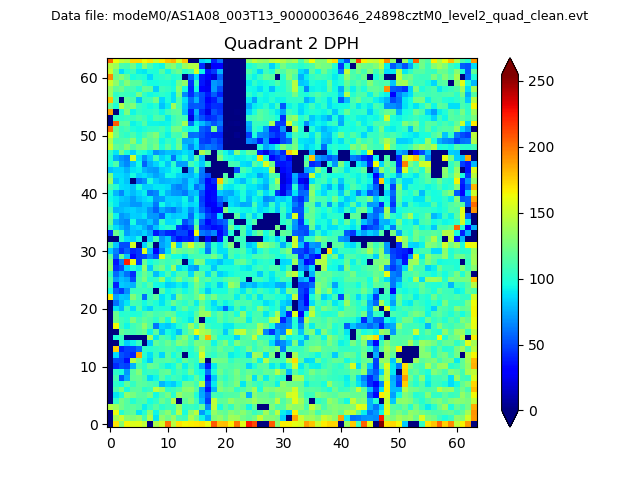
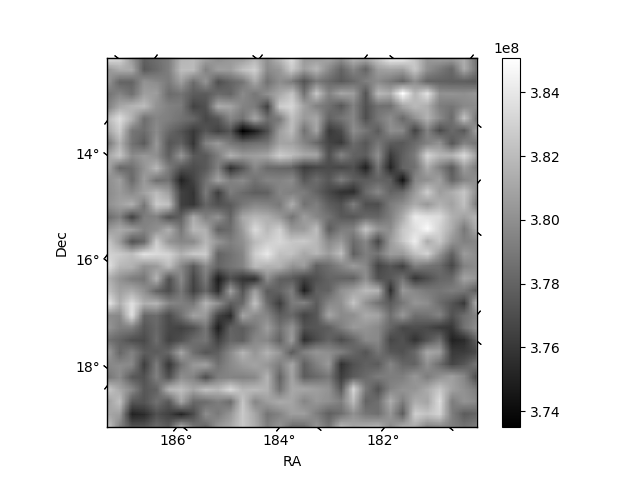
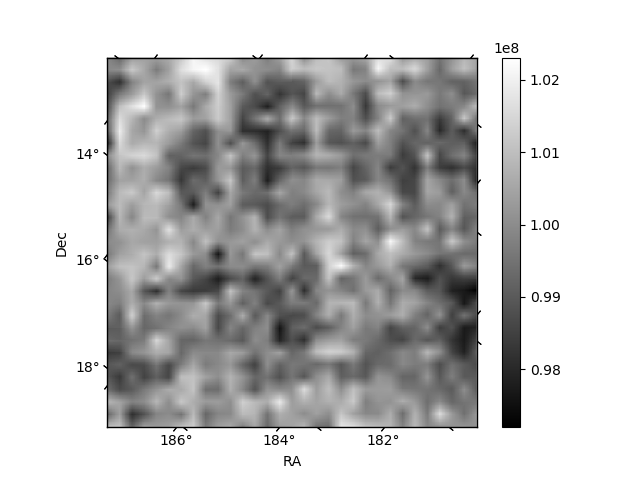
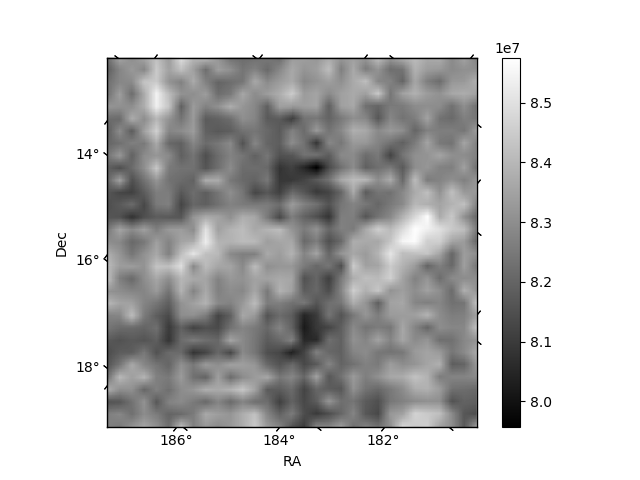
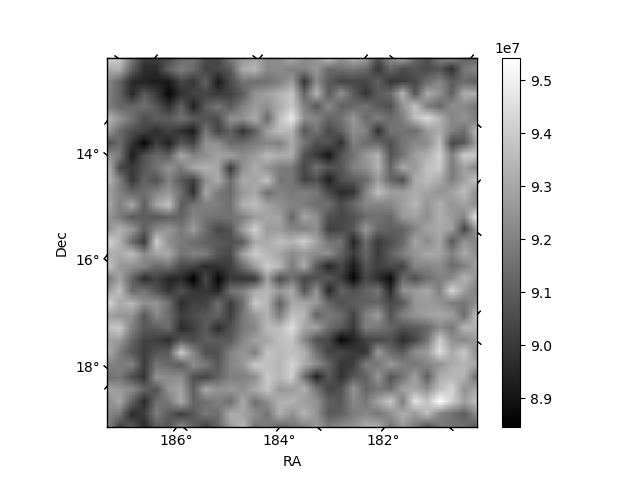
Histogram calculated using DETX and DETY for each event in the final _common_clean file
| Quadrant A | 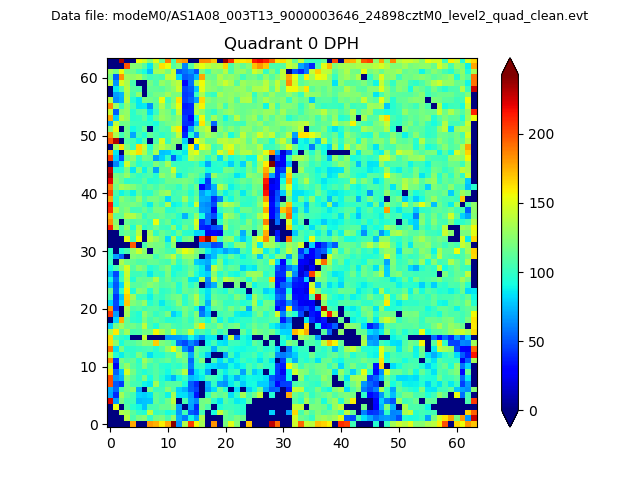 |
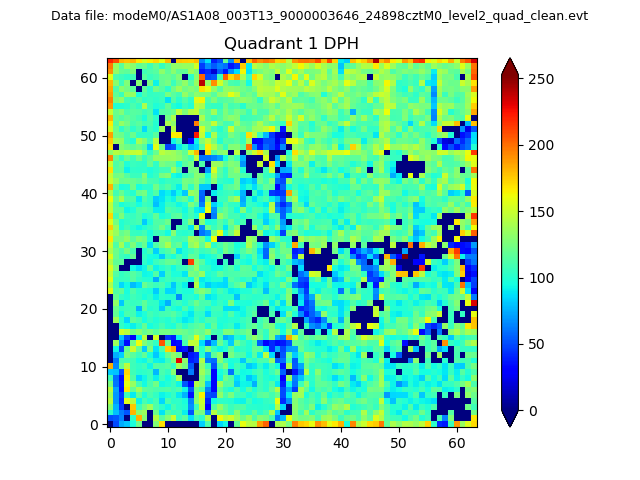 |
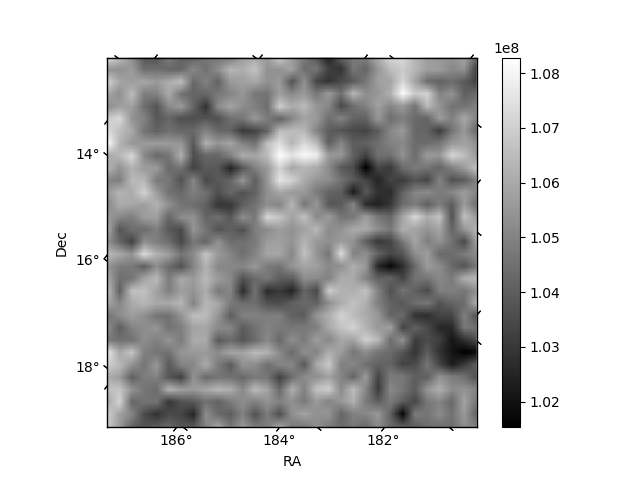
Quadrant B |
|---|---|---|---|
| Quadrant D | 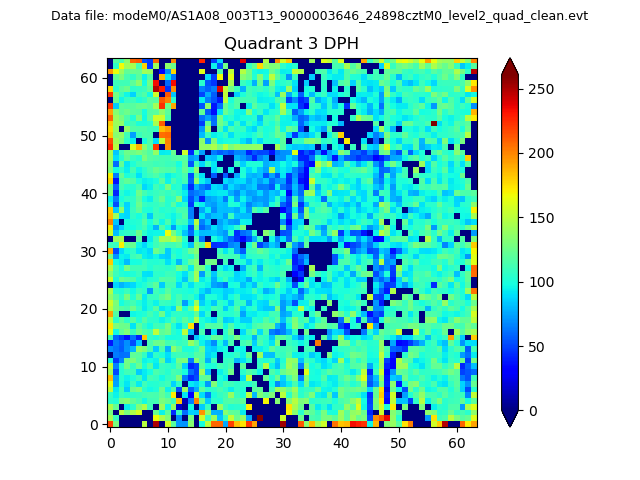 |
 |
Quadrant C |
| Plot type | Count rate plots | Images |
|---|---|---|
| Comparison with Poisson distribution Blue bars denote a histogram of data divided into 1 sec bins. Red curve is a Poisson curve with rate = median count rate of data. |
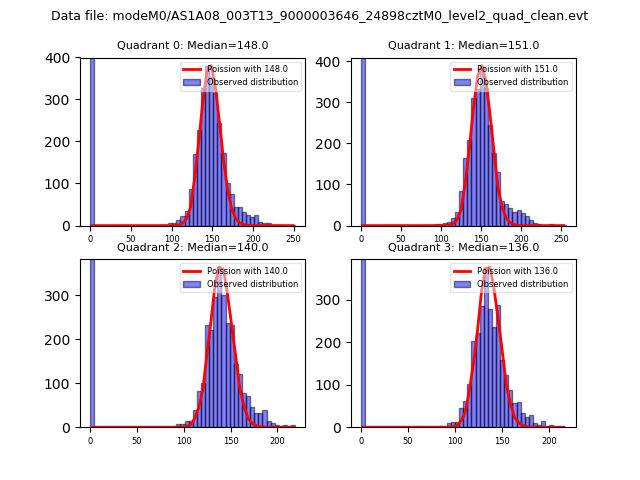 |
 |
| Quadrant-wise count rates Data is divided into 100 sec bins |
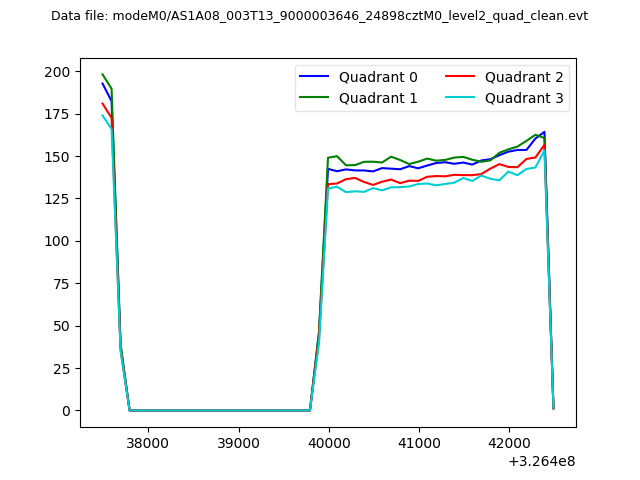 |
|
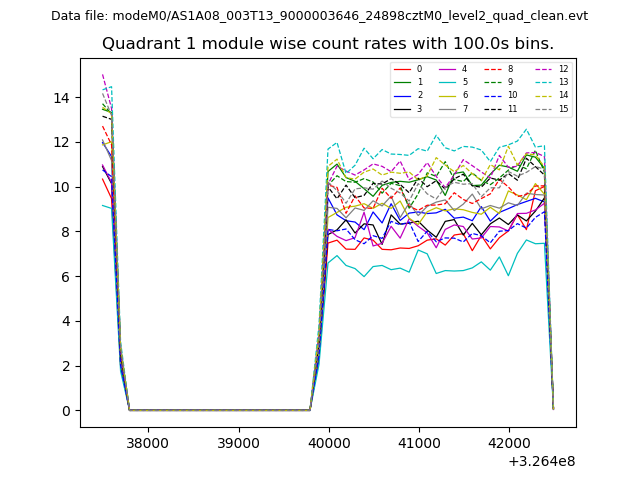
| Module-wise count rates for Quadrant A Data is divided into 100 sec bins |
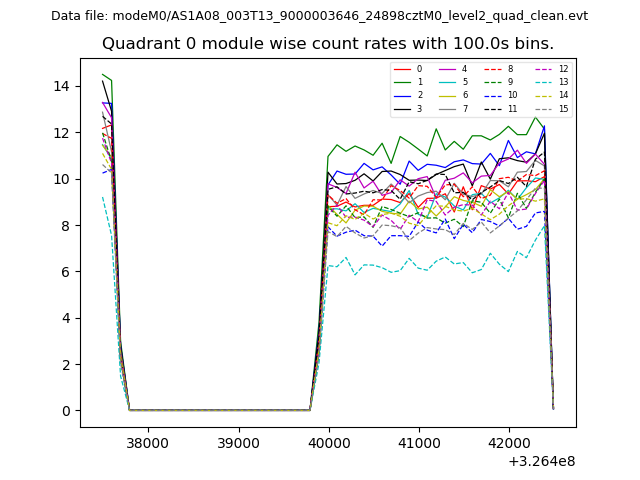 |
 |
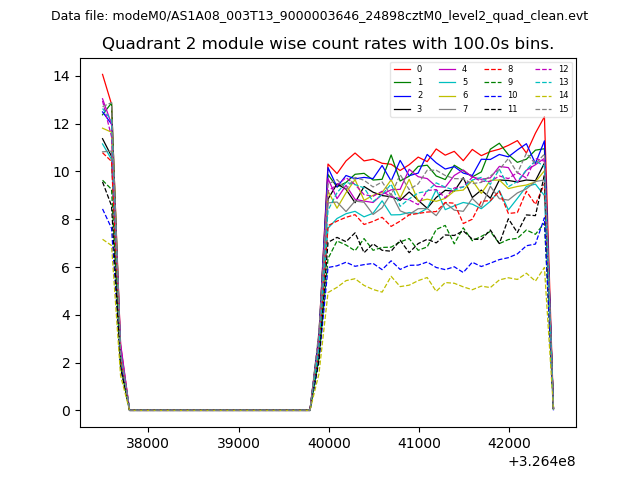
| Module-wise count rates for Quadrant B Data is divided into 100 sec bins |
 |
 |
| Module-wise count rates for Quadrant C Data is divided into 100 sec bins |
 |
 |
| Module-wise count rates for Quadrant D Data is divided into 100 sec bins |
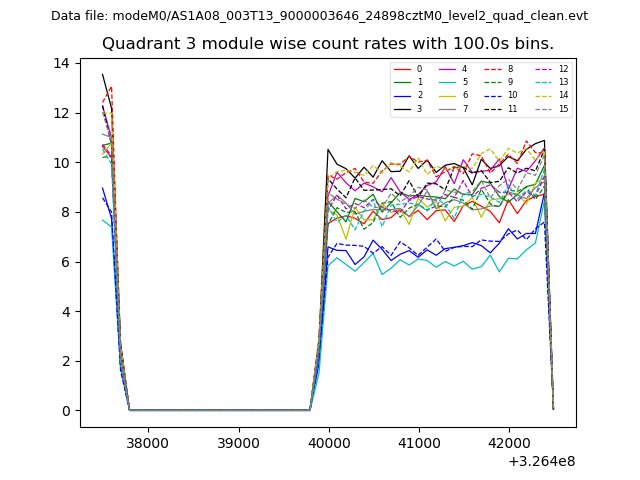 |
 |
| Parameter | Plot |
|---|---|
| CZT HV Monitor | 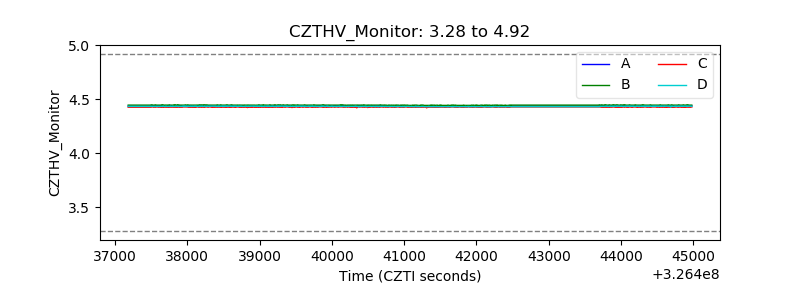 |
| D_VDD | 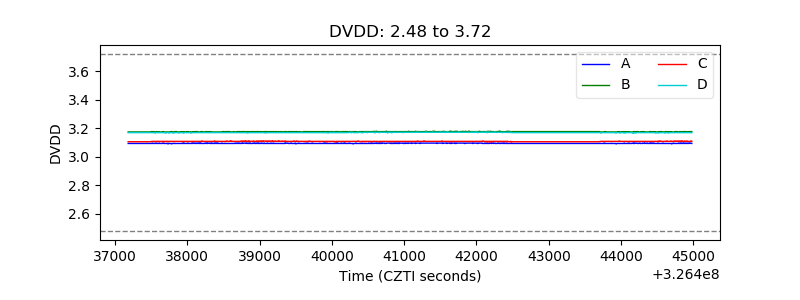 |
| Temperature 1 | 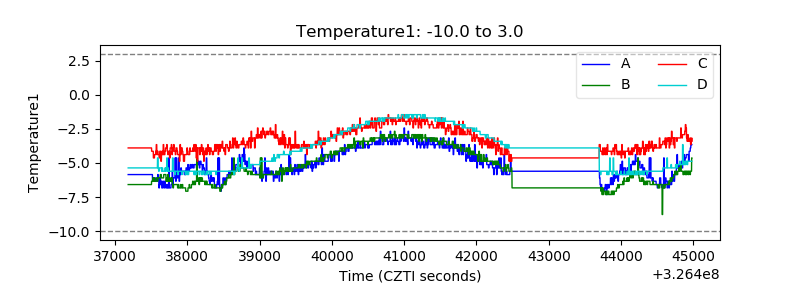 |
| Veto HV Monitor | 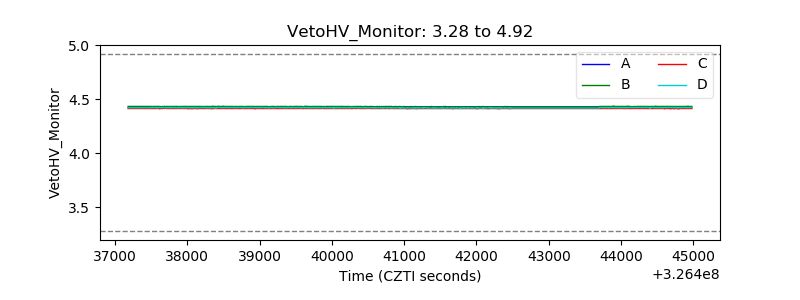 |
| Veto LLD | 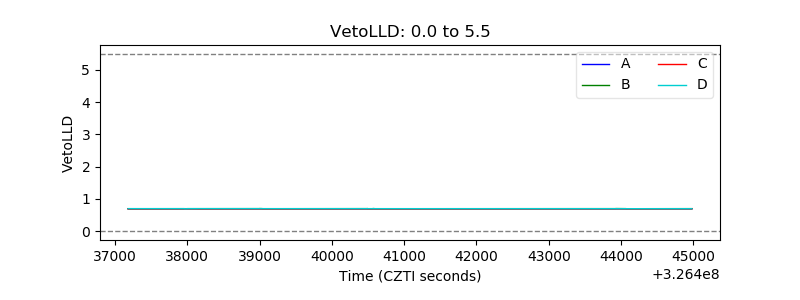 |
| Alpha Counter | 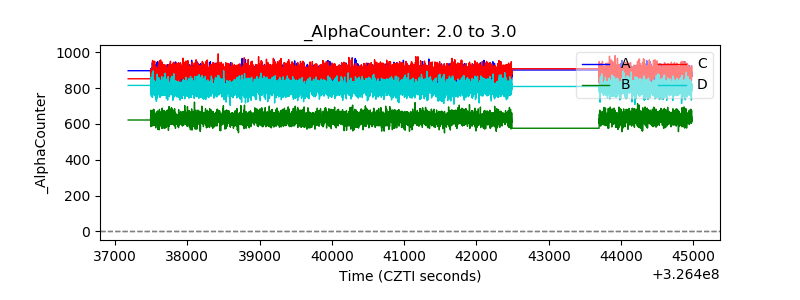 |
| _CPM_Rate | 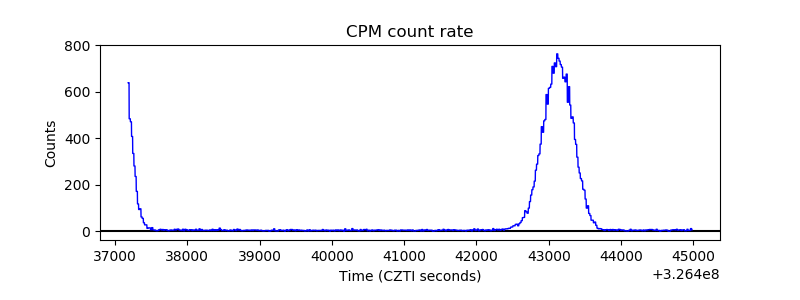 |
| CZT Counter | 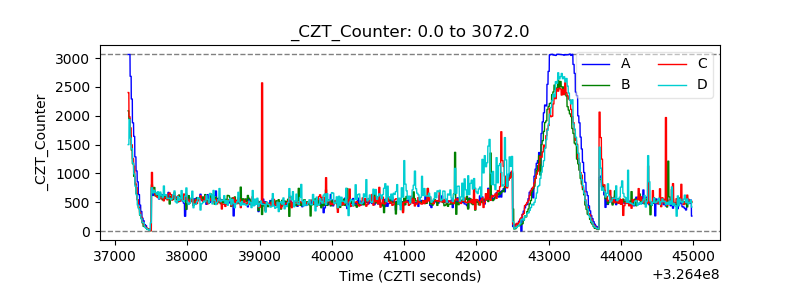 |
| +2.5 Volts monitor |  |
| +5 Volts monitor | 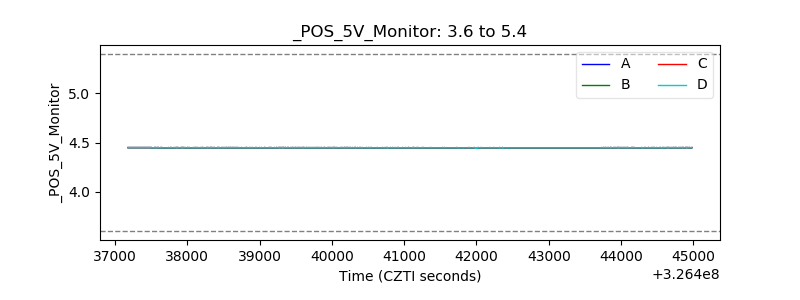 |
| _ROLL_ROT | 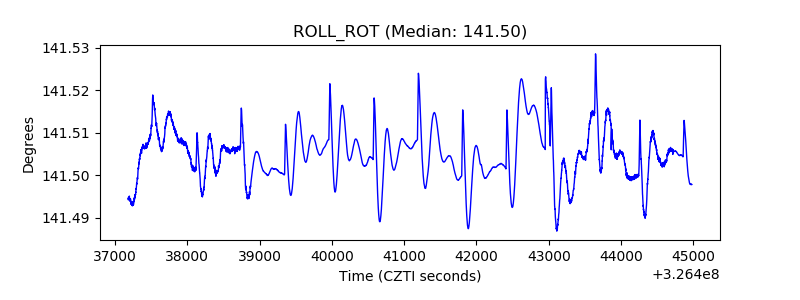 |
| _Roll_DEC | 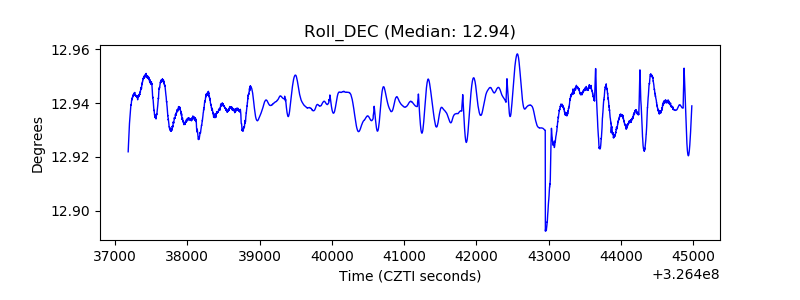 |
| _Roll_RA | 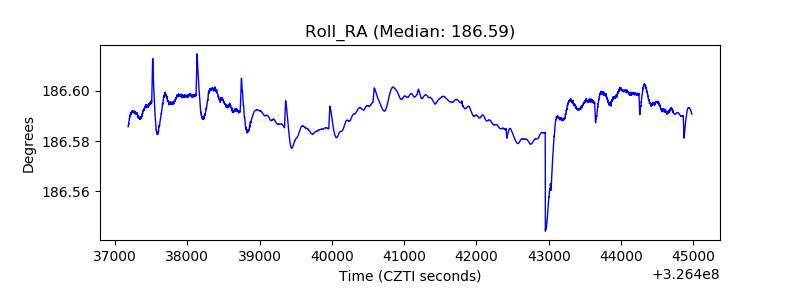 |
| Veto Counter | 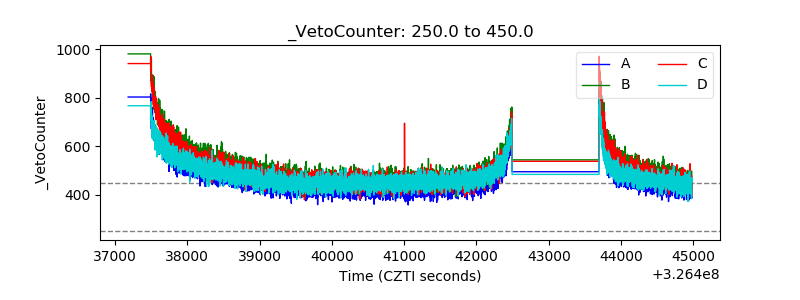 |