| Param | Original file | Final file |
|---|---|---|
| Filename | modeM0/AS1A08_003T13_9000003646_24899cztM0_level2.evt | modeM0/AS1A08_003T13_9000003646_24899cztM0_level2_quad_clean.evt |
| Size (bytes) | 549,201,600 | 82,284,480 |
| Size | 523.8 MB | 78.5 MB |
| Events in quadrant A | 3,718,147 | 511,498 |
| Events in quadrant B | 3,847,341 | 516,936 |
| Events in quadrant C | 4,066,976 | 485,647 |
| Events in quadrant D | 4,510,542 | 475,019 |
| Mode SS | |||
|---|---|---|---|
| Quadrant | BADHDUFLAG | Total packets | Discarded packets |
| A | 0 | 148 | 0 |
| B | 0 | 148 | 0 |
| C | 0 | 148 | 0 |
| D | 0 | 148 | 0 |
| Mode M0 | |||
|---|---|---|---|
| Quadrant | BADHDUFLAG | Total packets | Discarded packets |
| A | 0 | 15286 | 2 |
| B | 0 | 15573 | 2 |
| C | 0 | 16276 | 2 |
| D | 0 | 17879 | 2 |
| Mode M9 | |||
|---|---|---|---|
| Quadrant | BADHDUFLAG | Total packets | Discarded packets |
| A | 0 | 20 | 0 |
| B | 0 | 20 | 0 |
| C | 0 | 20 | 0 |
| D | 0 | 20 | 0 |
| Quadrant | Total seconds | Saturated seconds | Saturation percentage |
|---|---|---|---|
| A | 7216 | 179 | 2.480599% |
| B | 7217 | 221 | 3.062214% |
| C | 7217 | 282 | 3.907441% |
| D | 7217 | 261 | 3.616461% |
Noise dominated data is calculated using 1-second bins in cleaned event files. If a bin has >2000 counts, and if more than 50% of those come from <1% of pixels, then it is considered to be noise-dominated and hence unusable.
| Quadrant | # 1 sec bins | Bins with >0 counts | Bins with >2000 counts | High rate bins dominated by noise | Noise dominated (total time) | Noise dominated (detector-on time) | Marked lightcurve |
|---|---|---|---|---|---|---|---|
| A | 9231 | 7218 | 0 | 0 | 0.00% | 0.00% |  |
| B | 9232 | 7219 | 3 | 3 | 0.03% | 0.04% | 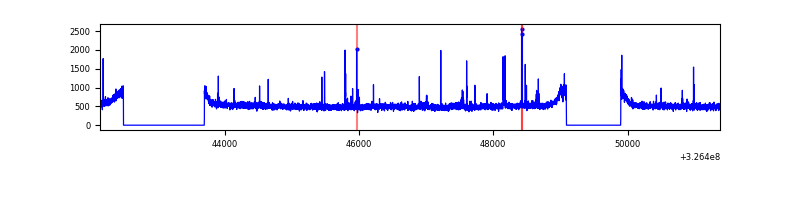 |
| C | 9232 | 7219 | 35 | 35 | 0.38% | 0.48% | 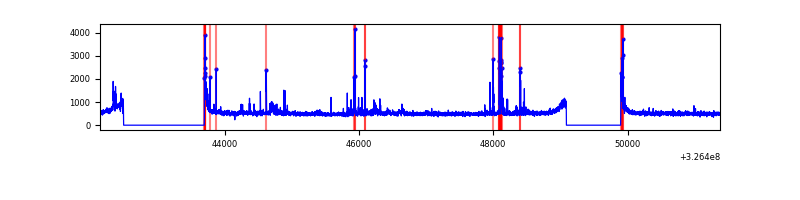 |
| D | 9232 | 7219 | 144 | 144 | 1.56% | 1.99% | 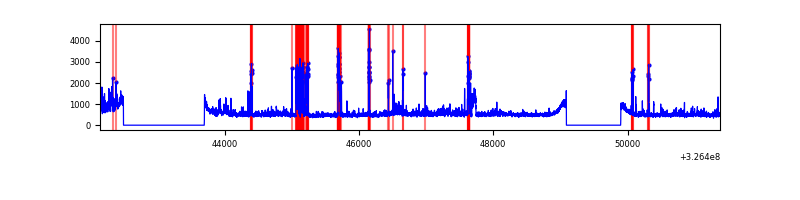 |
Top three noisy pixels from each quadrant. If the there are fewer than three noisy pixels in the level2.evt file, extra rows are filled as -1
| Pixel properties | Quadrant properties | ||||||
|---|---|---|---|---|---|---|---|
| Quadrant | DetID | PixID | Counts | Sigma | Mean | Median | Sigma |
| A | 13 | 254 | 10734 | 50.49 | 964 | 944 | 193.9 |
| A | 3 | 137 | 8955 | 41.32 | 964 | 944 | 193.9 |
| A | 0 | 226 | 8169 | 37.27 | 964 | 944 | 193.9 |
| B | 4 | 80 | 42186 | 225.38 | 954 | 929 | 183.1 |
| B | 12 | 111 | 23114 | 121.19 | 954 | 929 | 183.1 |
| B | 0 | 190 | 22462 | 117.63 | 954 | 929 | 183.1 |
| C | 2 | 16 | 261716 | 1237.21 | 902 | 910 | 210.8 |
| C | 14 | 238 | 143436 | 676.12 | 902 | 910 | 210.8 |
| C | 0 | 10 | 84933 | 398.59 | 902 | 910 | 210.8 |
| D | 1 | 52 | 641685 | 2844.49 | 918 | 891 | 225.3 |
| D | 8 | 195 | 284951 | 1260.94 | 918 | 891 | 225.3 |
| D | 7 | 238 | 113223 | 498.64 | 918 | 891 | 225.3 |
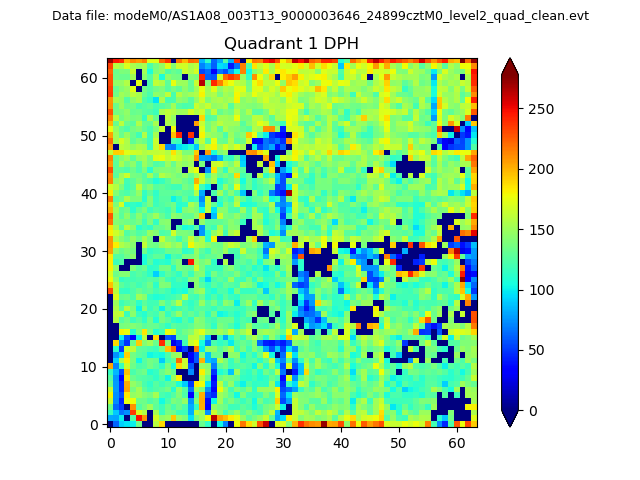
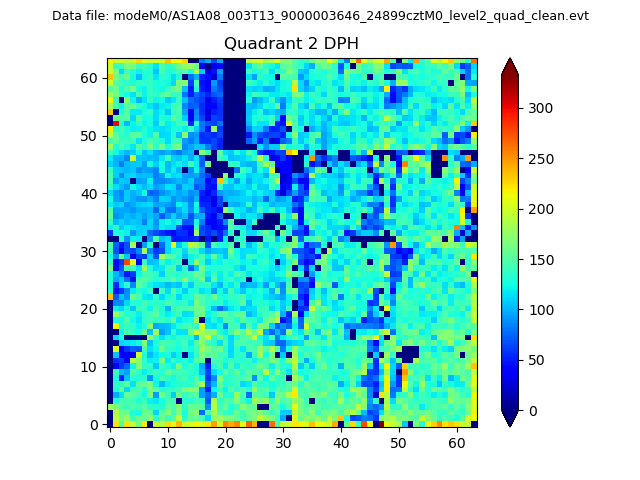
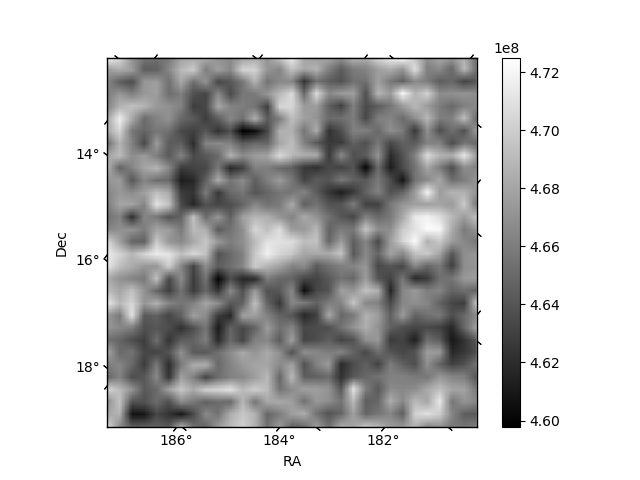
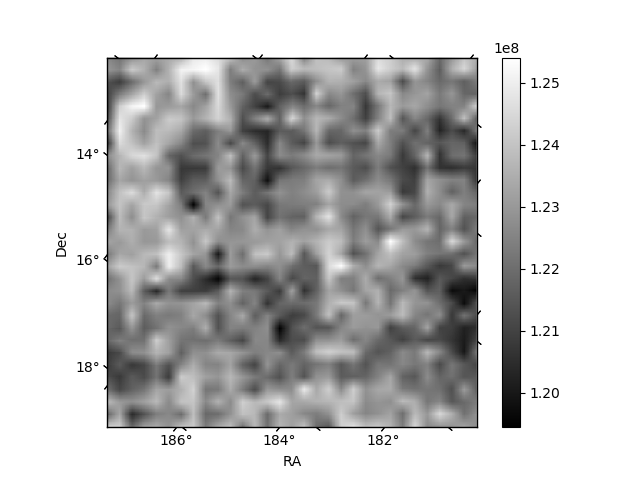
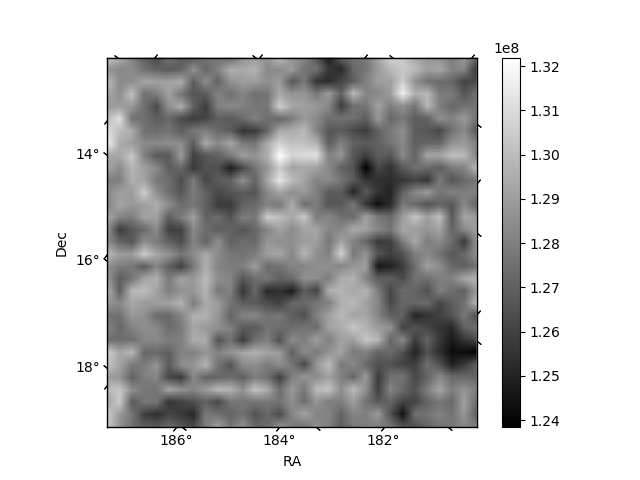
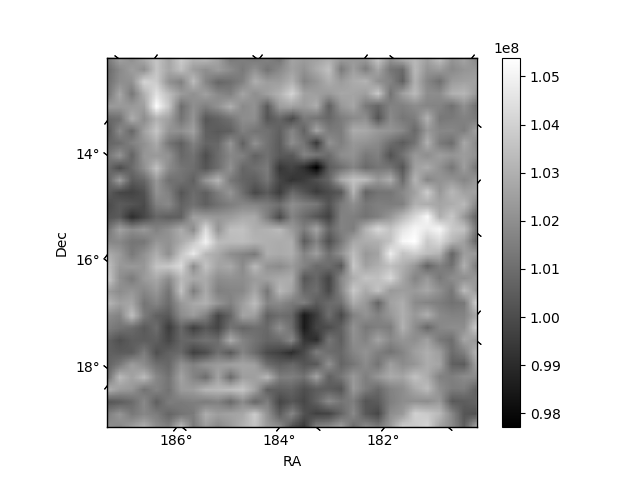
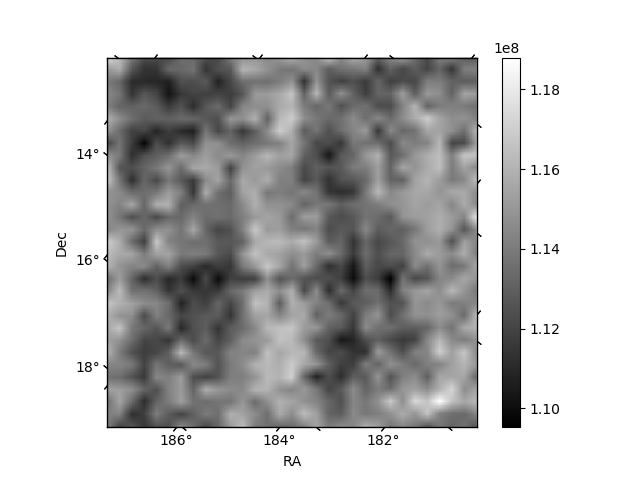
Histogram calculated using DETX and DETY for each event in the final _common_clean file
| Quadrant A | 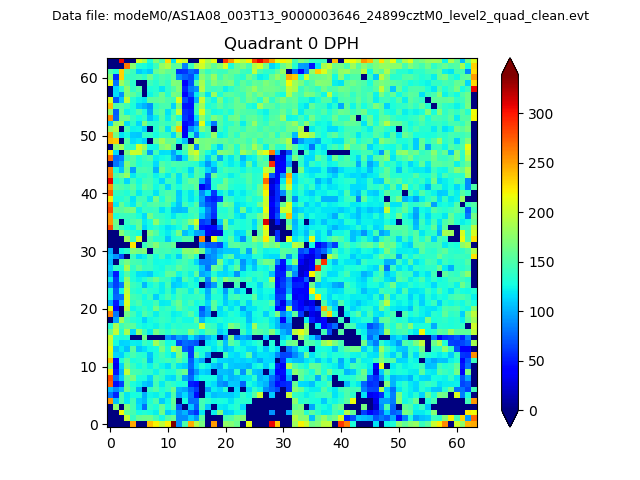 |
 |
Quadrant B |
|---|---|---|---|
| Quadrant D | 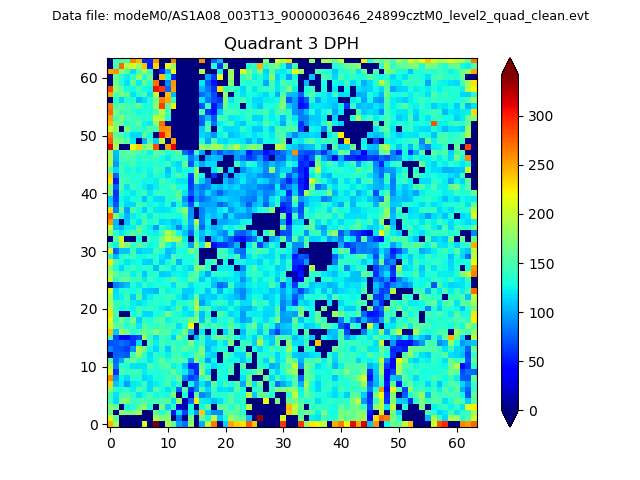 |
 |
Quadrant C |
| Plot type | Count rate plots | Images |
|---|---|---|
| Comparison with Poisson distribution Blue bars denote a histogram of data divided into 1 sec bins. Red curve is a Poisson curve with rate = median count rate of data. |
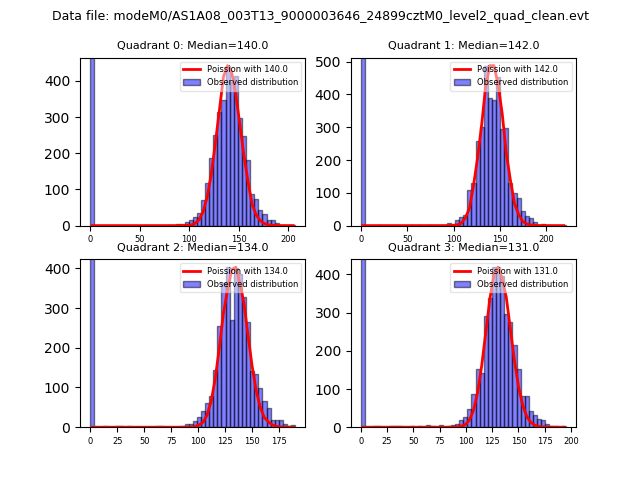 |
 |
| Quadrant-wise count rates Data is divided into 100 sec bins |
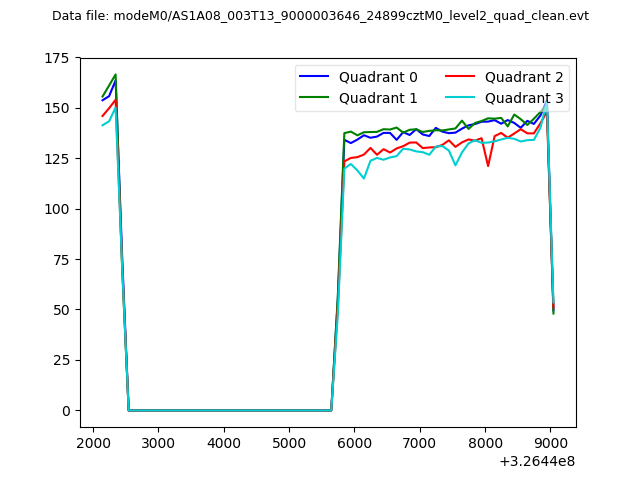 |
|
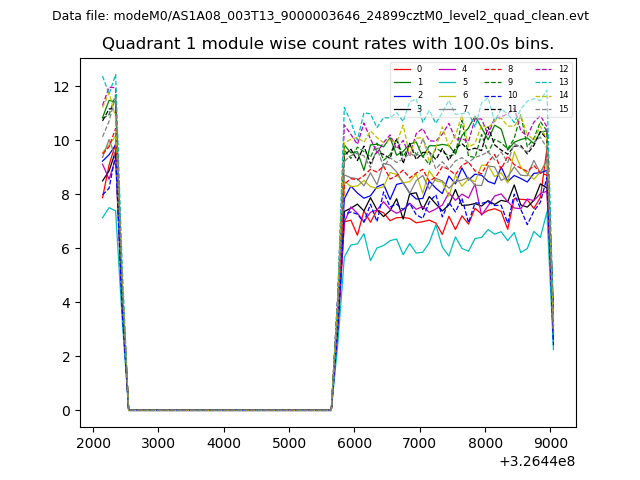
| Module-wise count rates for Quadrant A Data is divided into 100 sec bins |
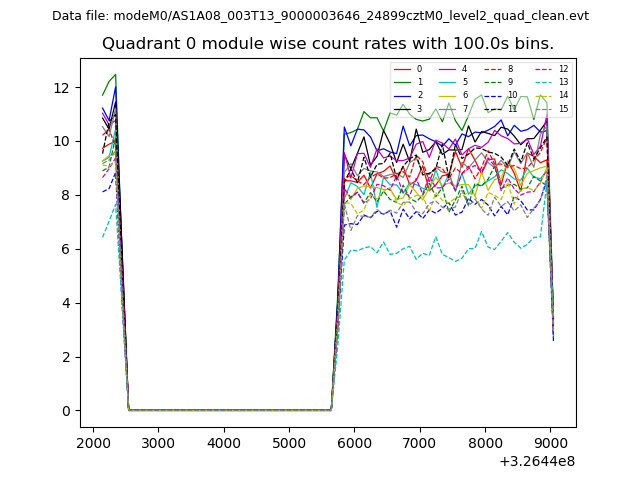 |
 |
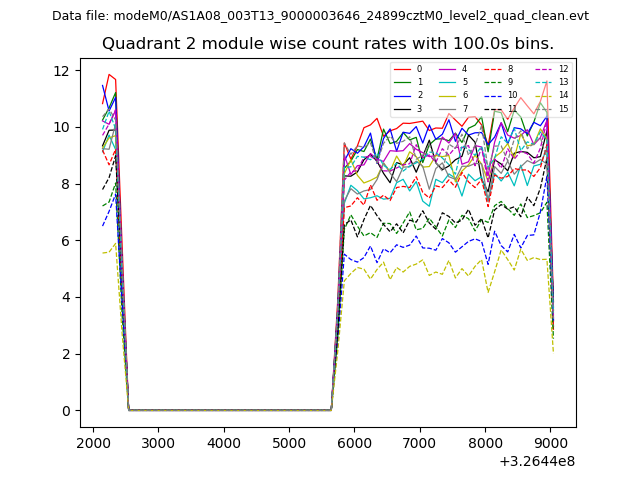
| Module-wise count rates for Quadrant B Data is divided into 100 sec bins |
 |
 |
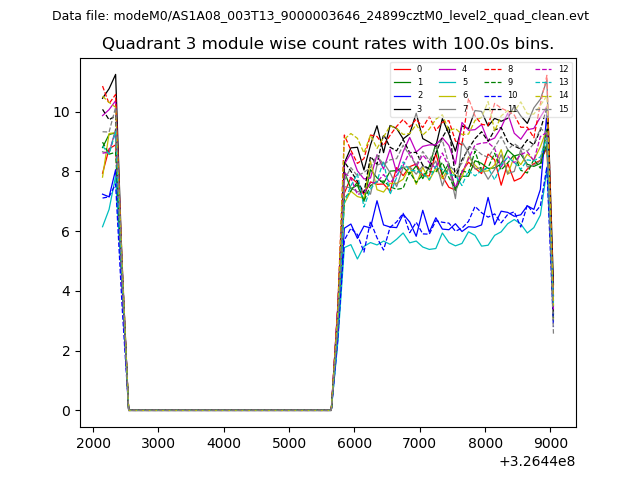
| Module-wise count rates for Quadrant C Data is divided into 100 sec bins |
 |
 |
| Module-wise count rates for Quadrant D Data is divided into 100 sec bins |
 |
 |
| Parameter | Plot |
|---|---|
| CZT HV Monitor | 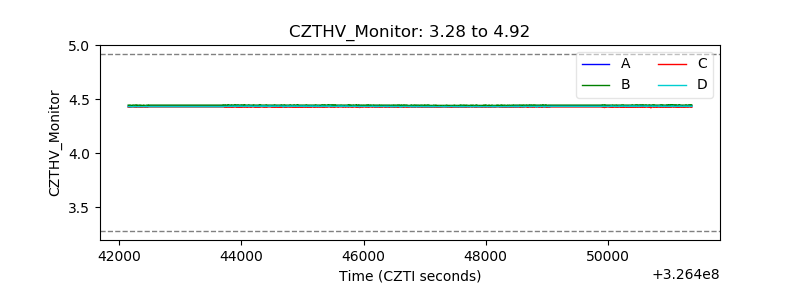 |
| D_VDD | 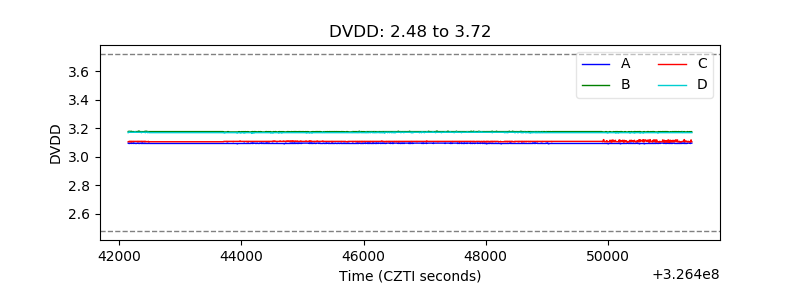 |
| Temperature 1 | 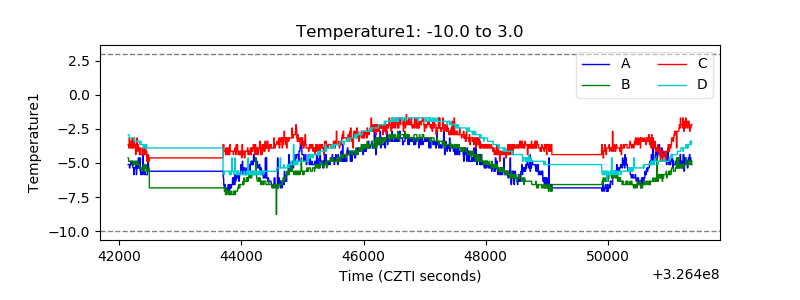 |
| Veto HV Monitor | 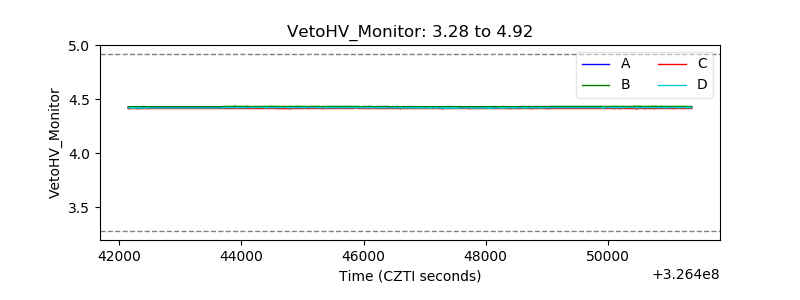 |
| Veto LLD | 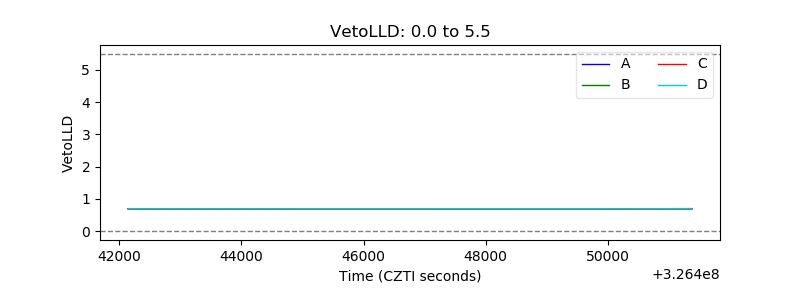 |
| Alpha Counter | 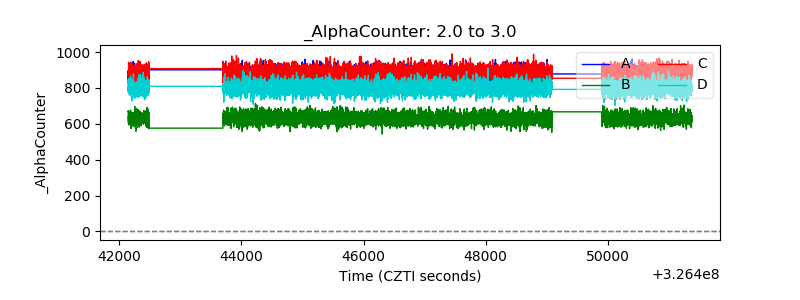 |
| _CPM_Rate | 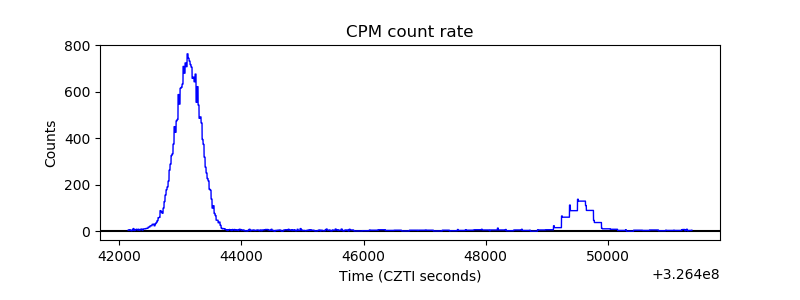 |
| CZT Counter | 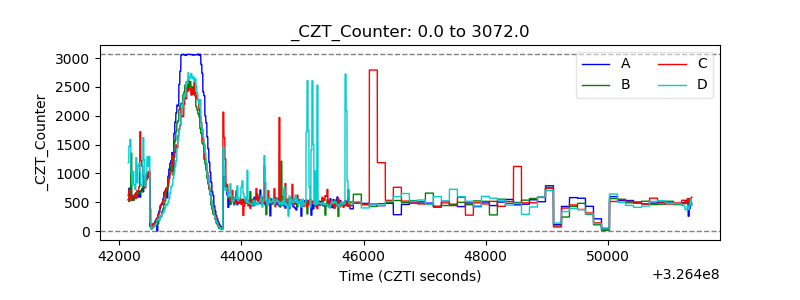 |
| +2.5 Volts monitor |  |
| +5 Volts monitor | 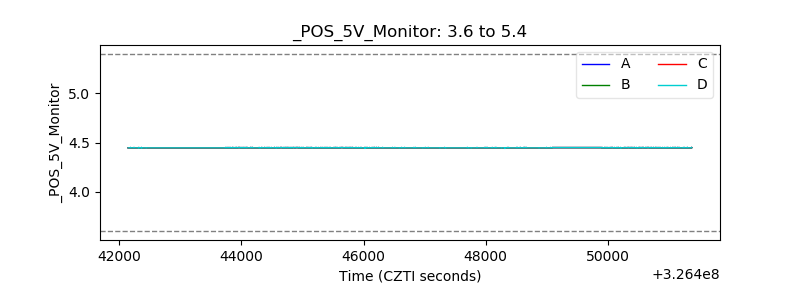 |
| _ROLL_ROT | 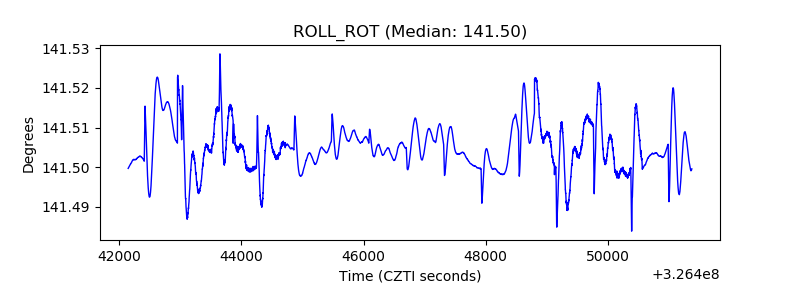 |
| _Roll_DEC | 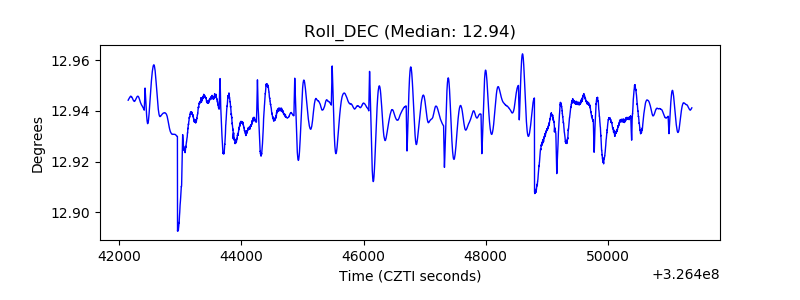 |
| _Roll_RA | 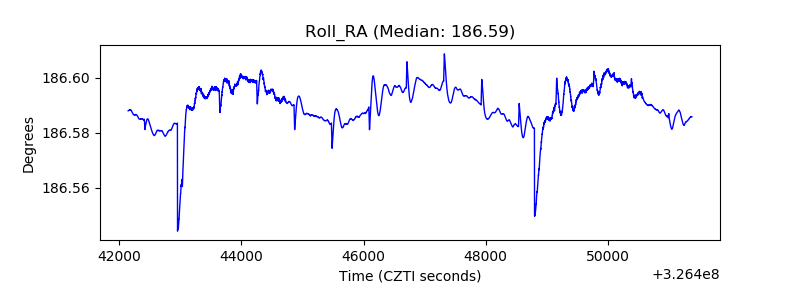 |
| Veto Counter | 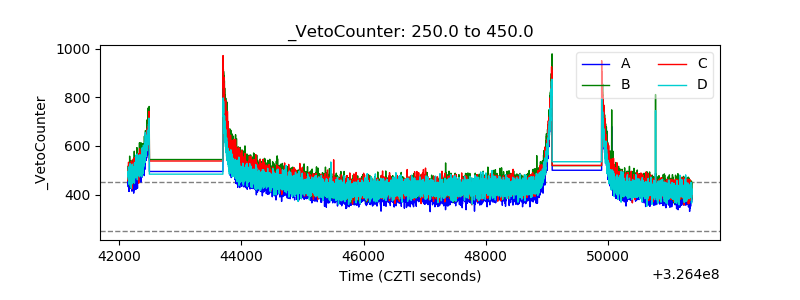 |