| Param | Original file | Final file |
|---|---|---|
| Filename | modeM0/AS1A08_003T13_9000003646_24900cztM0_level2.evt | modeM0/AS1A08_003T13_9000003646_24900cztM0_level2_quad_clean.evt |
| Size (bytes) | 578,234,880 | 92,471,040 |
| Size | 551.4 MB | 88.2 MB |
| Events in quadrant A | 4,075,000 | 573,537 |
| Events in quadrant B | 4,025,055 | 584,163 |
| Events in quadrant C | 4,051,110 | 553,217 |
| Events in quadrant D | 4,824,669 | 539,991 |
| Mode SS | |||
|---|---|---|---|
| Quadrant | BADHDUFLAG | Total packets | Discarded packets |
| A | 0 | 164 | 0 |
| B | 0 | 164 | 0 |
| C | 0 | 164 | 0 |
| D | 0 | 164 | 0 |
| Mode M0 | |||
|---|---|---|---|
| Quadrant | BADHDUFLAG | Total packets | Discarded packets |
| A | 0 | 16940 | 2 |
| B | 0 | 16674 | 2 |
| C | 0 | 16682 | 2 |
| D | 0 | 19194 | 3 |
| Mode M9 | |||
|---|---|---|---|
| Quadrant | BADHDUFLAG | Total packets | Discarded packets |
| A | 0 | 12 | 0 |
| B | 0 | 12 | 0 |
| C | 0 | 12 | 0 |
| D | 0 | 12 | 0 |
| Quadrant | Total seconds | Saturated seconds | Saturation percentage |
|---|---|---|---|
| A | 7901 | 276 | 3.493229% |
| B | 7902 | 267 | 3.378891% |
| C | 7902 | 261 | 3.302961% |
| D | 7901 | 363 | 4.594355% |
Noise dominated data is calculated using 1-second bins in cleaned event files. If a bin has >2000 counts, and if more than 50% of those come from <1% of pixels, then it is considered to be noise-dominated and hence unusable.
| Quadrant | # 1 sec bins | Bins with >0 counts | Bins with >2000 counts | High rate bins dominated by noise | Noise dominated (total time) | Noise dominated (detector-on time) | Marked lightcurve |
|---|---|---|---|---|---|---|---|
| A | 9126 | 7904 | 26 | 26 | 0.28% | 0.33% | 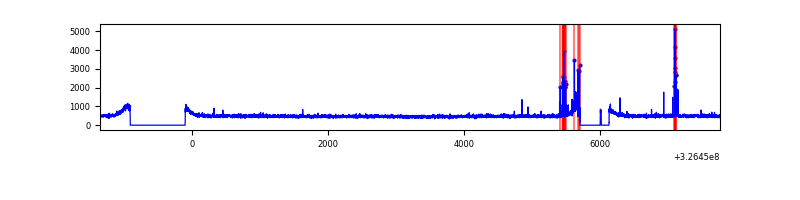 |
| B | 9127 | 7905 | 0 | 0 | 0.00% | 0.00% | 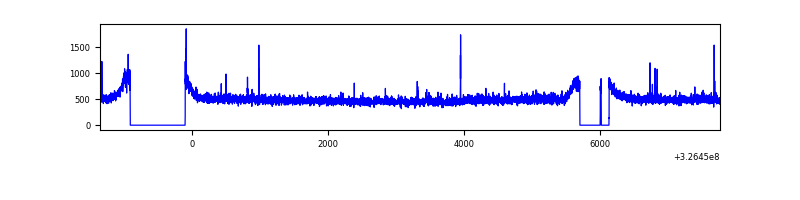 |
| C | 9127 | 7905 | 6 | 6 | 0.07% | 0.08% | 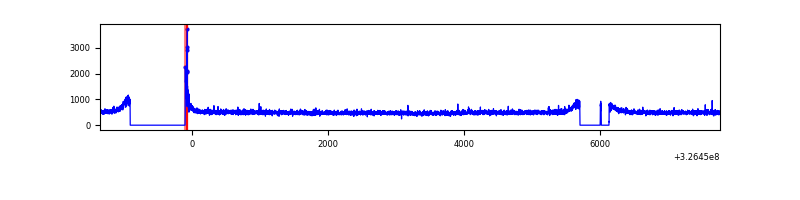 |
| D | 9126 | 7904 | 158 | 158 | 1.73% | 2.00% | 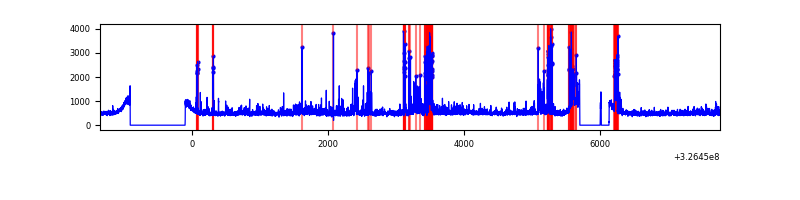 |
Top three noisy pixels from each quadrant. If the there are fewer than three noisy pixels in the level2.evt file, extra rows are filled as -1
| Pixel properties | Quadrant properties | ||||||
|---|---|---|---|---|---|---|---|
| Quadrant | DetID | PixID | Counts | Sigma | Mean | Median | Sigma |
| A | 6 | 16 | 159234 | 770.49 | 1014 | 991 | 205.4 |
| A | 13 | 254 | 11788 | 52.57 | 1014 | 991 | 205.4 |
| A | 3 | 137 | 9817 | 42.97 | 1014 | 991 | 205.4 |
| B | 7 | 202 | 26094 | 127.97 | 1009 | 983 | 196.2 |
| B | 12 | 111 | 24997 | 122.38 | 1009 | 983 | 196.2 |
| B | 11 | 111 | 22651 | 110.42 | 1009 | 983 | 196.2 |
| C | 14 | 238 | 152940 | 667.14 | 969 | 976 | 227.8 |
| C | 0 | 10 | 46384 | 199.35 | 969 | 976 | 227.8 |
| C | 7 | 247 | 36168 | 154.5 | 969 | 976 | 227.8 |
| D | 1 | 52 | 691318 | 2884.35 | 974 | 945 | 239.4 |
| D | 8 | 195 | 383021 | 1596.3 | 974 | 945 | 239.4 |
| D | 13 | 174 | 66592 | 274.27 | 974 | 945 | 239.4 |
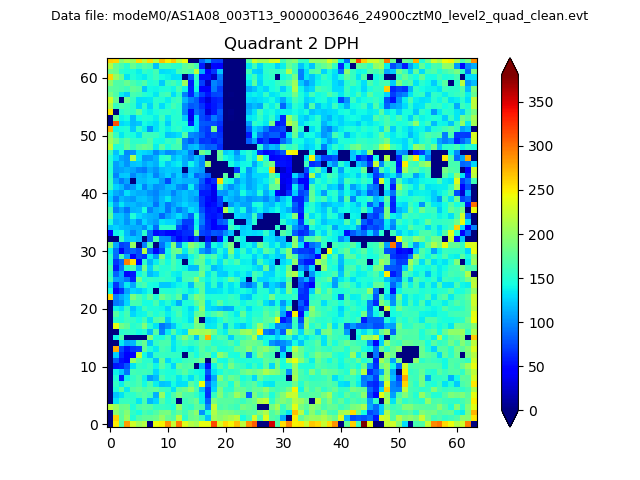
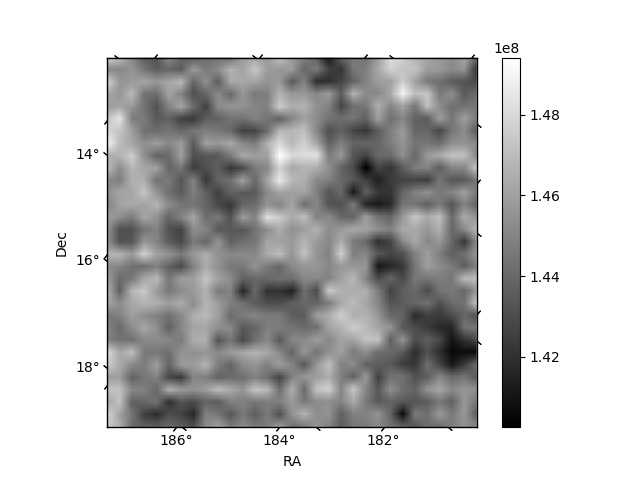
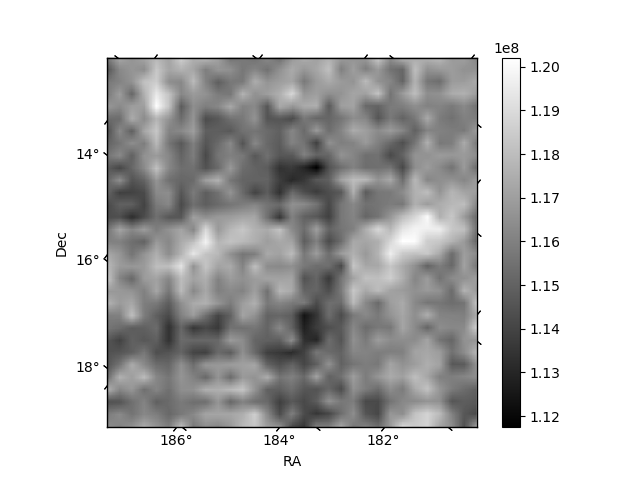
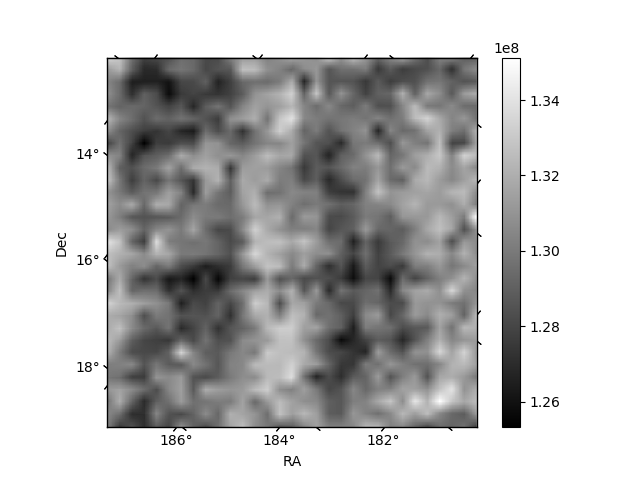
Histogram calculated using DETX and DETY for each event in the final _common_clean file
| Quadrant A | 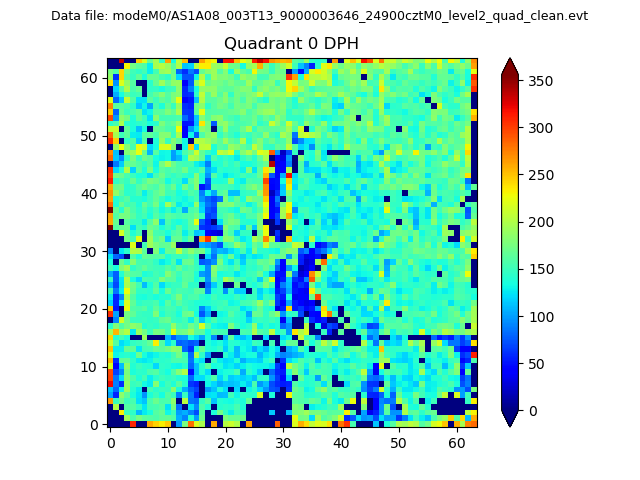 |
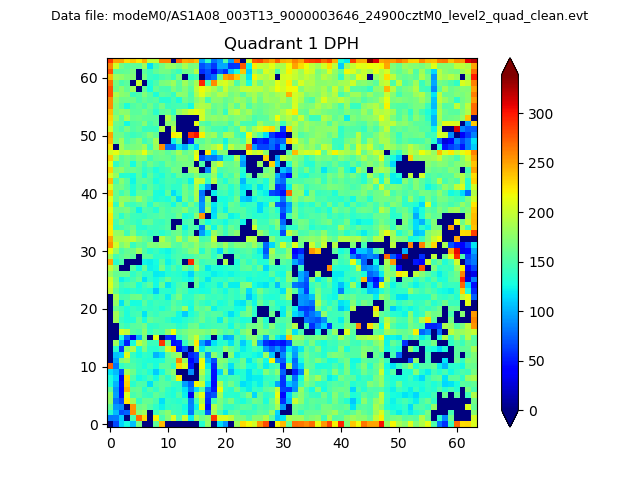 |
Quadrant B |
|---|---|---|---|
| Quadrant D | 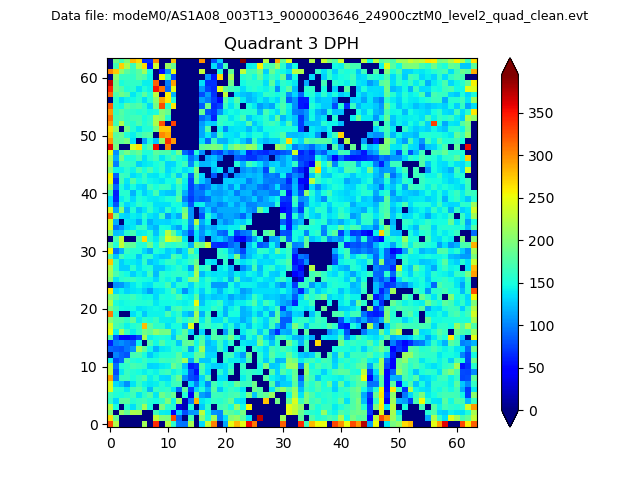 |
 |
Quadrant C |
| Plot type | Count rate plots | Images |
|---|---|---|
| Comparison with Poisson distribution Blue bars denote a histogram of data divided into 1 sec bins. Red curve is a Poisson curve with rate = median count rate of data. |
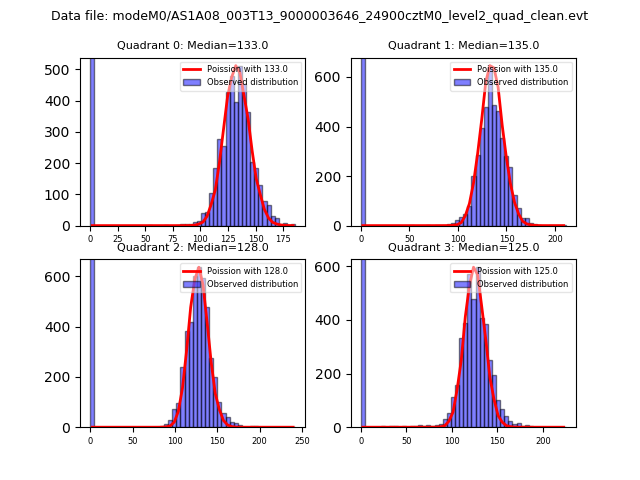 |
 |
| Quadrant-wise count rates Data is divided into 100 sec bins |
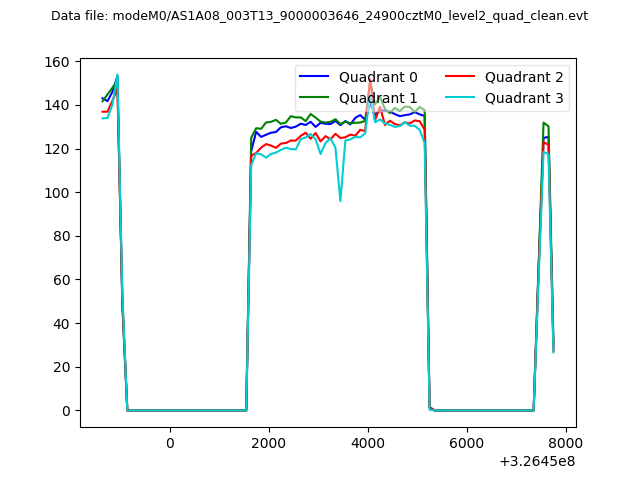 |
|
| Module-wise count rates for Quadrant A Data is divided into 100 sec bins |
 |
 |
| Module-wise count rates for Quadrant B Data is divided into 100 sec bins |
 |
 |
| Module-wise count rates for Quadrant C Data is divided into 100 sec bins |
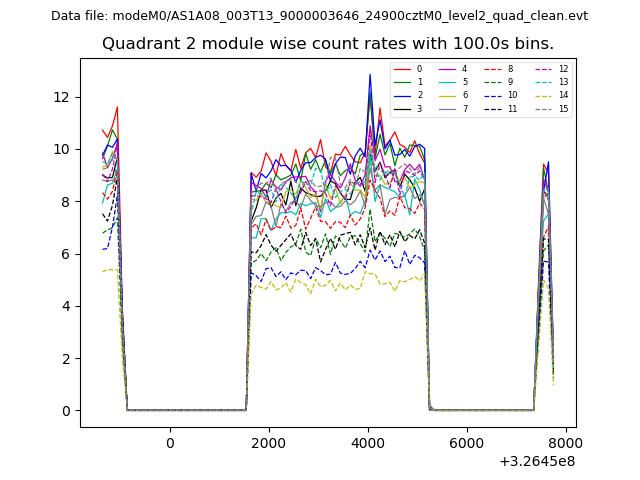 |
 |
| Module-wise count rates for Quadrant D Data is divided into 100 sec bins |
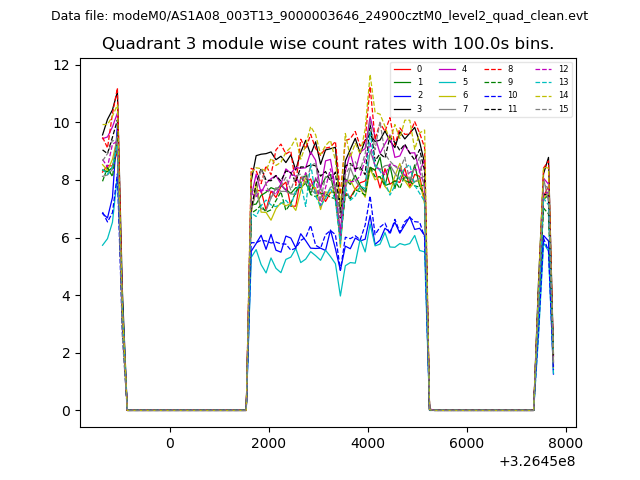 |
 |
| Parameter | Plot |
|---|---|
| CZT HV Monitor | 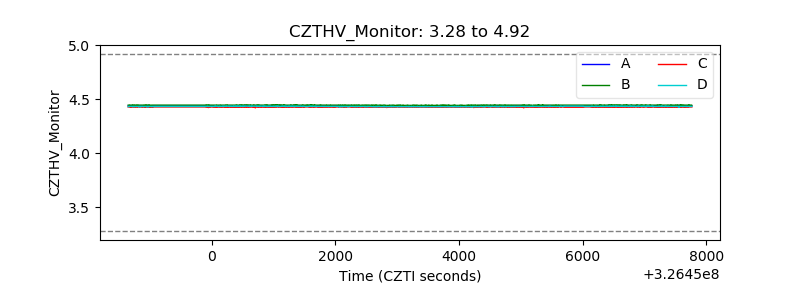 |
| D_VDD | 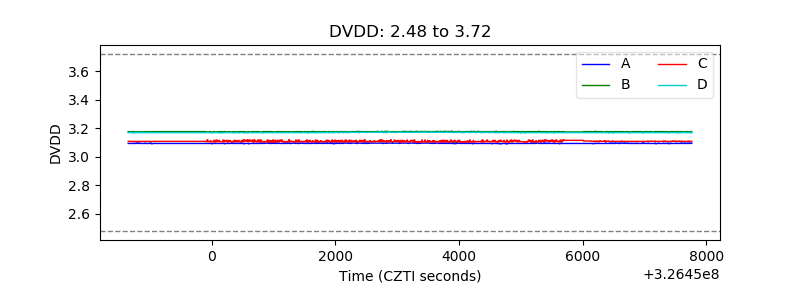 |
| Temperature 1 | 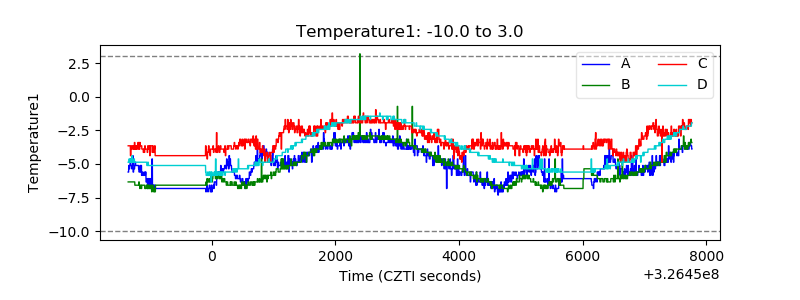 |
| Veto HV Monitor | 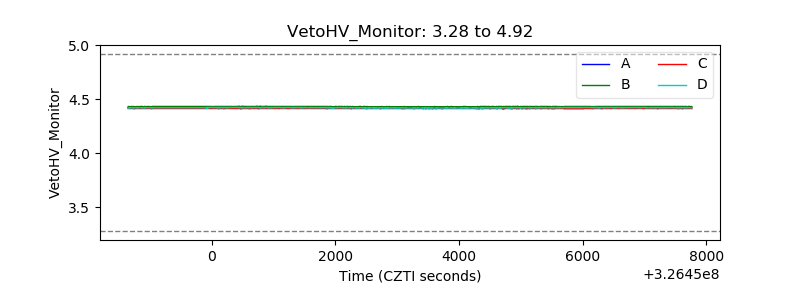 |
| Veto LLD | 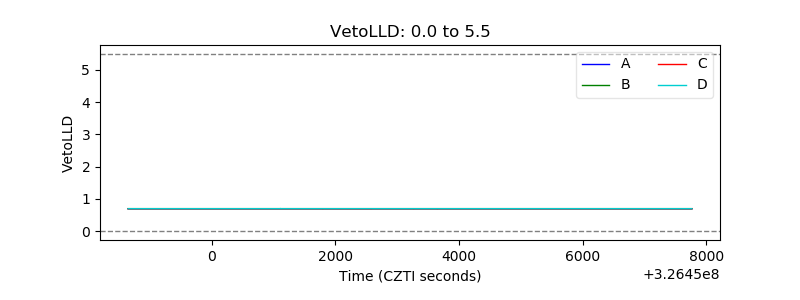 |
| Alpha Counter | 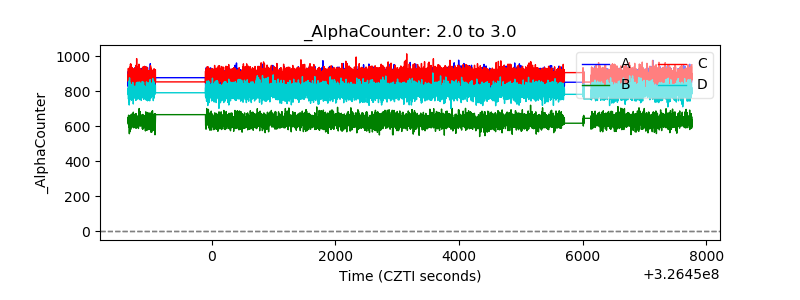 |
| _CPM_Rate | 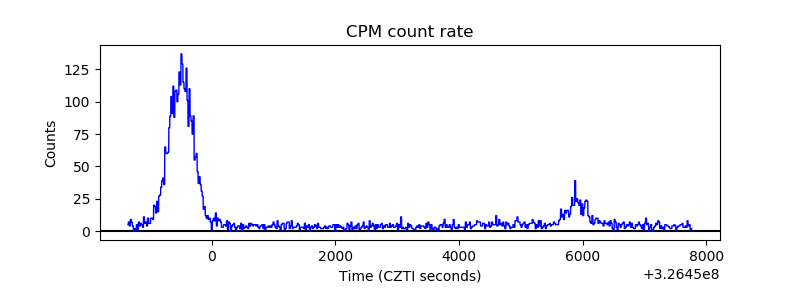 |
| CZT Counter | 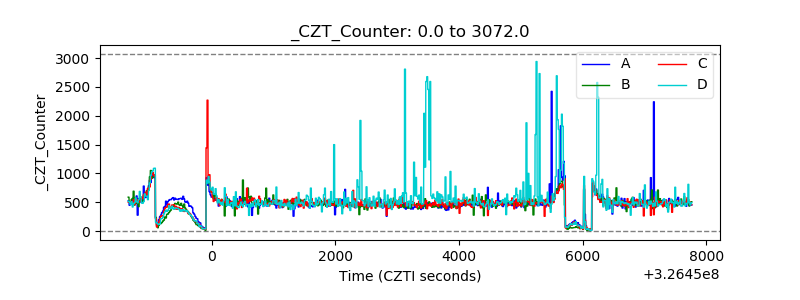 |
| +2.5 Volts monitor |  |
| +5 Volts monitor | 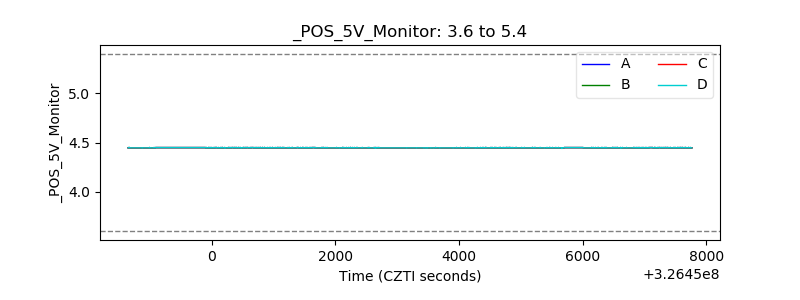 |
| _ROLL_ROT | 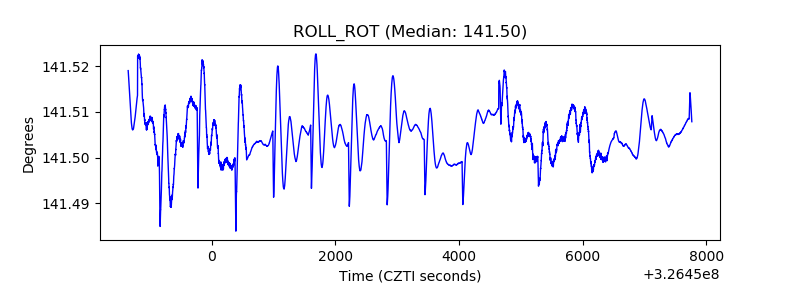 |
| _Roll_DEC | 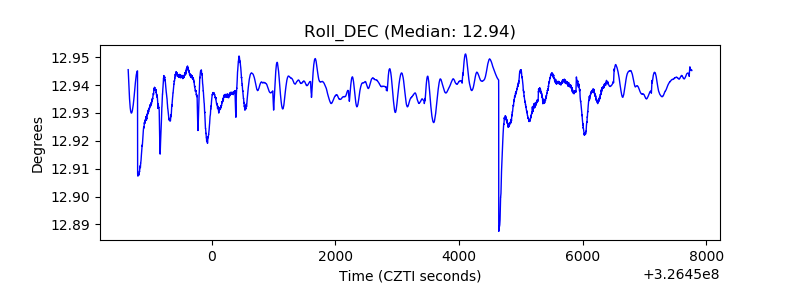 |
| _Roll_RA | 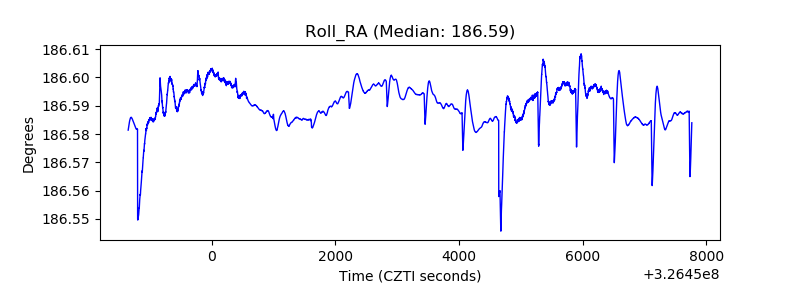 |
| Veto Counter | 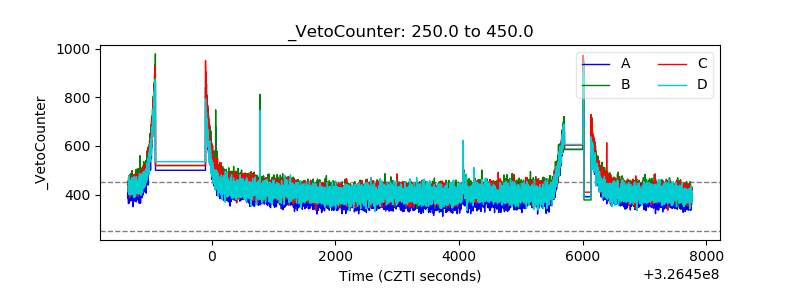 |