| Param | Original file | Final file |
|---|---|---|
| Filename | modeM0/AS1A08_003T13_9000003646_24901cztM0_level2.evt | modeM0/AS1A08_003T13_9000003646_24901cztM0_level2_quad_clean.evt |
| Size (bytes) | 696,150,720 | 87,120,000 |
| Size | 663.9 MB | 83.1 MB |
| Events in quadrant A | 4,781,899 | 549,586 |
| Events in quadrant B | 4,180,750 | 564,626 |
| Events in quadrant C | 4,130,806 | 531,717 |
| Events in quadrant D | 7,435,176 | 423,567 |
| Mode SS | |||
|---|---|---|---|
| Quadrant | BADHDUFLAG | Total packets | Discarded packets |
| A | 0 | 170 | 0 |
| B | 0 | 170 | 0 |
| C | 0 | 170 | 0 |
| D | 0 | 170 | 0 |
| Mode M0 | |||
|---|---|---|---|
| Quadrant | BADHDUFLAG | Total packets | Discarded packets |
| A | 0 | 19336 | 2 |
| B | 0 | 17445 | 2 |
| C | 0 | 17227 | 2 |
| D | 0 | 27213 | 2 |
| Mode M9 | |||
|---|---|---|---|
| Quadrant | BADHDUFLAG | Total packets | Discarded packets |
| A | 0 | 5 | 0 |
| B | 0 | 5 | 0 |
| C | 0 | 5 | 0 |
| D | 0 | 5 | 0 |
| Quadrant | Total seconds | Saturated seconds | Saturation percentage |
|---|---|---|---|
| A | 8172 | 558 | 6.828194% |
| B | 8172 | 395 | 4.833578% |
| C | 8172 | 346 | 4.233970% |
| D | 8173 | 1541 | 18.854766% |
Noise dominated data is calculated using 1-second bins in cleaned event files. If a bin has >2000 counts, and if more than 50% of those come from <1% of pixels, then it is considered to be noise-dominated and hence unusable.
| Quadrant | # 1 sec bins | Bins with >0 counts | Bins with >2000 counts | High rate bins dominated by noise | Noise dominated (total time) | Noise dominated (detector-on time) | Marked lightcurve |
|---|---|---|---|---|---|---|---|
| A | 8657 | 8175 | 173 | 173 | 2.00% | 2.12% | 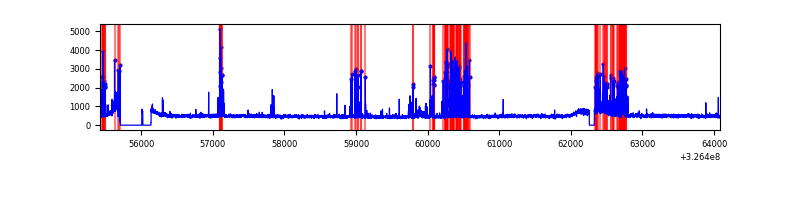 |
| B | 8657 | 8175 | 6 | 6 | 0.07% | 0.07% | 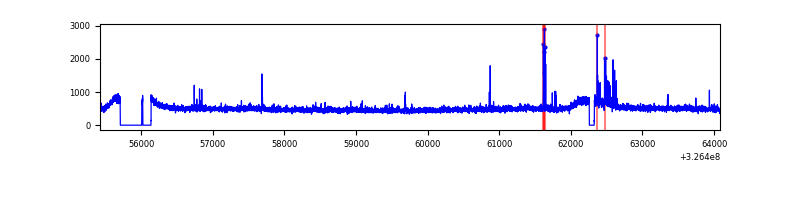 |
| C | 8657 | 8175 | 3 | 3 | 0.03% | 0.04% | 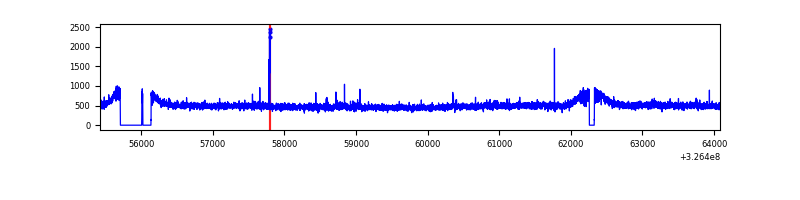 |
| D | 8658 | 8176 | 1253 | 1253 | 14.47% | 15.33% | 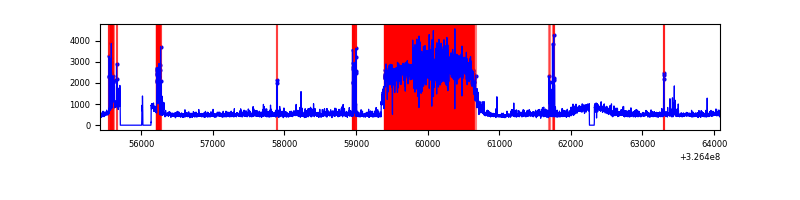 |
Top three noisy pixels from each quadrant. If the there are fewer than three noisy pixels in the level2.evt file, extra rows are filled as -1
| Pixel properties | Quadrant properties | ||||||
|---|---|---|---|---|---|---|---|
| Quadrant | DetID | PixID | Counts | Sigma | Mean | Median | Sigma |
| A | 6 | 16 | 814103 | 3890.79 | 1025 | 1002 | 209.0 |
| A | 13 | 254 | 11862 | 51.97 | 1025 | 1002 | 209.0 |
| A | 4 | 2 | 11602 | 50.72 | 1025 | 1002 | 209.0 |
| B | 4 | 80 | 74765 | 368.32 | 1032 | 1006 | 200.3 |
| B | 12 | 111 | 25608 | 122.85 | 1032 | 1006 | 200.3 |
| B | 7 | 202 | 24744 | 118.54 | 1032 | 1006 | 200.3 |
| C | 14 | 238 | 157573 | 670.29 | 994 | 997 | 233.6 |
| C | 4 | 175 | 43594 | 182.35 | 994 | 997 | 233.6 |
| C | 2 | 16 | 31417 | 130.23 | 994 | 997 | 233.6 |
| D | 7 | 238 | 3115036 | 13764.38 | 926 | 895 | 226.2 |
| D | 1 | 52 | 462822 | 2041.7 | 926 | 895 | 226.2 |
| D | 8 | 195 | 345145 | 1521.57 | 926 | 895 | 226.2 |
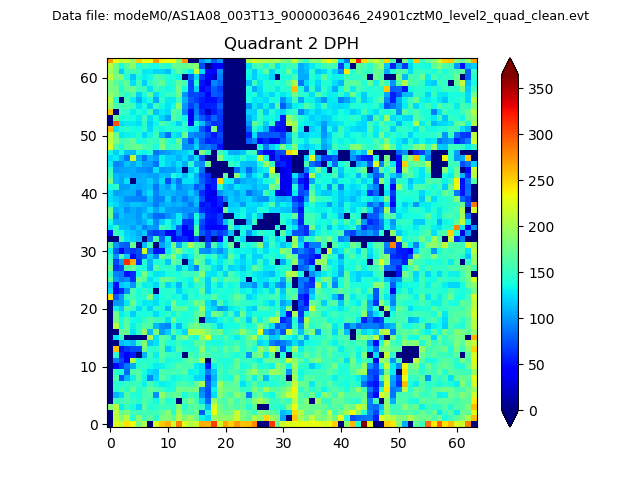
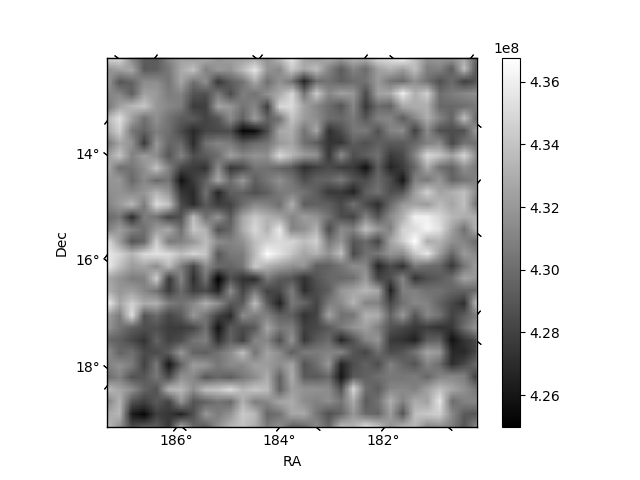
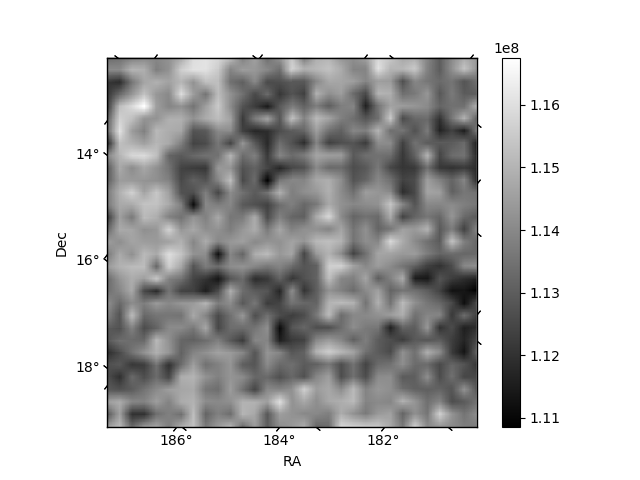
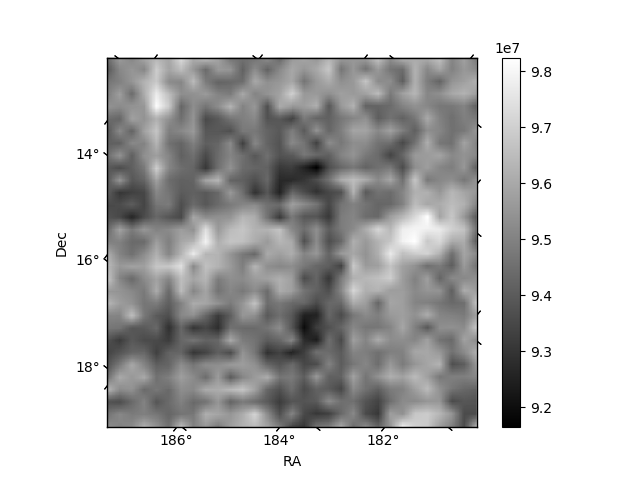
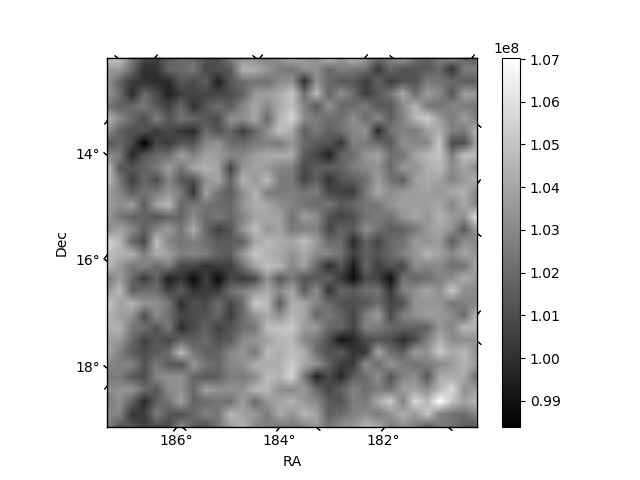
Histogram calculated using DETX and DETY for each event in the final _common_clean file
| Quadrant A | 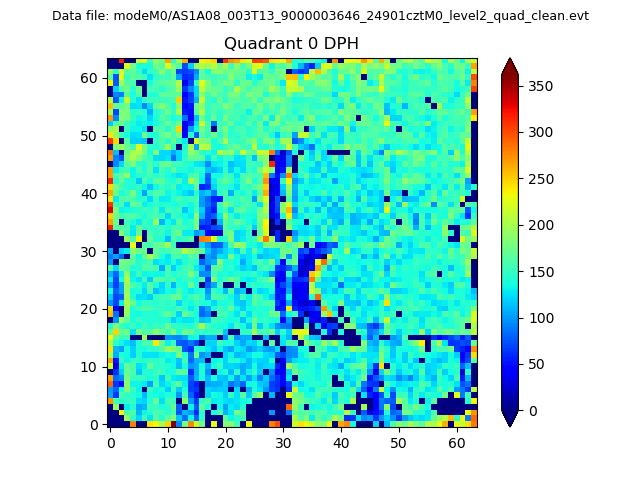 |
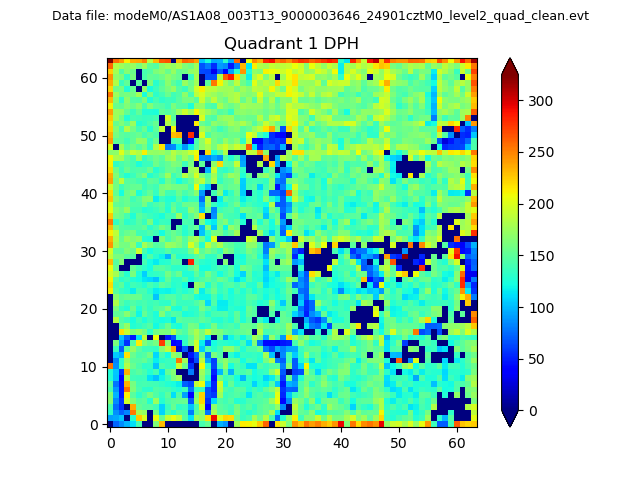 |
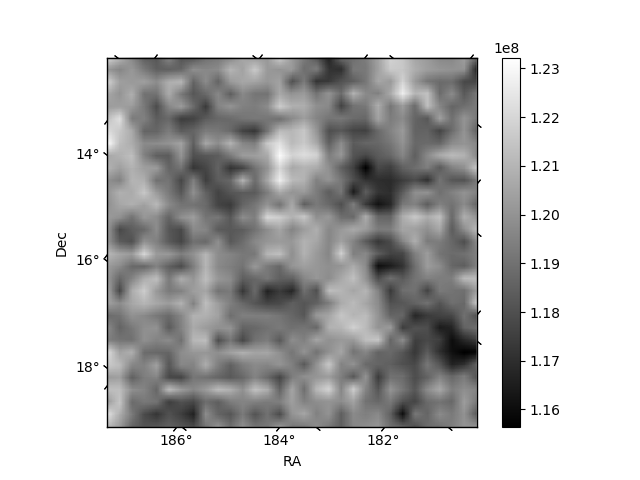
Quadrant B |
|---|---|---|---|
| Quadrant D | 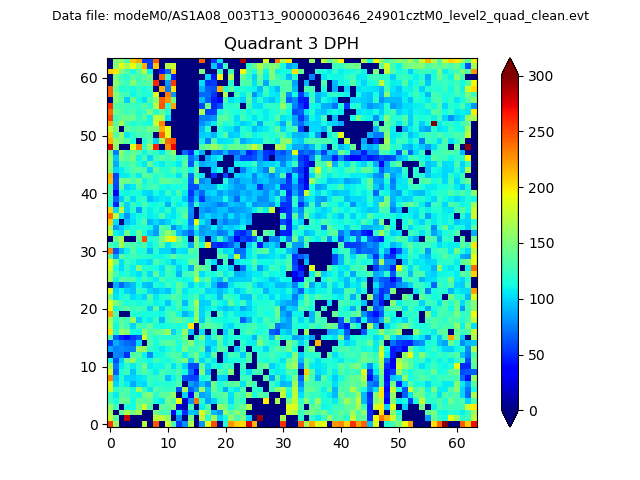 |
 |
Quadrant C |
| Plot type | Count rate plots | Images |
|---|---|---|
| Comparison with Poisson distribution Blue bars denote a histogram of data divided into 1 sec bins. Red curve is a Poisson curve with rate = median count rate of data. |
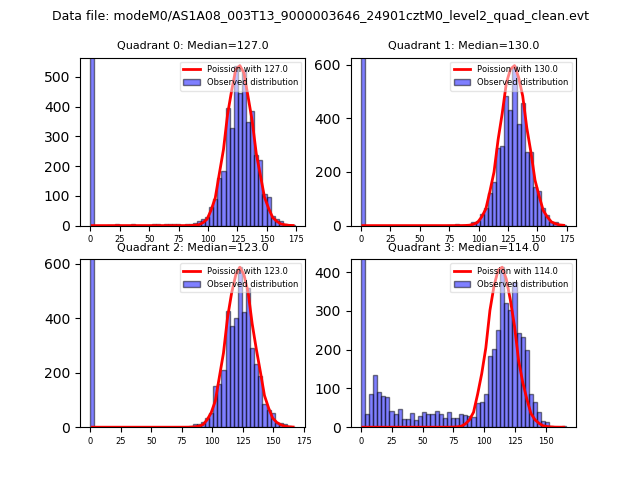 |
 |
| Quadrant-wise count rates Data is divided into 100 sec bins |
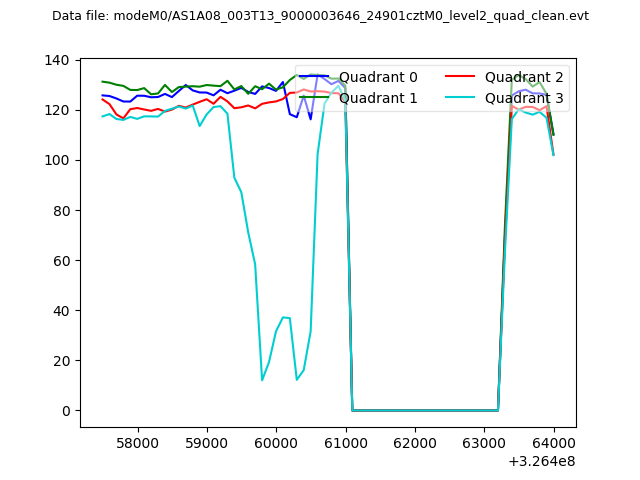 |
|
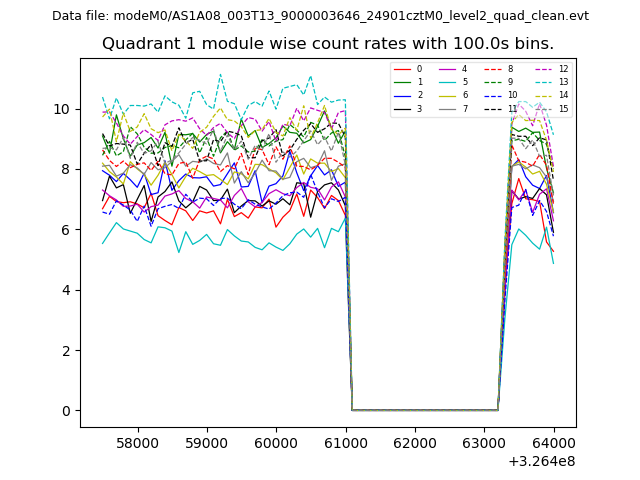
| Module-wise count rates for Quadrant A Data is divided into 100 sec bins |
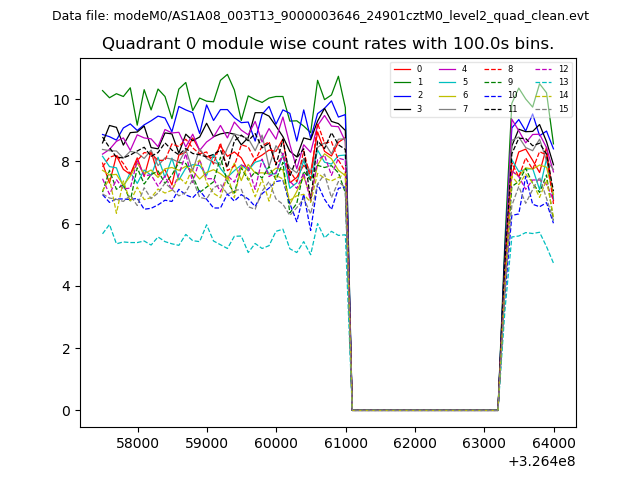 |
 |
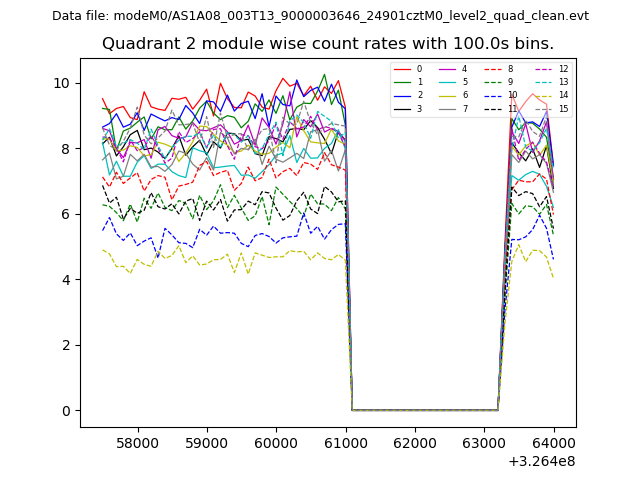
| Module-wise count rates for Quadrant B Data is divided into 100 sec bins |
 |
 |
| Module-wise count rates for Quadrant C Data is divided into 100 sec bins |
 |
 |
| Module-wise count rates for Quadrant D Data is divided into 100 sec bins |
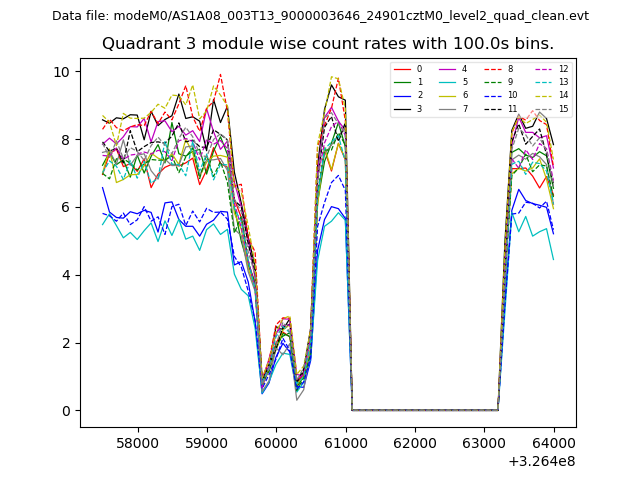 |
 |
| Parameter | Plot |
|---|---|
| CZT HV Monitor | 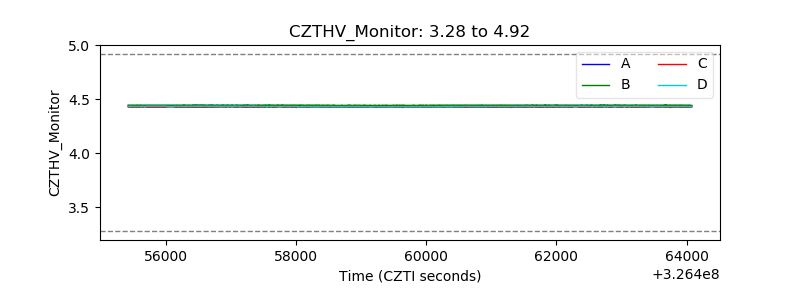 |
| D_VDD | 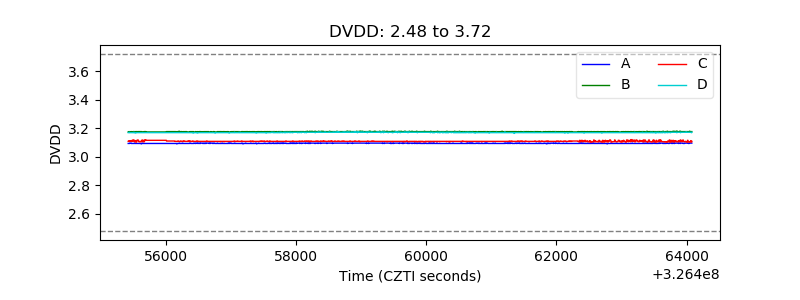 |
| Temperature 1 | 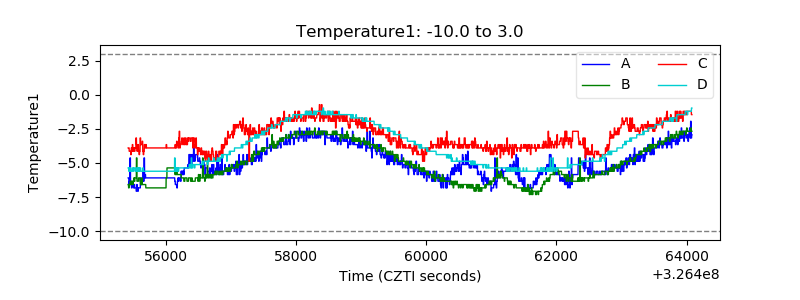 |
| Veto HV Monitor | 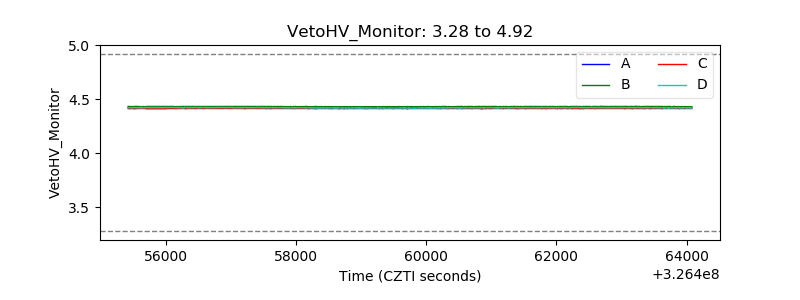 |
| Veto LLD | 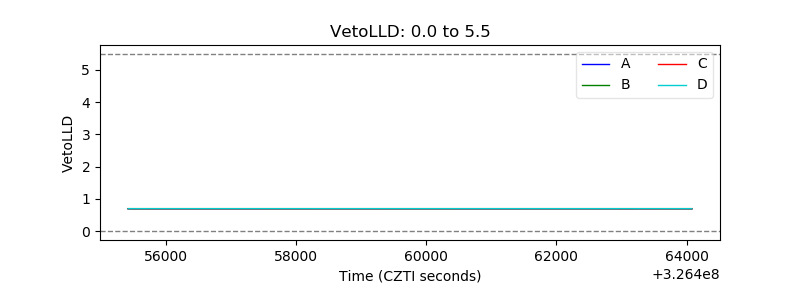 |
| Alpha Counter | 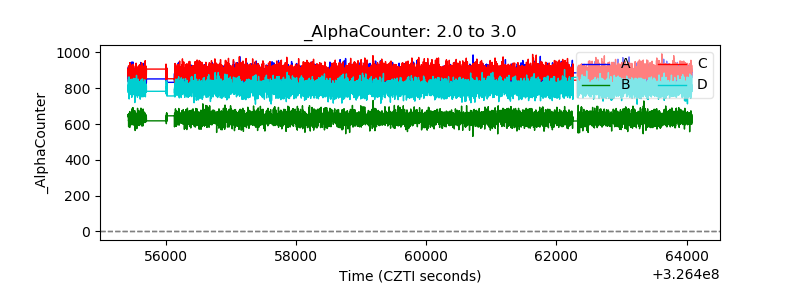 |
| _CPM_Rate | 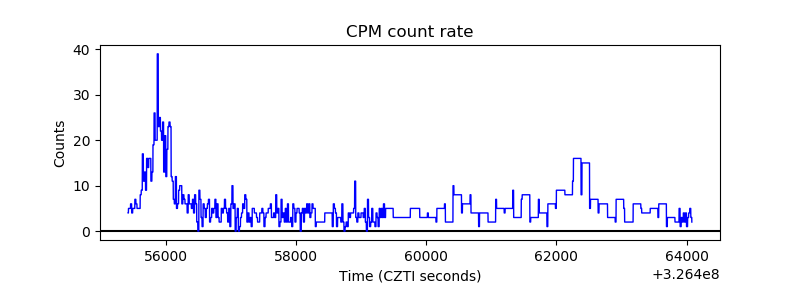 |
| CZT Counter | 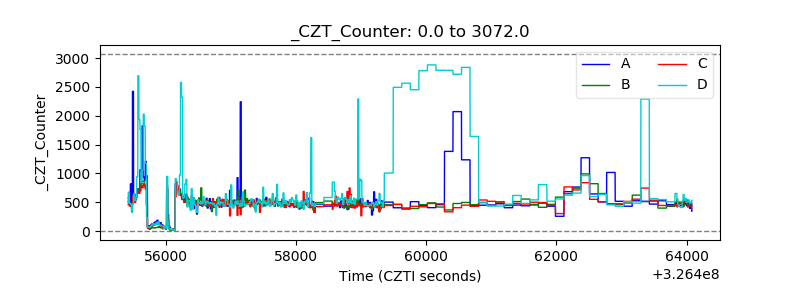 |
| +2.5 Volts monitor | 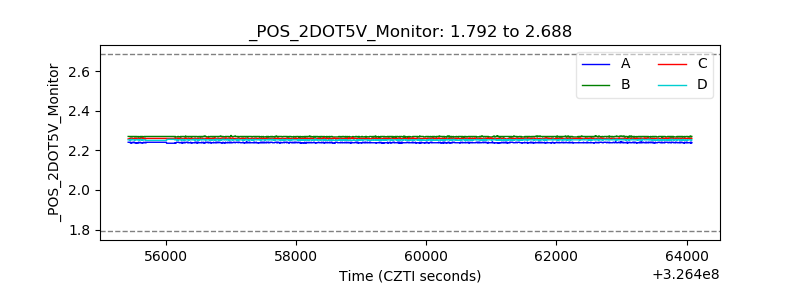 |
| +5 Volts monitor |  |
| _ROLL_ROT | 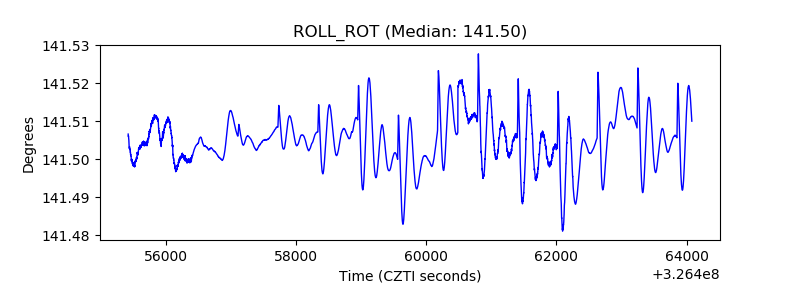 |
| _Roll_DEC | 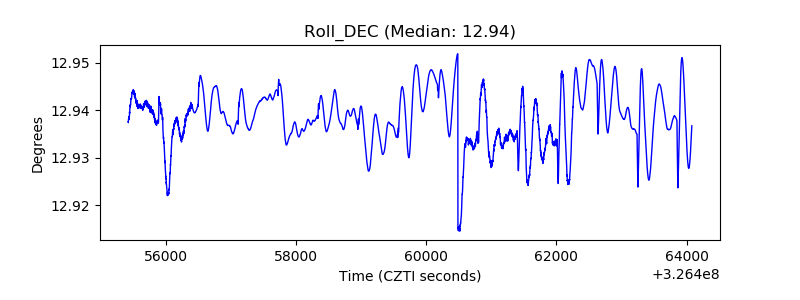 |
| _Roll_RA | 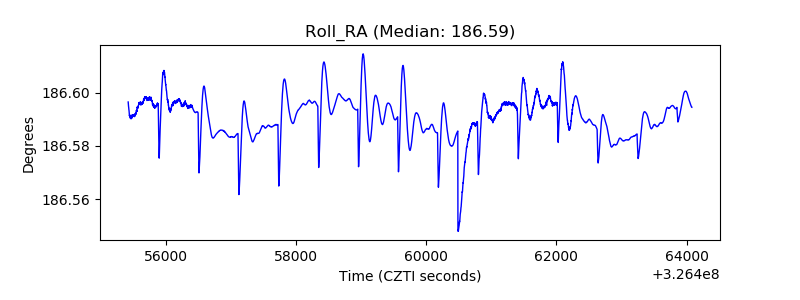 |
| Veto Counter | 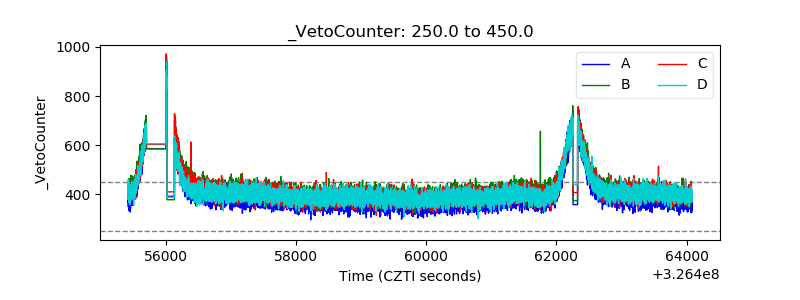 |