| Param | Original file | Final file |
|---|---|---|
| Filename | modeM0/AS1A08_003T13_9000003646_24902cztM0_level2.evt | modeM0/AS1A08_003T13_9000003646_24902cztM0_level2_quad_clean.evt |
| Size (bytes) | 222,344,640 | 62,726,400 |
| Size | 212.0 MB | 59.8 MB |
| Events in quadrant A | 1,565,501 | 422,822 |
| Events in quadrant B | 1,594,599 | 427,605 |
| Events in quadrant C | 1,603,166 | 403,048 |
| Events in quadrant D | 1,731,668 | 399,193 |
| Mode SS | |||
|---|---|---|---|
| Quadrant | BADHDUFLAG | Total packets | Discarded packets |
| A | 0 | 70 | 0 |
| B | 0 | 70 | 0 |
| C | 0 | 70 | 0 |
| D | 0 | 70 | 0 |
| Mode M0 | |||
|---|---|---|---|
| Quadrant | BADHDUFLAG | Total packets | Discarded packets |
| A | 0 | 6987 | 0 |
| B | 0 | 7016 | 0 |
| C | 0 | 7018 | 0 |
| D | 0 | 7319 | 0 |
| Quadrant | Total seconds | Saturated seconds | Saturation percentage |
|---|---|---|---|
| A | 3480 | 3 | 0.086207% |
| B | 3481 | 3 | 0.086182% |
| C | 3481 | 8 | 0.229819% |
| D | 3481 | 5 | 0.143637% |
Noise dominated data is calculated using 1-second bins in cleaned event files. If a bin has >2000 counts, and if more than 50% of those come from <1% of pixels, then it is considered to be noise-dominated and hence unusable.
| Quadrant | # 1 sec bins | Bins with >0 counts | Bins with >2000 counts | High rate bins dominated by noise | Noise dominated (total time) | Noise dominated (detector-on time) | Marked lightcurve |
|---|---|---|---|---|---|---|---|
| A | 3480 | 3480 | 0 | 0 | 0.00% | 0.00% | 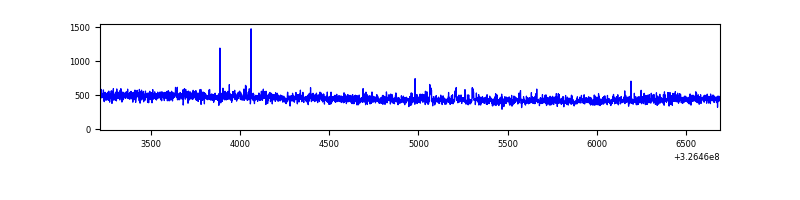 |
| B | 3481 | 3481 | 0 | 0 | 0.00% | 0.00% | 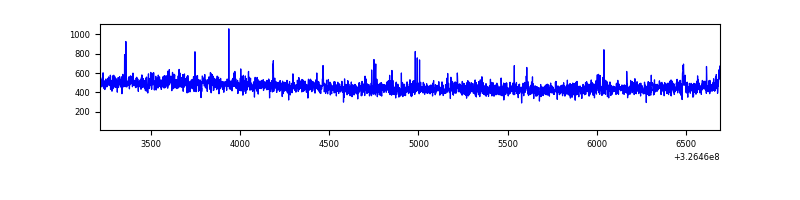 |
| C | 3481 | 3481 | 0 | 0 | 0.00% | 0.00% | 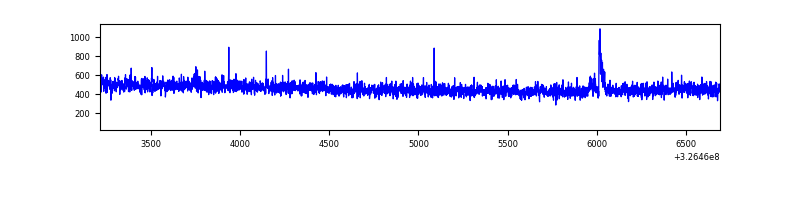 |
| D | 3481 | 3481 | 5 | 5 | 0.14% | 0.14% | 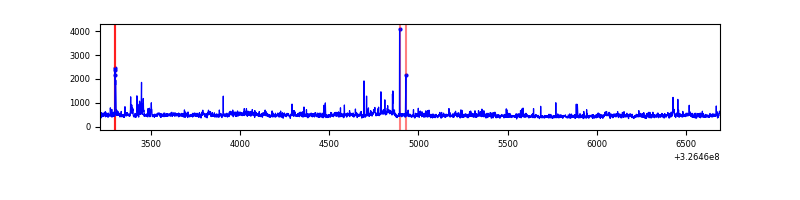 |
Top three noisy pixels from each quadrant. If the there are fewer than three noisy pixels in the level2.evt file, extra rows are filled as -1
| Pixel properties | Quadrant properties | ||||||
|---|---|---|---|---|---|---|---|
| Quadrant | DetID | PixID | Counts | Sigma | Mean | Median | Sigma |
| A | 11 | 208 | 6801 | 76.45 | 402 | 394 | 83.8 |
| A | 13 | 254 | 5458 | 60.42 | 402 | 394 | 83.8 |
| A | 6 | 16 | 4283 | 46.4 | 402 | 394 | 83.8 |
| B | 7 | 202 | 14757 | 184.39 | 397 | 386 | 77.9 |
| B | 12 | 111 | 9143 | 112.36 | 397 | 386 | 77.9 |
| B | 11 | 111 | 8344 | 102.11 | 397 | 386 | 77.9 |
| C | 14 | 238 | 62395 | 671.08 | 385 | 387 | 92.4 |
| C | 7 | 247 | 14948 | 157.59 | 385 | 387 | 92.4 |
| C | 4 | 175 | 9785 | 101.71 | 385 | 387 | 92.4 |
| D | 8 | 195 | 129898 | 1345.46 | 393 | 381 | 96.3 |
| D | 1 | 52 | 84696 | 875.89 | 393 | 381 | 96.3 |
| D | 7 | 238 | 21947 | 224.03 | 393 | 381 | 96.3 |
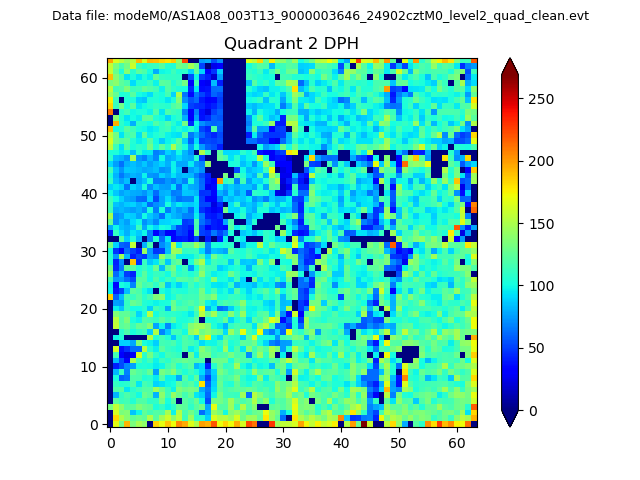
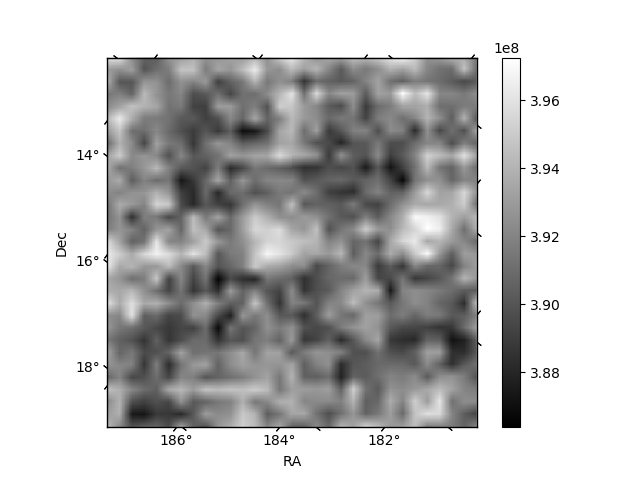
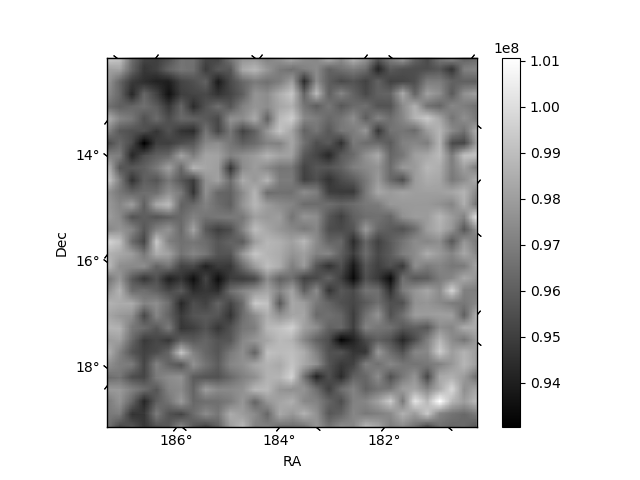
Histogram calculated using DETX and DETY for each event in the final _common_clean file
| Quadrant A | 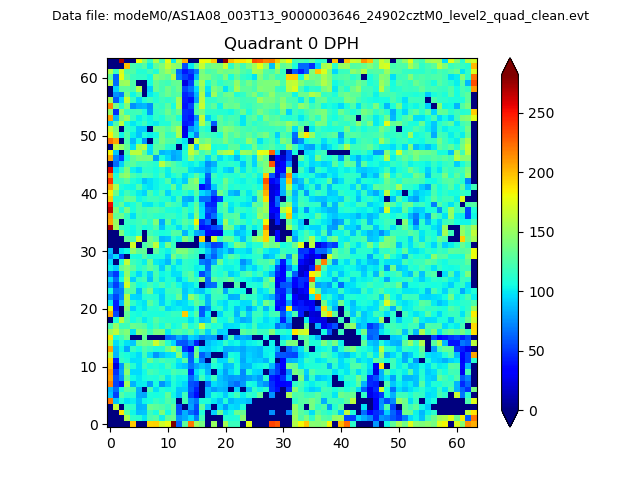 |
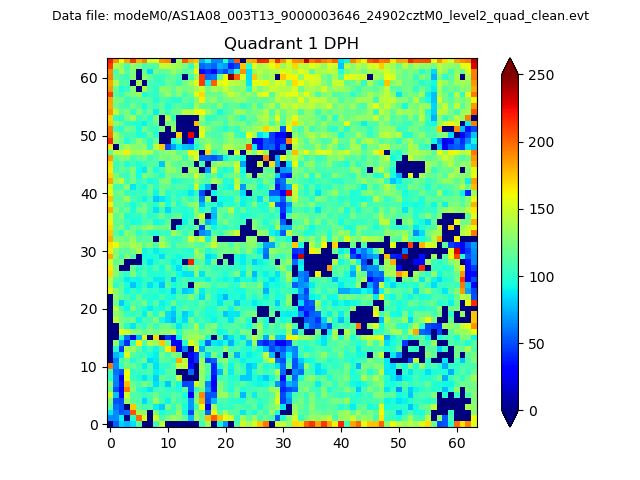 |
Quadrant B |
|---|---|---|---|
| Quadrant D | 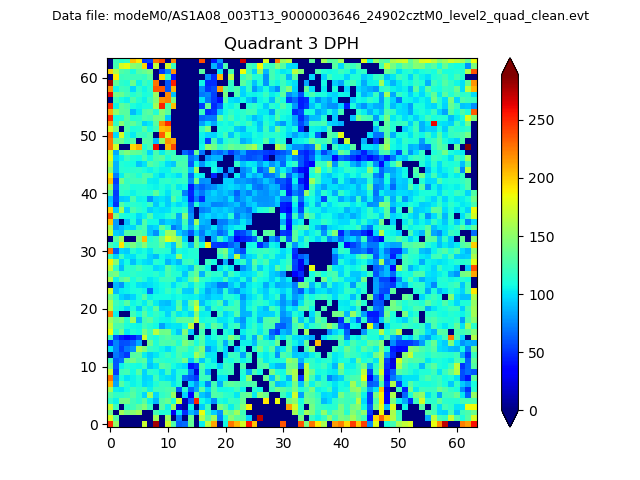 |
 |
Quadrant C |
| Plot type | Count rate plots | Images |
|---|---|---|
| Comparison with Poisson distribution Blue bars denote a histogram of data divided into 1 sec bins. Red curve is a Poisson curve with rate = median count rate of data. |
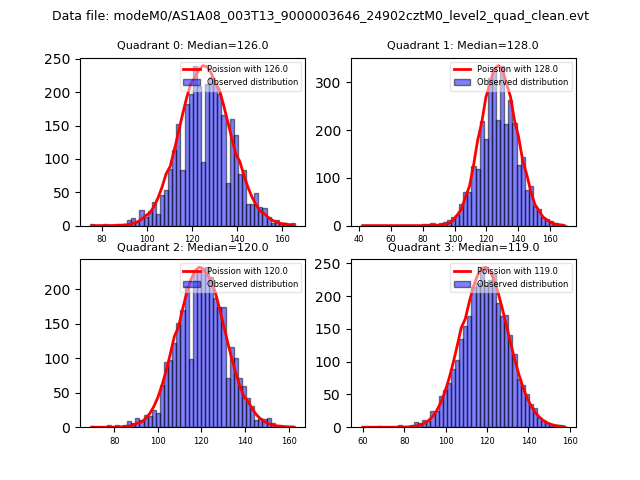 |
 |
| Quadrant-wise count rates Data is divided into 100 sec bins |
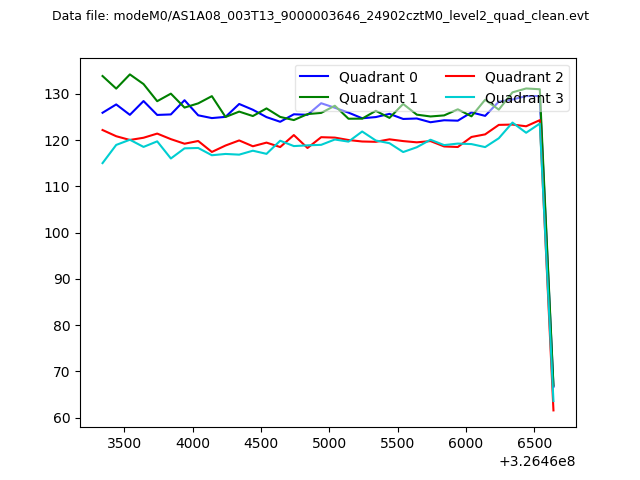 |
|
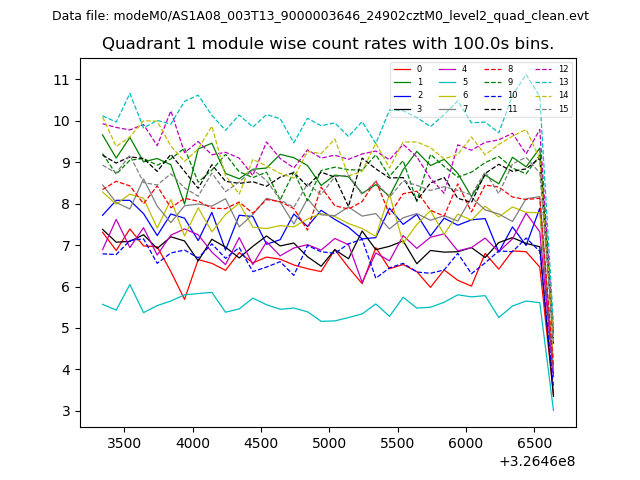
| Module-wise count rates for Quadrant A Data is divided into 100 sec bins |
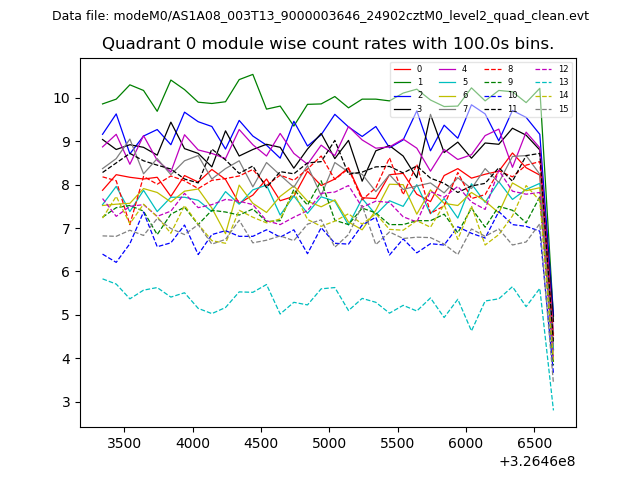 |
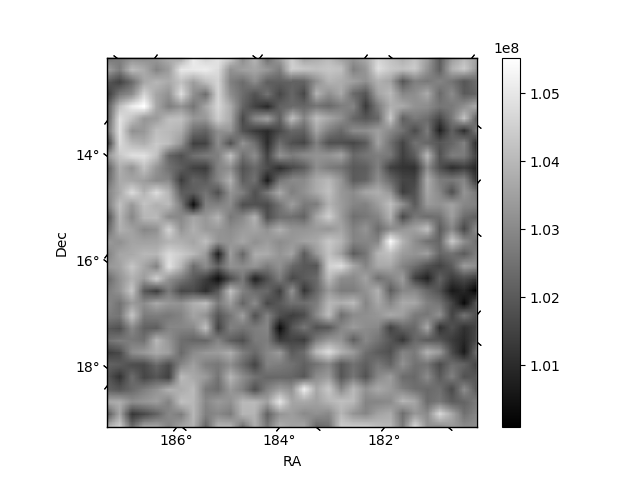 |
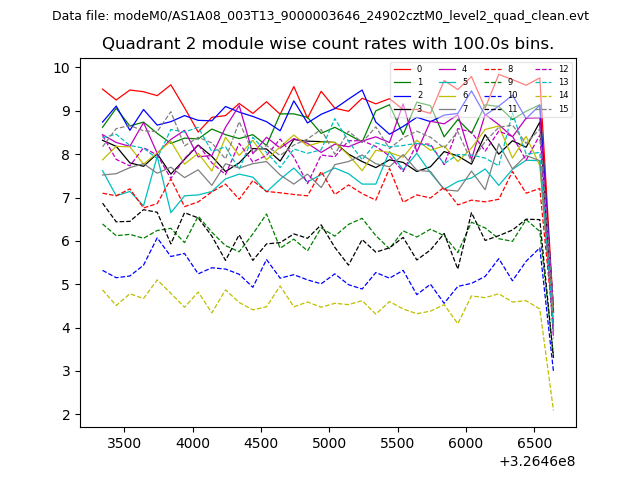
| Module-wise count rates for Quadrant B Data is divided into 100 sec bins |
 |
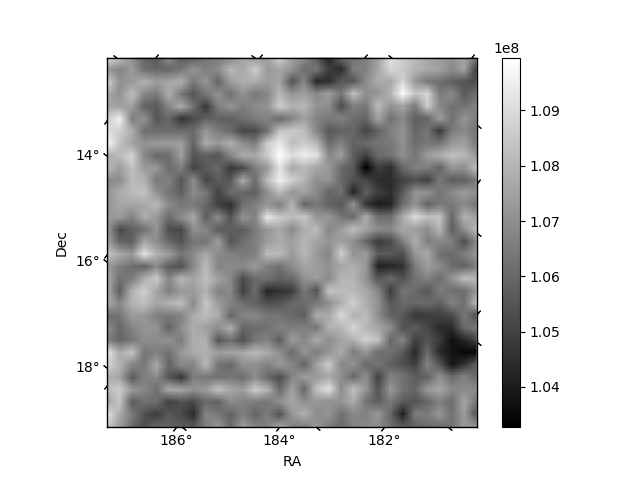 |
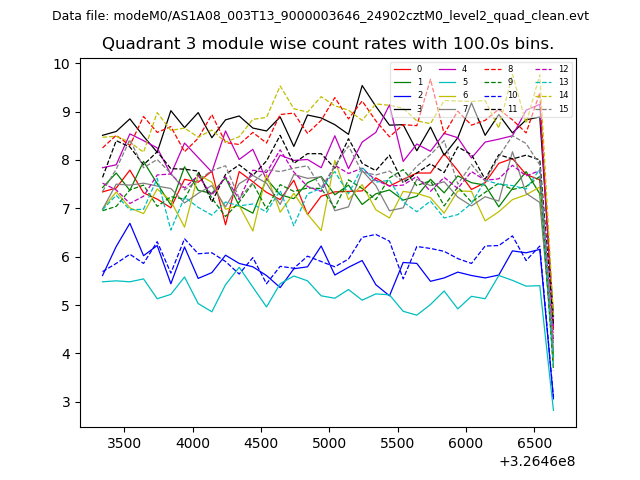
| Module-wise count rates for Quadrant C Data is divided into 100 sec bins |
 |
 |
| Module-wise count rates for Quadrant D Data is divided into 100 sec bins |
 |
 |
| Parameter | Plot |
|---|---|
| CZT HV Monitor | 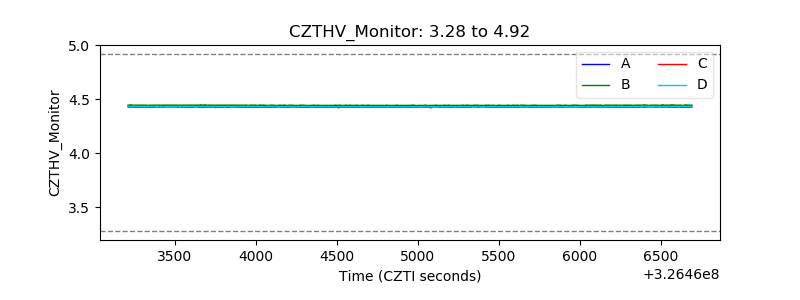 |
| D_VDD | 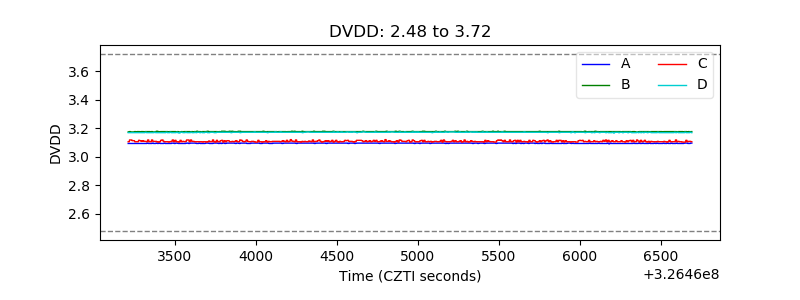 |
| Temperature 1 |  |
| Veto HV Monitor | 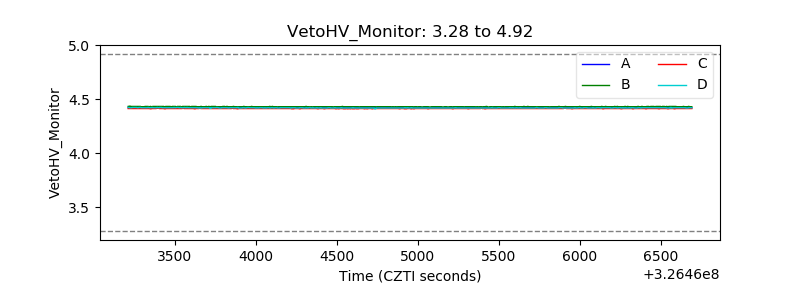 |
| Veto LLD | 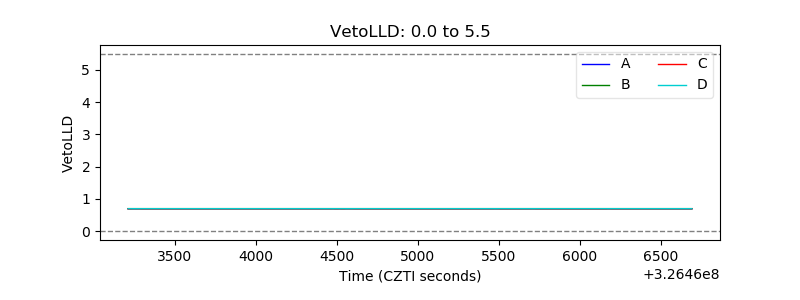 |
| Alpha Counter | 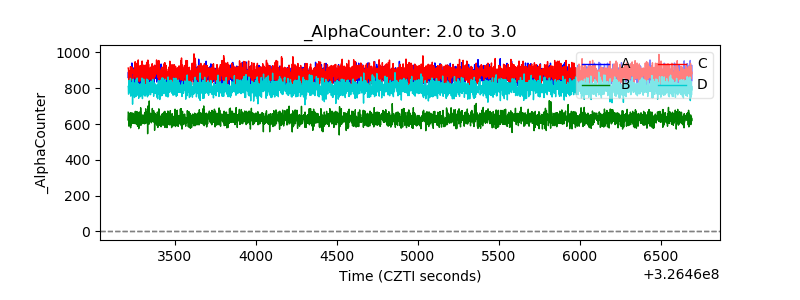 |
| _CPM_Rate | 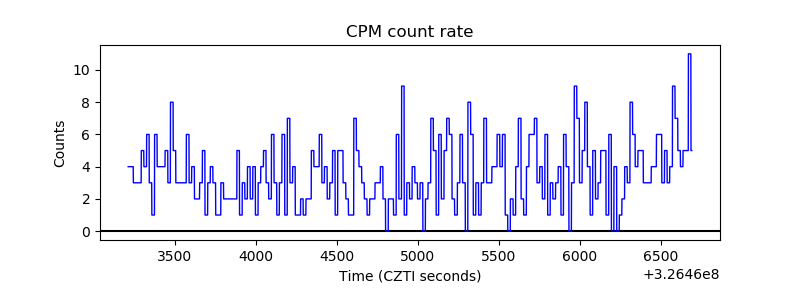 |
| CZT Counter | 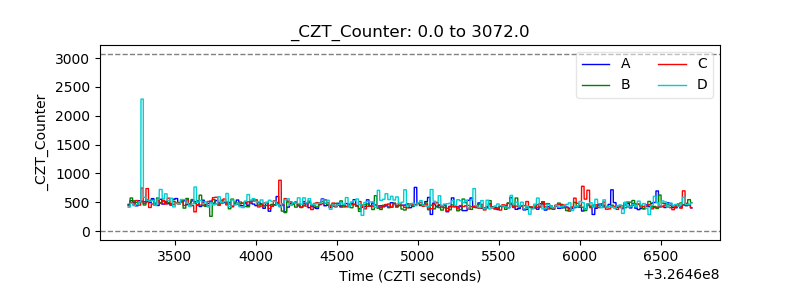 |
| +2.5 Volts monitor |  |
| +5 Volts monitor |  |
| _ROLL_ROT | 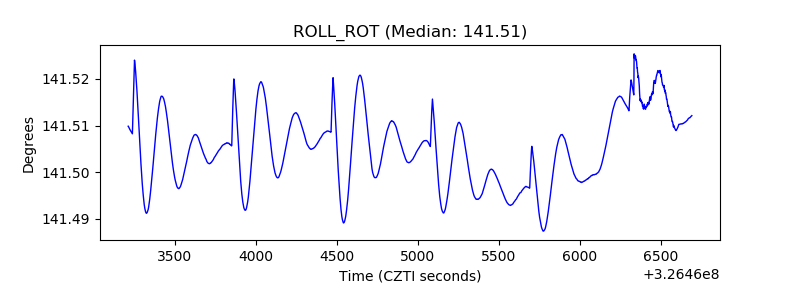 |
| _Roll_DEC |  |
| _Roll_RA | 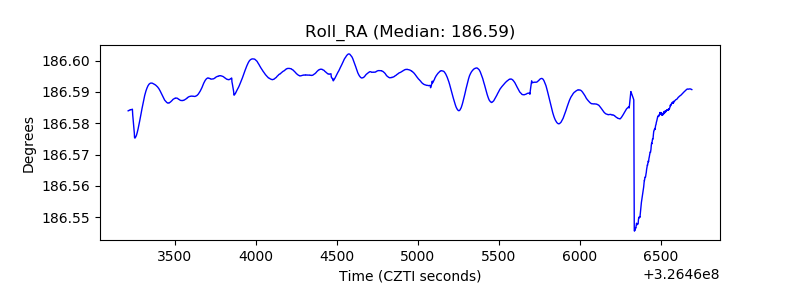 |
| Veto Counter | 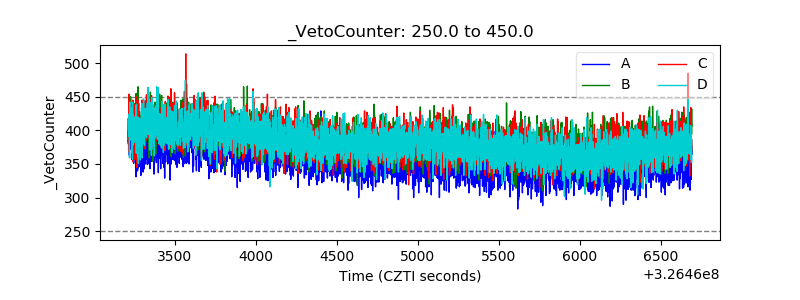 |