| Param | Original file | Final file |
|---|---|---|
| Filename | modeM0/AS1A08_003T15_9000003648cztM0_level2.fits | modeM0/AS1A08_003T15_9000003648cztM0_level2_quad_clean.evt |
| Size (bytes) | 291,231,360 | 249,223,680 |
| Size | 277.7 MB | 237.7 MB |
| Events in quadrant A | 1,781,954 | 1,435,385 |
| Events in quadrant B | 1,717,582 | 1,442,569 |
| Events in quadrant C | 1,735,360 | 1,355,089 |
| Events in quadrant D | 1,516,882 | 1,245,686 |
| Mode M0 | |||
|---|---|---|---|
| Quadrant | BADHDUFLAG | Total packets | Discarded packets |
| A | 0 | 63409 | 0 |
| B | 0 | 62971 | 0 |
| C | 0 | 63533 | 0 |
| D | 0 | 74169 | 0 |
| Mode SS | |||
|---|---|---|---|
| Quadrant | BADHDUFLAG | Total packets | Discarded packets |
| A | 0 | 618 | 0 |
| B | 0 | 618 | 0 |
| C | 0 | 618 | 0 |
| D | 0 | 618 | 0 |
| Mode M9 | |||
|---|---|---|---|
| Quadrant | BADHDUFLAG | Total packets | Discarded packets |
| A | 0 | 43 | 0 |
| B | 0 | 43 | 0 |
| C | 0 | 43 | 0 |
| D | 0 | 43 | 0 |
| Quadrant | Total seconds | Saturated seconds | Saturation percentage |
|---|---|---|---|
| A | 30080 | 513 | 1.705452% |
| B | 30080 | 453 | 1.505984% |
| C | 30080 | 617 | 2.051197% |
| D | 30080 | 622 | 2.067819% |
Noise dominated data is calculated using 1-second bins in cleaned event files. If a bin has >2000 counts, and if more than 50% of those come from <1% of pixels, then it is considered to be noise-dominated and hence unusable.
| Quadrant | # 1 sec bins | Bins with >0 counts | Bins with >2000 counts | High rate bins dominated by noise | Noise dominated (total time) | Noise dominated (detector-on time) | Marked lightcurve |
|---|---|---|---|---|---|---|---|
| A | 34435 | 30080 | 0 | 0 | 0.00% | 0.00% |  |
| B | 34435 | 30080 | 0 | 0 | 0.00% | 0.00% |  |
| C | 34435 | 30080 | 0 | 0 | 0.00% | 0.00% |  |
| D | 34435 | 30080 | 0 | 0 | 0.00% | 0.00% |  |
Top three noisy pixels from each quadrant. If the there are fewer than three noisy pixels in the level2.evt file, extra rows are filled as -1
| Pixel properties | Quadrant properties | ||||||
|---|---|---|---|---|---|---|---|
| Quadrant | DetID | PixID | Counts | Sigma | Mean | Median | Sigma |
| A | 0 | 29 | 1740 | 11.2 | 463 | 433 | 116.7 |
| A | 7 | 110 | 1430 | 8.55 | 463 | 433 | 116.7 |
| A | 0 | 30 | 1349 | 7.85 | 463 | 433 | 116.7 |
| B | 2 | 9 | 1468 | 11.34 | 453 | 431 | 91.4 |
| B | 2 | 8 | 1225 | 8.68 | 453 | 431 | 91.4 |
| B | 5 | 225 | 1119 | 7.52 | 453 | 431 | 91.4 |
| C | 1 | 80 | 1334 | 7.65 | 457 | 426 | 118.8 |
| C | 1 | 81 | 1318 | 7.51 | 457 | 426 | 118.8 |
| C | 3 | 126 | 1222 | 6.7 | 457 | 426 | 118.8 |
| D | 7 | 5 | 1103 | 6.1 | 432 | 392 | 116.5 |
| D | 13 | 238 | 1098 | 6.06 | 432 | 392 | 116.5 |
| D | 3 | 159 | 1050 | 5.65 | 432 | 392 | 116.5 |
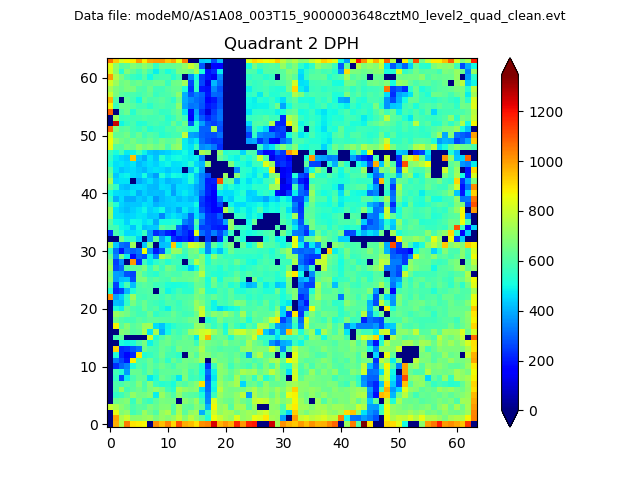
Histogram calculated using DETX and DETY for each event in the final _common_clean file
| Quadrant A | 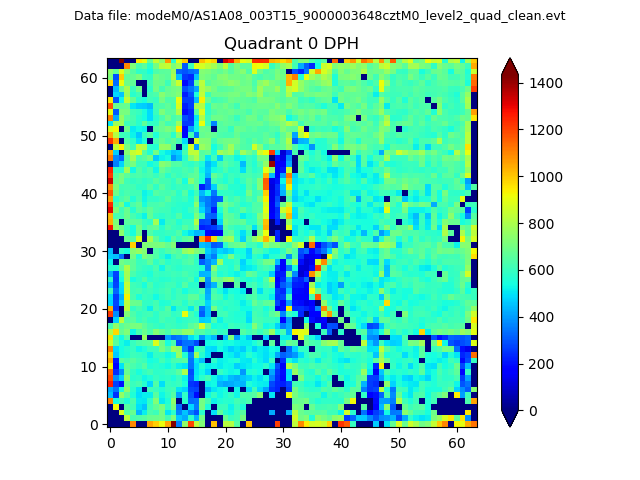 |
 |
Quadrant B |
|---|---|---|---|
| Quadrant D |  |
 |
Quadrant C |
| Plot type | Count rate plots | Images |
|---|---|---|
| Comparison with Poisson distribution Blue bars denote a histogram of data divided into 1 sec bins. Red curve is a Poisson curve with rate = median count rate of data. |
 |
 |
| Quadrant-wise count rates Data is divided into 100 sec bins |
 |
|
| Module-wise count rates for Quadrant A Data is divided into 100 sec bins |
 |
 |
| Module-wise count rates for Quadrant B Data is divided into 100 sec bins |
 |
 |
| Module-wise count rates for Quadrant C Data is divided into 100 sec bins |
 |
 |
| Module-wise count rates for Quadrant D Data is divided into 100 sec bins |
 |
 |
| Parameter | Plot |
|---|---|
| CZT HV Monitor |  |
| D_VDD |  |
| Temperature 1 |  |
| Veto HV Monitor | 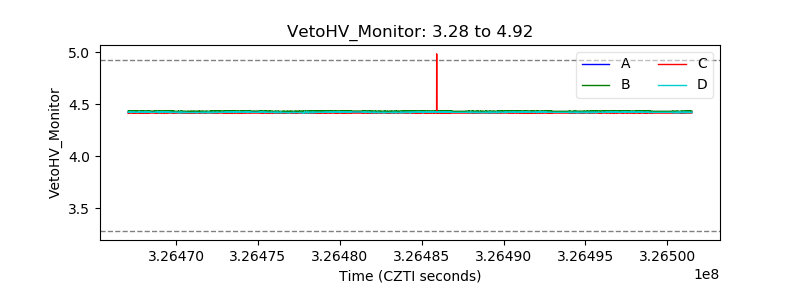 |
| Veto LLD |  |
| Alpha Counter |  |
| _CPM_Rate |  |
| CZT Counter |  |
| +2.5 Volts monitor |  |
| +5 Volts monitor |  |
| _ROLL_ROT |  |
| _Roll_DEC |  |
| _Roll_RA |  |
| Veto Counter |  |