| Param | Original file | Final file |
|---|---|---|
| Filename | modeM0/AS1A08_003T15_9000003648_24902cztM0_level2.evt | modeM0/AS1A08_003T15_9000003648_24902cztM0_level2_quad_clean.evt |
| Size (bytes) | 221,443,200 | 25,571,520 |
| Size | 211.2 MB | 24.4 MB |
| Events in quadrant A | 1,619,463 | 141,875 |
| Events in quadrant B | 1,607,983 | 145,738 |
| Events in quadrant C | 1,595,804 | 136,974 |
| Events in quadrant D | 1,674,913 | 133,039 |
| Mode M0 | |||
|---|---|---|---|
| Quadrant | BADHDUFLAG | Total packets | Discarded packets |
| A | 0 | 6591 | 1 |
| B | 0 | 6484 | 1 |
| C | 0 | 6475 | 1 |
| D | 0 | 6832 | 1 |
| Mode SS | |||
|---|---|---|---|
| Quadrant | BADHDUFLAG | Total packets | Discarded packets |
| A | 0 | 64 | 0 |
| B | 0 | 64 | 0 |
| C | 0 | 64 | 0 |
| D | 0 | 64 | 0 |
| Mode M9 | |||
|---|---|---|---|
| Quadrant | BADHDUFLAG | Total packets | Discarded packets |
| A | 0 | 3 | 0 |
| B | 0 | 3 | 0 |
| C | 0 | 3 | 0 |
| D | 0 | 3 | 0 |
| Quadrant | Total seconds | Saturated seconds | Saturation percentage |
|---|---|---|---|
| A | 3034 | 165 | 5.438365% |
| B | 3034 | 152 | 5.009888% |
| C | 3034 | 159 | 5.240606% |
| D | 3034 | 106 | 3.493738% |
Noise dominated data is calculated using 1-second bins in cleaned event files. If a bin has >2000 counts, and if more than 50% of those come from <1% of pixels, then it is considered to be noise-dominated and hence unusable.
| Quadrant | # 1 sec bins | Bins with >0 counts | Bins with >2000 counts | High rate bins dominated by noise | Noise dominated (total time) | Noise dominated (detector-on time) | Marked lightcurve |
|---|---|---|---|---|---|---|---|
| A | 3269 | 3036 | 14 | 14 | 0.43% | 0.46% | 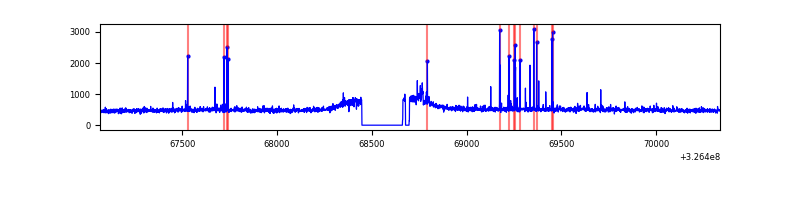 |
| B | 3269 | 3036 | 0 | 0 | 0.00% | 0.00% | 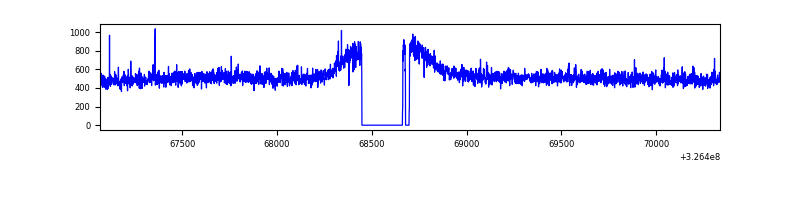 |
| C | 3269 | 3036 | 0 | 0 | 0.00% | 0.00% | 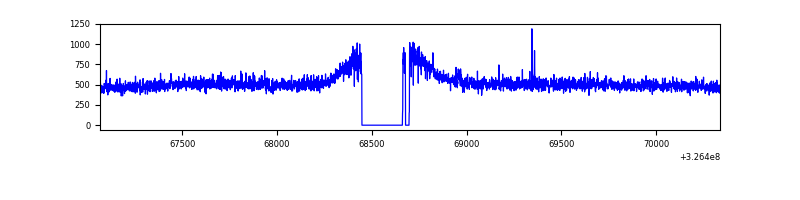 |
| D | 3269 | 3036 | 1 | 1 | 0.03% | 0.03% |  |
Top three noisy pixels from each quadrant. If the there are fewer than three noisy pixels in the level2.evt file, extra rows are filled as -1
| Pixel properties | Quadrant properties | ||||||
|---|---|---|---|---|---|---|---|
| Quadrant | DetID | PixID | Counts | Sigma | Mean | Median | Sigma |
| A | 6 | 16 | 58655 | 689.55 | 405 | 395 | 84.5 |
| A | 13 | 254 | 4648 | 50.34 | 405 | 395 | 84.5 |
| A | 3 | 137 | 3983 | 42.47 | 405 | 395 | 84.5 |
| B | 12 | 111 | 10299 | 123.49 | 403 | 392 | 80.2 |
| B | 11 | 111 | 9548 | 114.12 | 403 | 392 | 80.2 |
| B | 4 | 80 | 8589 | 102.17 | 403 | 392 | 80.2 |
| C | 14 | 238 | 60600 | 643.26 | 388 | 390 | 93.6 |
| C | 7 | 247 | 8485 | 86.48 | 388 | 390 | 93.6 |
| C | 2 | 16 | 4323 | 42.02 | 388 | 390 | 93.6 |
| D | 8 | 195 | 92915 | 946.13 | 395 | 382 | 97.8 |
| D | 1 | 52 | 43029 | 436.06 | 395 | 382 | 97.8 |
| D | 13 | 174 | 22720 | 228.4 | 395 | 382 | 97.8 |
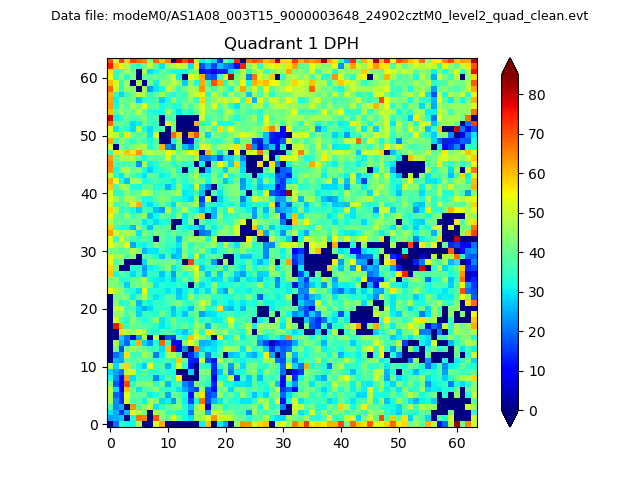
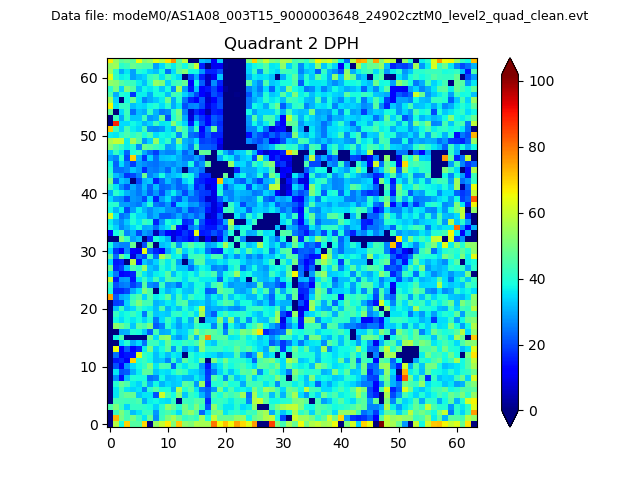
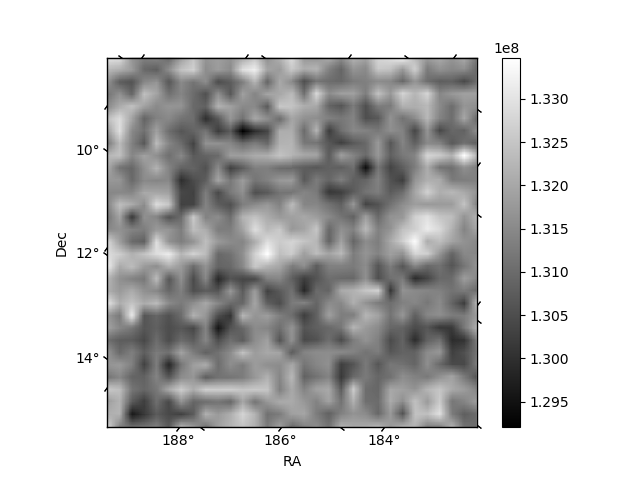
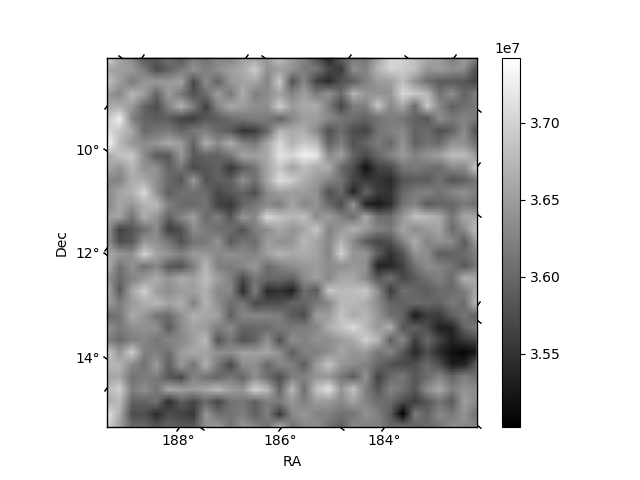
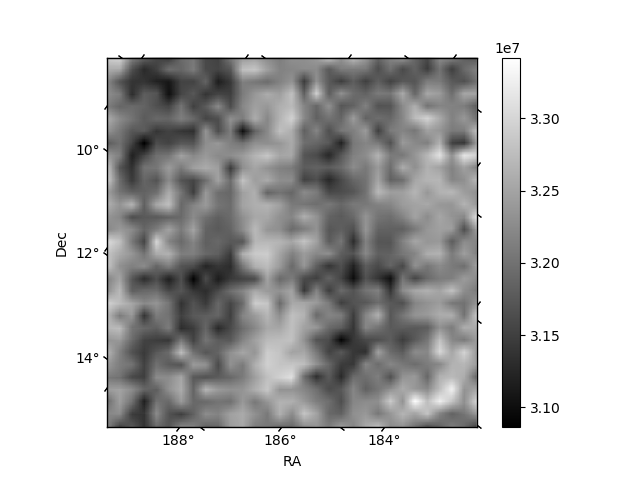
Histogram calculated using DETX and DETY for each event in the final _common_clean file
| Quadrant A | 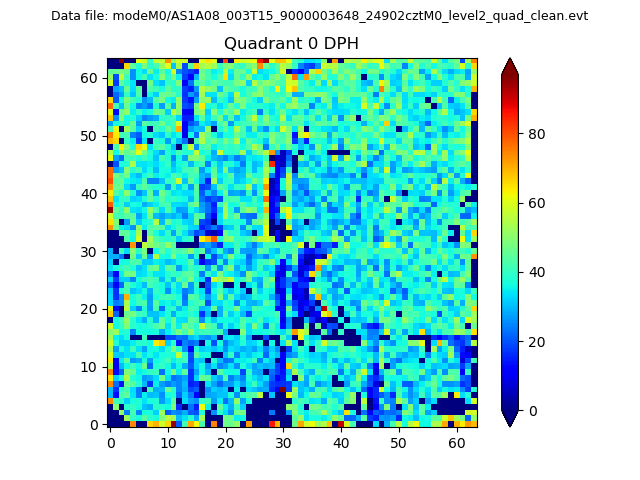 |
 |
Quadrant B |
|---|---|---|---|
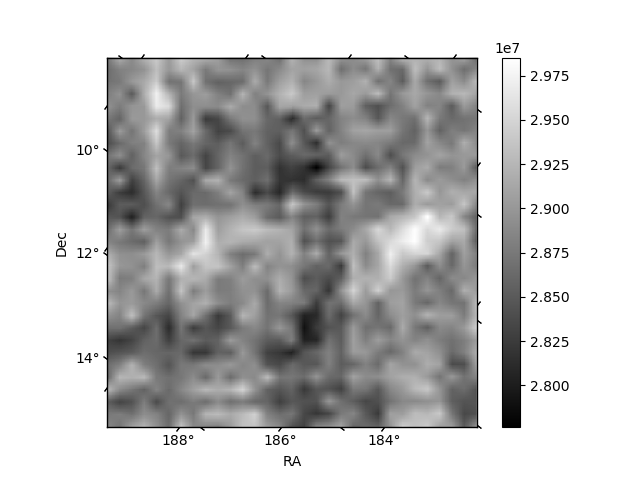
| Quadrant D | 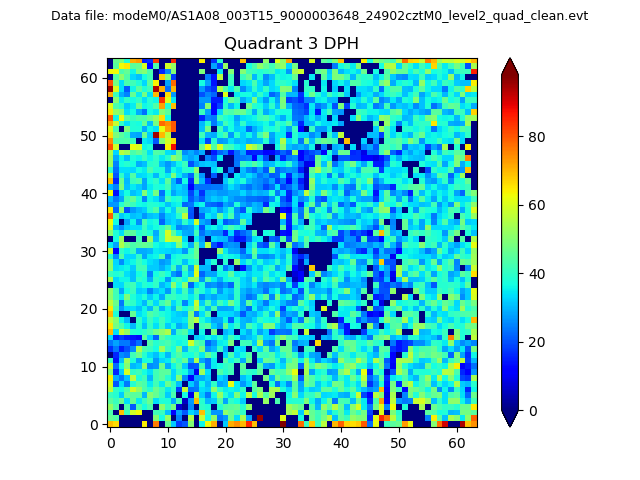 |
 |
Quadrant C |
| Plot type | Count rate plots | Images |
|---|---|---|
| Comparison with Poisson distribution Blue bars denote a histogram of data divided into 1 sec bins. Red curve is a Poisson curve with rate = median count rate of data. |
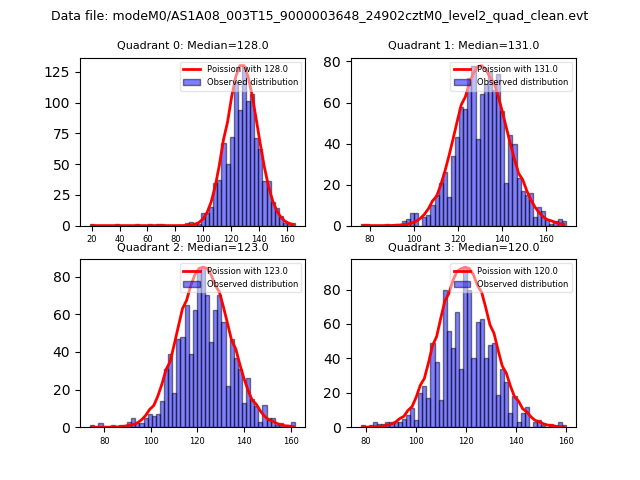 |
 |
| Quadrant-wise count rates Data is divided into 100 sec bins |
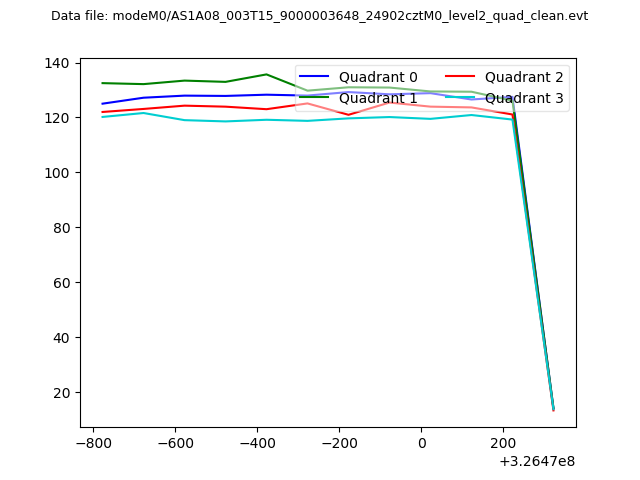 |
|
| Module-wise count rates for Quadrant A Data is divided into 100 sec bins |
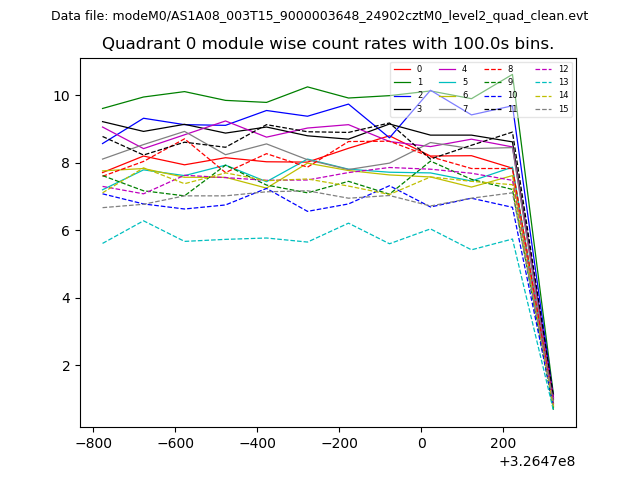 |
 |
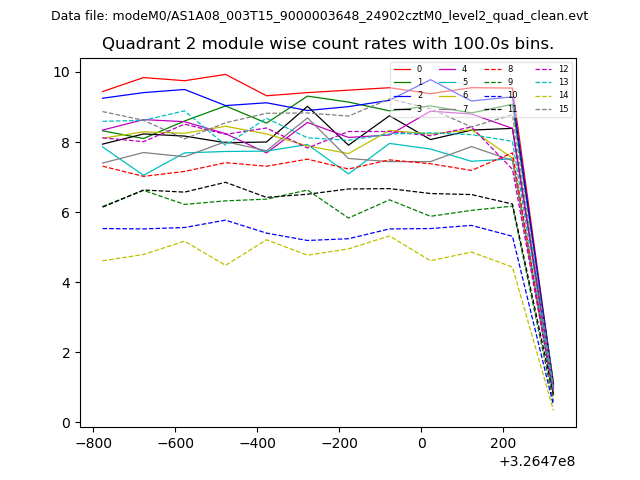
| Module-wise count rates for Quadrant B Data is divided into 100 sec bins |
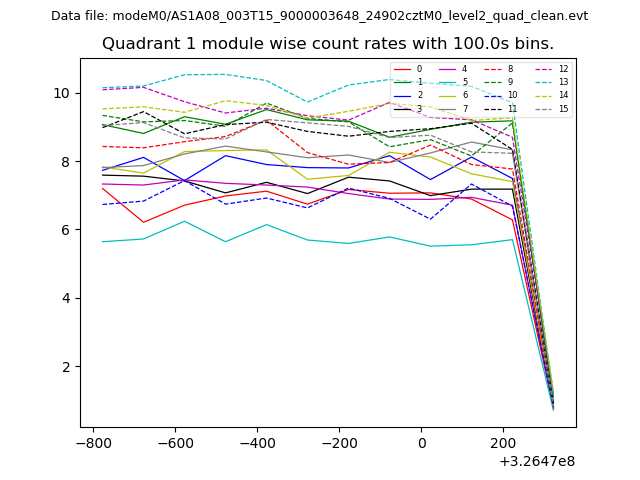 |
 |
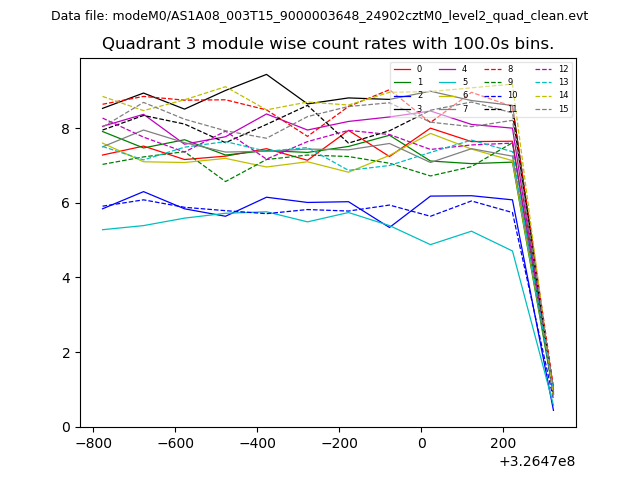
| Module-wise count rates for Quadrant C Data is divided into 100 sec bins |
 |
 |
| Module-wise count rates for Quadrant D Data is divided into 100 sec bins |
 |
 |
| Parameter | Plot |
|---|---|
| CZT HV Monitor | 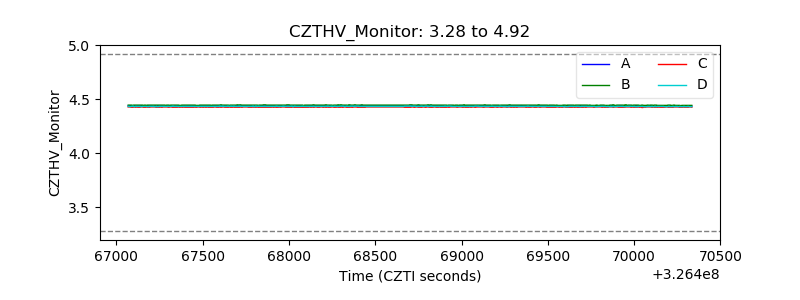 |
| D_VDD | 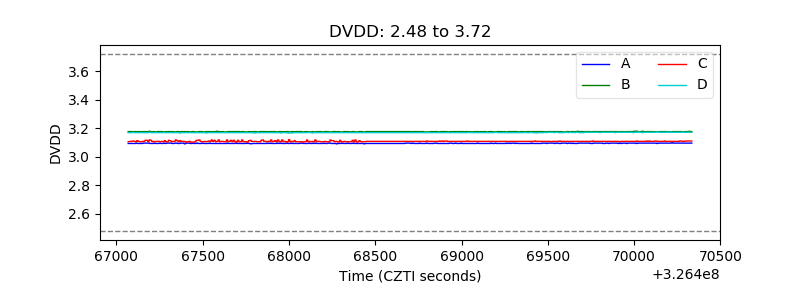 |
| Temperature 1 | 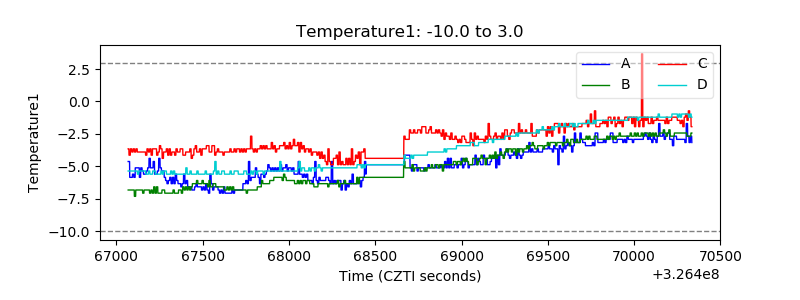 |
| Veto HV Monitor | 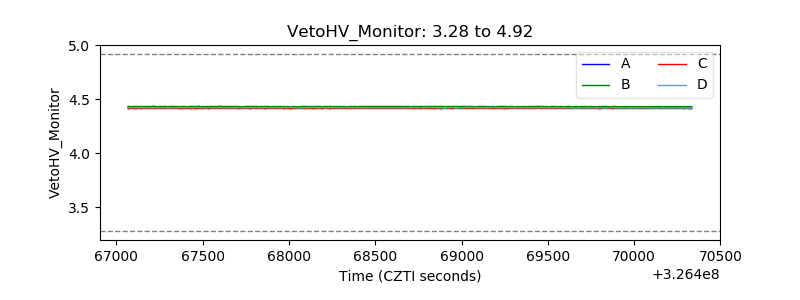 |
| Veto LLD | 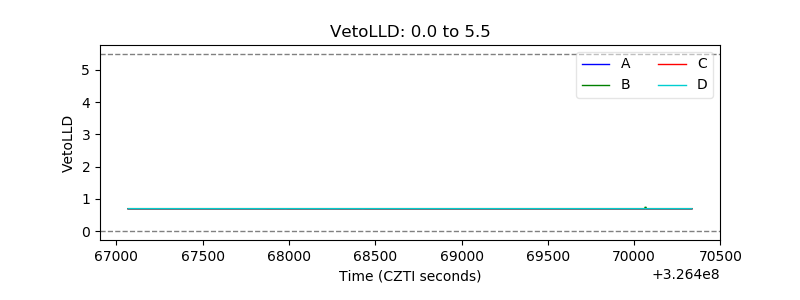 |
| Alpha Counter | 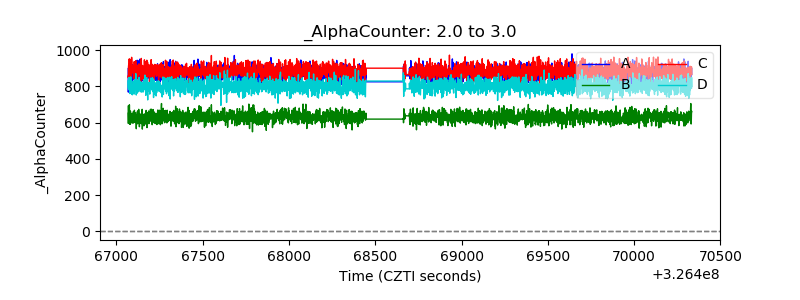 |
| _CPM_Rate | 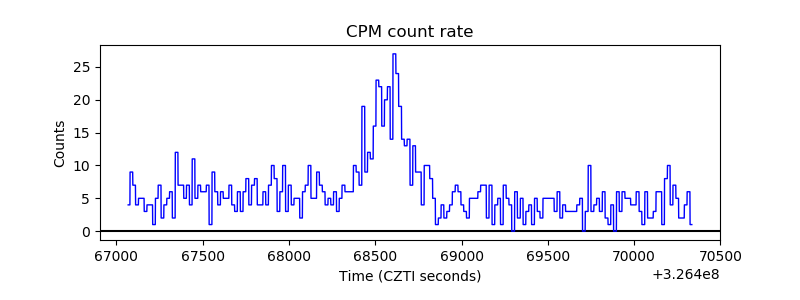 |
| CZT Counter | 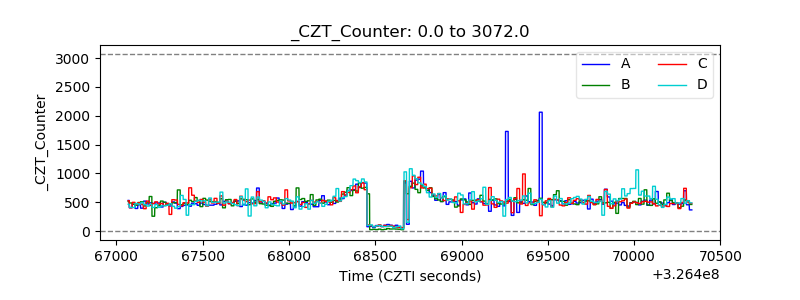 |
| +2.5 Volts monitor |  |
| +5 Volts monitor |  |
| _ROLL_ROT | 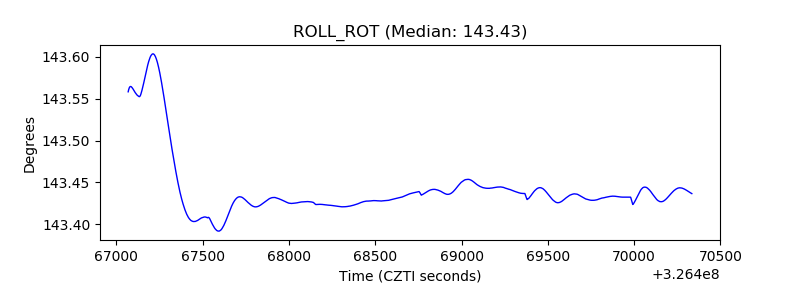 |
| _Roll_DEC | 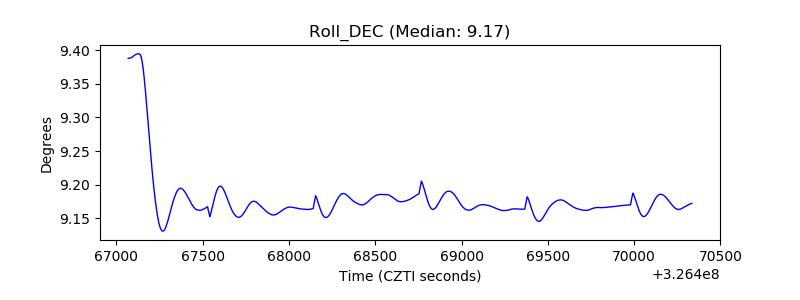 |
| _Roll_RA | 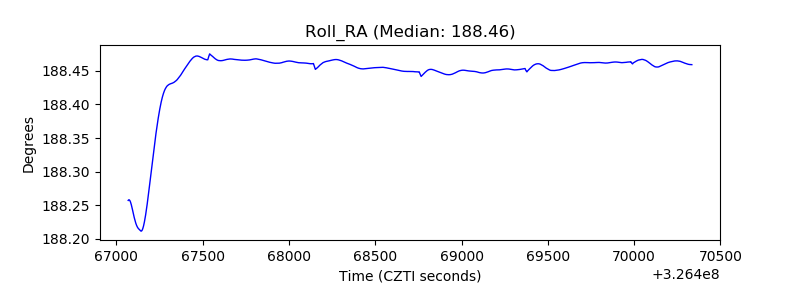 |
| Veto Counter | 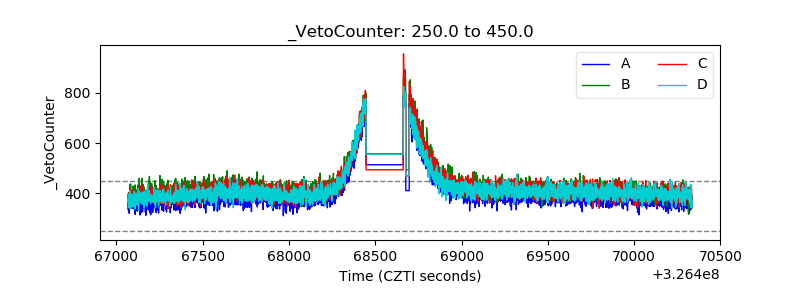 |