| Param | Original file | Final file |
|---|---|---|
| Filename | modeM0/AS1A08_003T15_9000003648_24905cztM0_level2.evt | modeM0/AS1A08_003T15_9000003648_24905cztM0_level2_quad_clean.evt |
| Size (bytes) | 1,325,482,560 | 237,571,200 |
| Size | 1.2 GB | 226.6 MB |
| Events in quadrant A | 9,325,692 | 1,507,355 |
| Events in quadrant B | 9,225,074 | 1,523,877 |
| Events in quadrant C | 9,271,238 | 1,450,184 |
| Events in quadrant D | 11,052,187 | 1,421,293 |
| Mode M0 | |||
|---|---|---|---|
| Quadrant | BADHDUFLAG | Total packets | Discarded packets |
| A | 0 | 39872 | 4 |
| B | 0 | 39166 | 4 |
| C | 0 | 39459 | 4 |
| D | 0 | 45038 | 4 |
| Mode SS | |||
|---|---|---|---|
| Quadrant | BADHDUFLAG | Total packets | Discarded packets |
| A | 0 | 384 | 0 |
| B | 0 | 384 | 0 |
| C | 0 | 384 | 0 |
| D | 0 | 384 | 0 |
| Mode M9 | |||
|---|---|---|---|
| Quadrant | BADHDUFLAG | Total packets | Discarded packets |
| A | 0 | 23 | 0 |
| B | 0 | 23 | 0 |
| C | 0 | 23 | 0 |
| D | 0 | 23 | 0 |
| Quadrant | Total seconds | Saturated seconds | Saturation percentage |
|---|---|---|---|
| A | 18763 | 428 | 2.281085% |
| B | 18764 | 343 | 1.827968% |
| C | 18764 | 467 | 2.488808% |
| D | 18764 | 492 | 2.622042% |
Noise dominated data is calculated using 1-second bins in cleaned event files. If a bin has >2000 counts, and if more than 50% of those come from <1% of pixels, then it is considered to be noise-dominated and hence unusable.
| Quadrant | # 1 sec bins | Bins with >0 counts | Bins with >2000 counts | High rate bins dominated by noise | Noise dominated (total time) | Noise dominated (detector-on time) | Marked lightcurve |
|---|---|---|---|---|---|---|---|
| A | 20968 | 18768 | 78 | 78 | 0.37% | 0.42% | 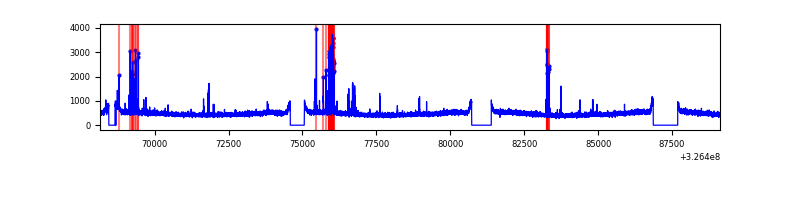 |
| B | 20969 | 18769 | 2 | 2 | 0.01% | 0.01% | 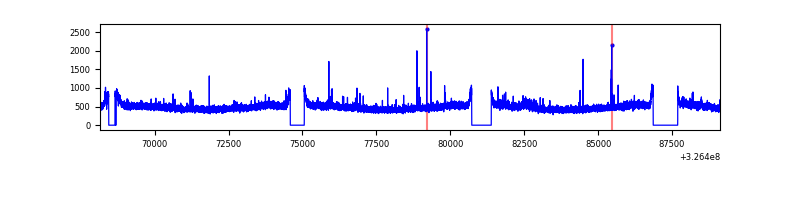 |
| C | 20969 | 18769 | 0 | 0 | 0.00% | 0.00% | 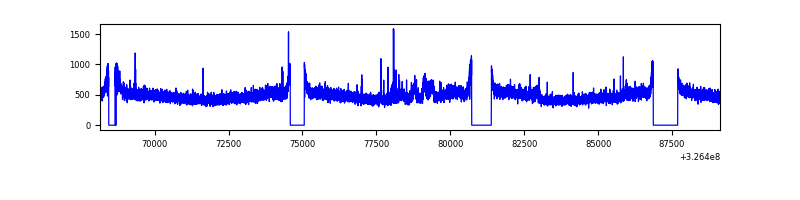 |
| D | 20969 | 18769 | 174 | 174 | 0.83% | 0.93% | 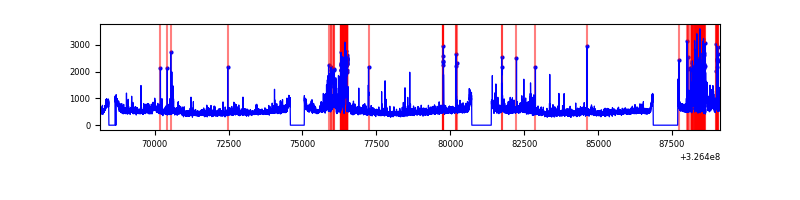 |
Top three noisy pixels from each quadrant. If the there are fewer than three noisy pixels in the level2.evt file, extra rows are filled as -1
| Pixel properties | Quadrant properties | ||||||
|---|---|---|---|---|---|---|---|
| Quadrant | DetID | PixID | Counts | Sigma | Mean | Median | Sigma |
| A | 6 | 16 | 411519 | 878.09 | 2312 | 2260 | 466.1 |
| A | 13 | 254 | 29948 | 59.41 | 2312 | 2260 | 466.1 |
| A | 3 | 137 | 22121 | 42.61 | 2312 | 2260 | 466.1 |
| B | 0 | 189 | 71819 | 156.7 | 2300 | 2237 | 444.0 |
| B | 7 | 202 | 62456 | 135.62 | 2300 | 2237 | 444.0 |
| B | 12 | 111 | 56503 | 122.21 | 2300 | 2237 | 444.0 |
| C | 14 | 238 | 352803 | 672.53 | 2221 | 2232 | 521.3 |
| C | 7 | 247 | 228375 | 433.83 | 2221 | 2232 | 521.3 |
| C | 5 | 112 | 29145 | 51.63 | 2221 | 2232 | 521.3 |
| D | 1 | 52 | 1016779 | 1857.06 | 2252 | 2187 | 546.3 |
| D | 8 | 195 | 966521 | 1765.07 | 2252 | 2187 | 546.3 |
| D | 7 | 238 | 417360 | 759.91 | 2252 | 2187 | 546.3 |
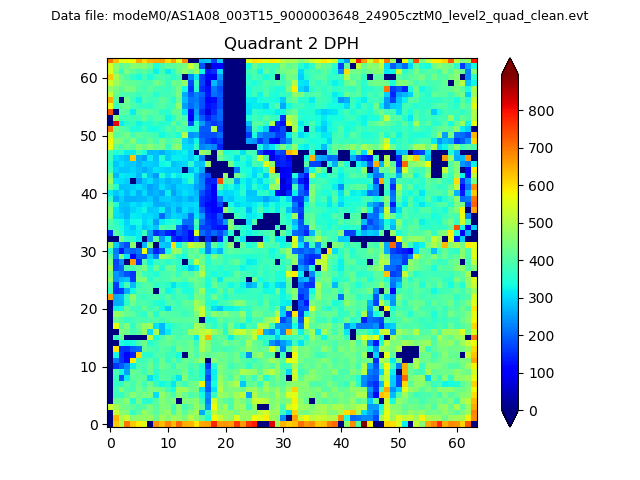
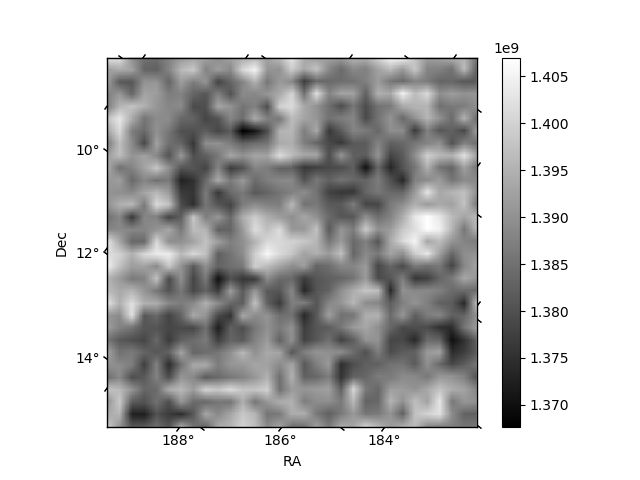
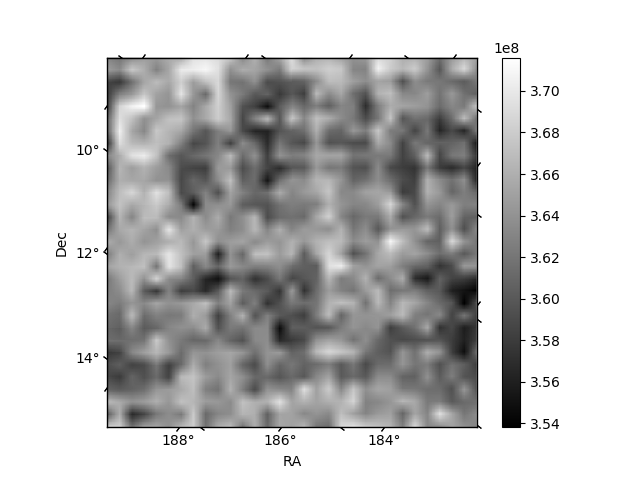
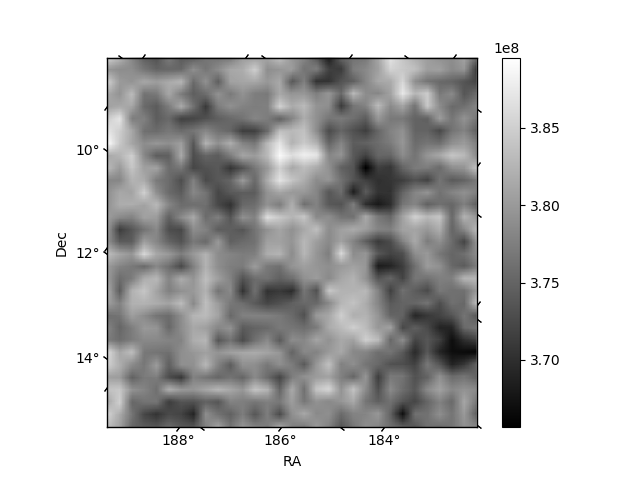
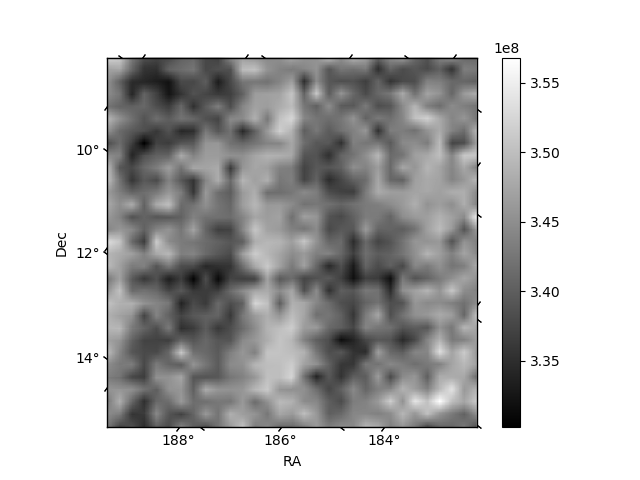
Histogram calculated using DETX and DETY for each event in the final _common_clean file
| Quadrant A | 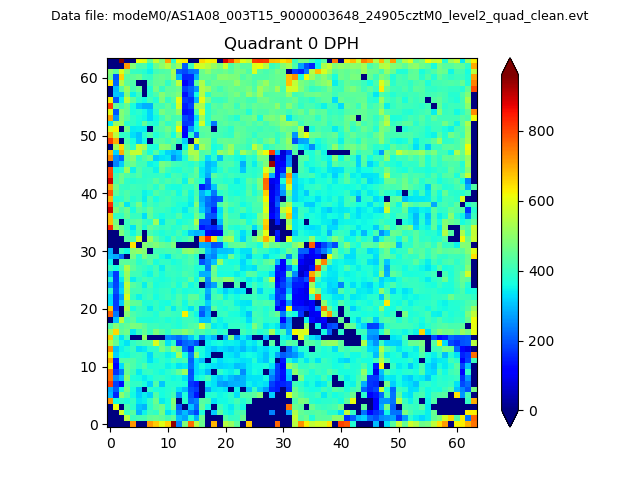 |
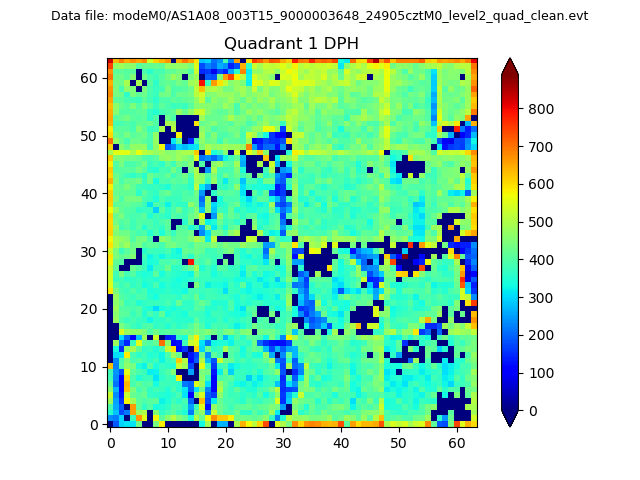 |
Quadrant B |
|---|---|---|---|
| Quadrant D | 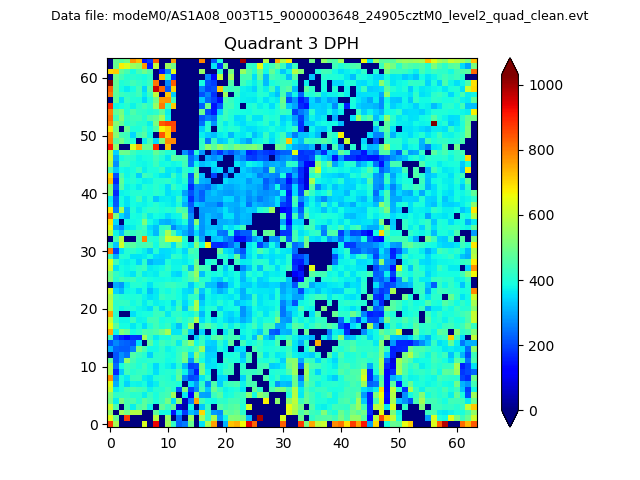 |
 |
Quadrant C |
| Plot type | Count rate plots | Images |
|---|---|---|
| Comparison with Poisson distribution Blue bars denote a histogram of data divided into 1 sec bins. Red curve is a Poisson curve with rate = median count rate of data. |
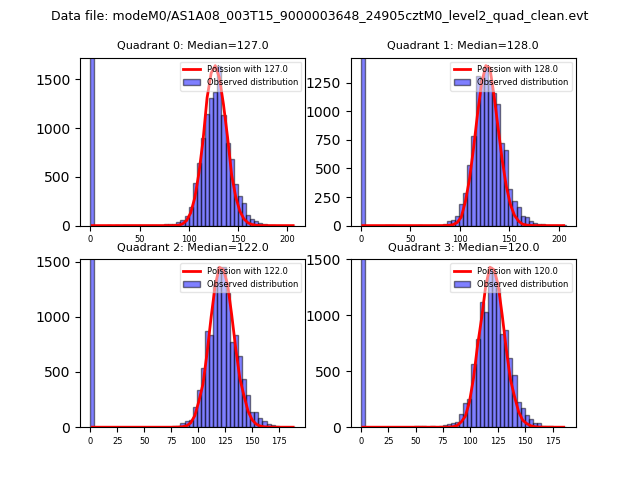 |
 |
| Quadrant-wise count rates Data is divided into 100 sec bins |
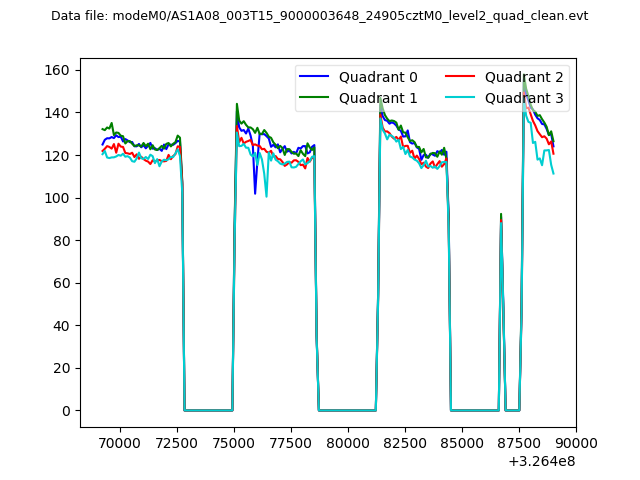 |
|
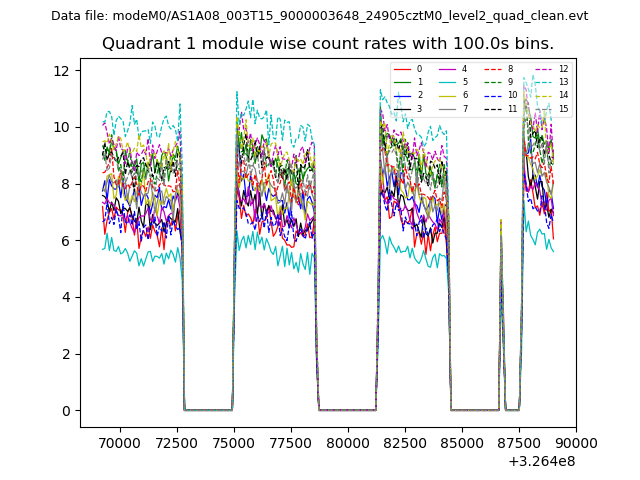
| Module-wise count rates for Quadrant A Data is divided into 100 sec bins |
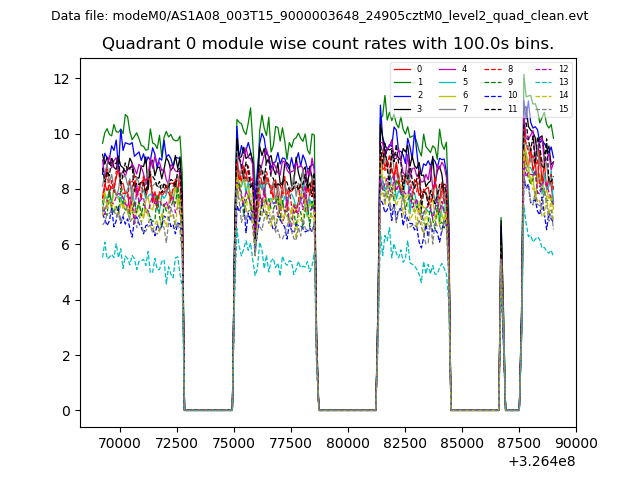 |
 |
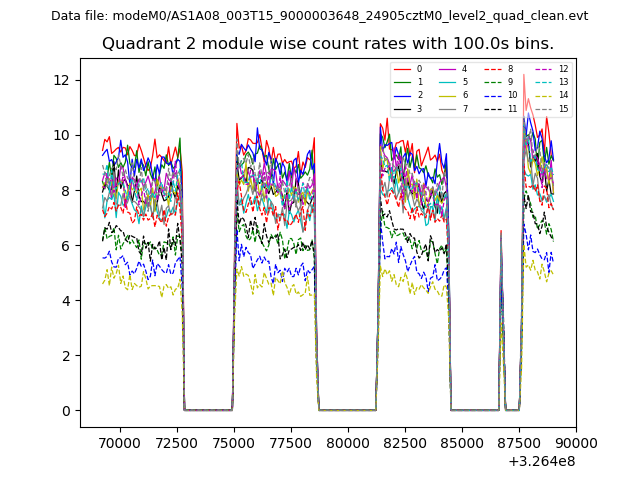
| Module-wise count rates for Quadrant B Data is divided into 100 sec bins |
 |
 |
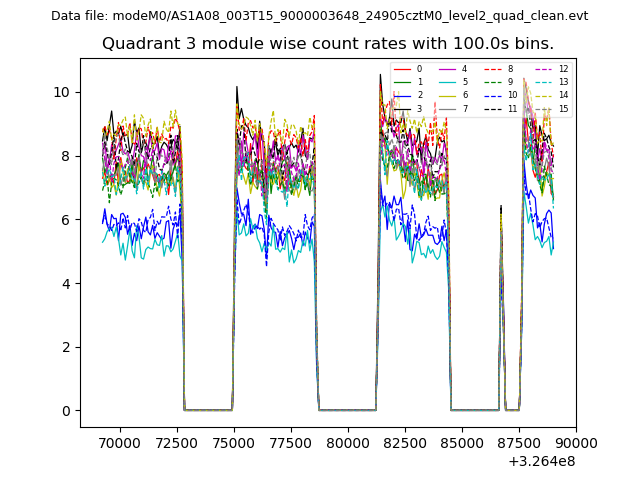
| Module-wise count rates for Quadrant C Data is divided into 100 sec bins |
 |
 |
| Module-wise count rates for Quadrant D Data is divided into 100 sec bins |
 |
 |
| Parameter | Plot |
|---|---|
| CZT HV Monitor | 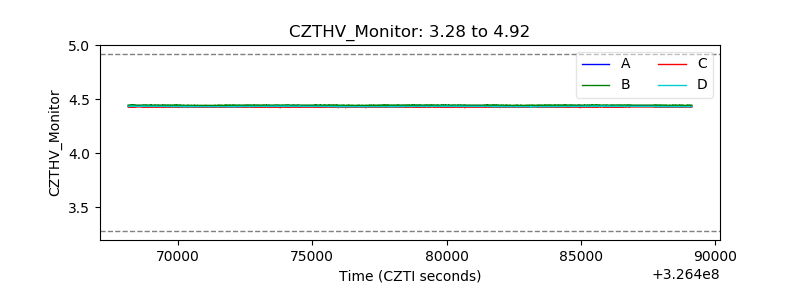 |
| D_VDD | 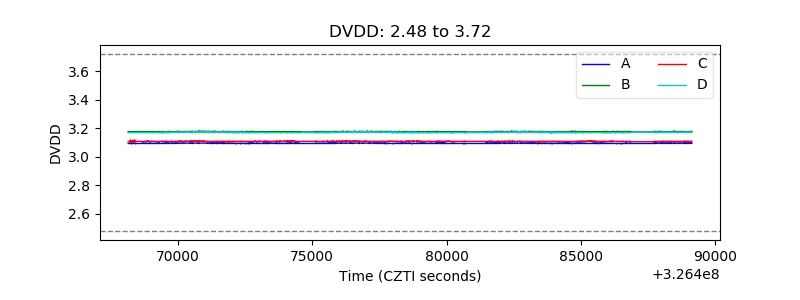 |
| Temperature 1 | 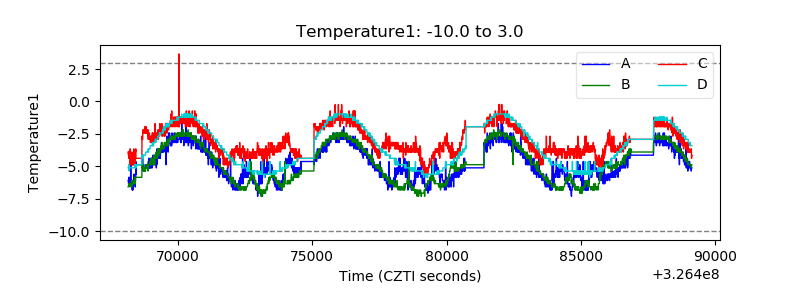 |
| Veto HV Monitor | 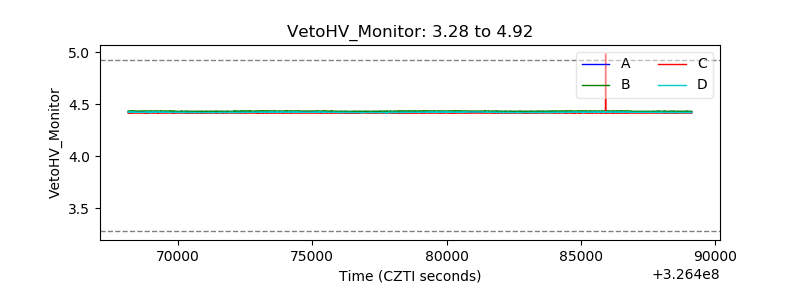 |
| Veto LLD | 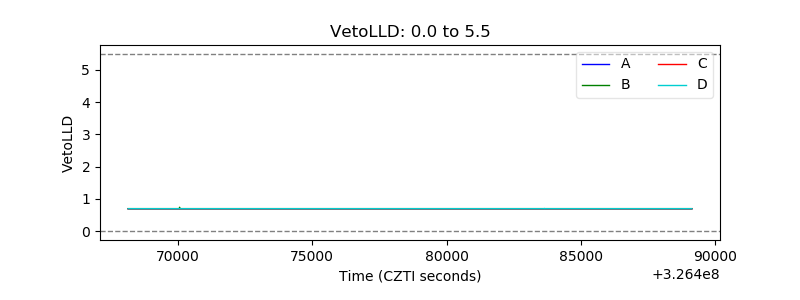 |
| Alpha Counter | 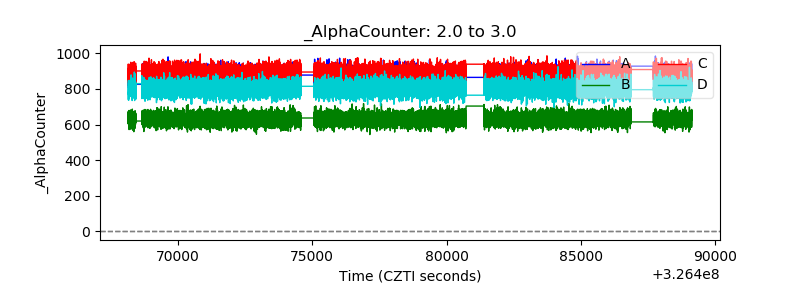 |
| _CPM_Rate | 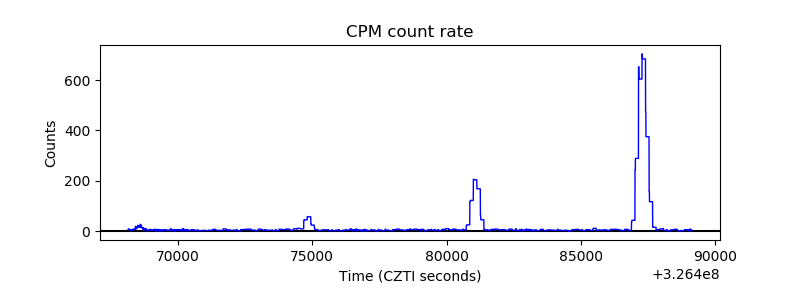 |
| CZT Counter | 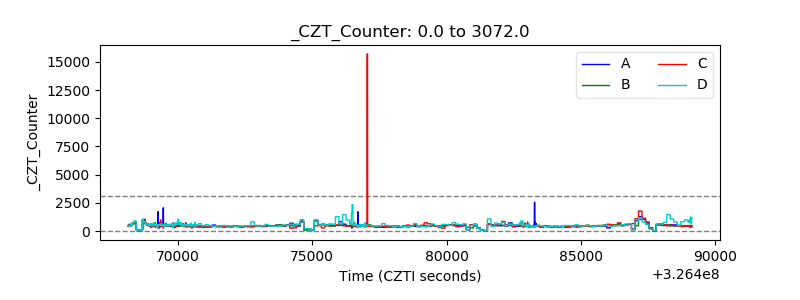 |
| +2.5 Volts monitor |  |
| +5 Volts monitor |  |
| _ROLL_ROT | 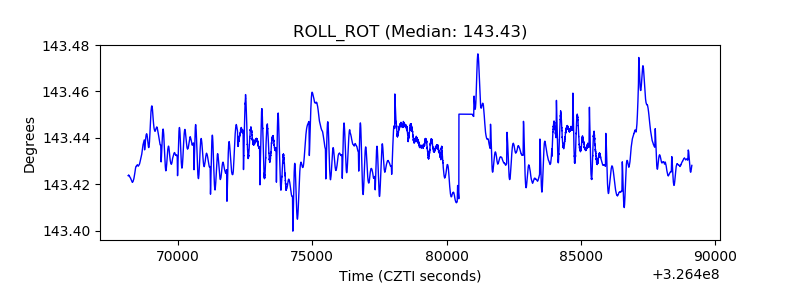 |
| _Roll_DEC |  |
| _Roll_RA | 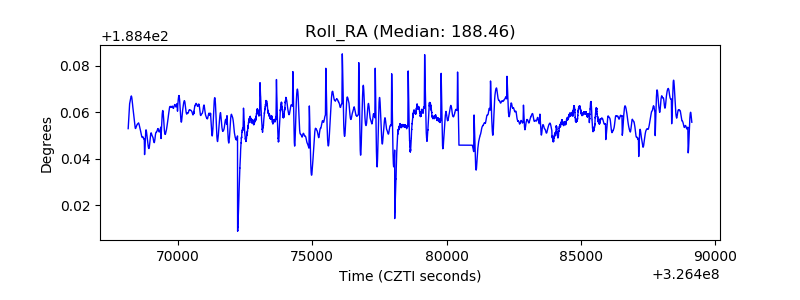 |
| Veto Counter | 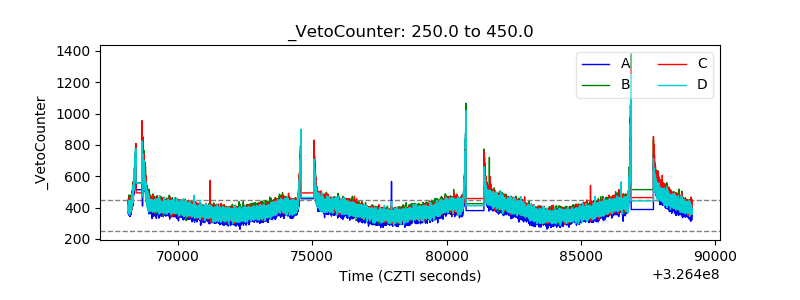 |