| Param | Original file | Final file |
|---|---|---|
| Filename | modeM0/AS1A08_003T15_9000003648_24906cztM0_level2.evt | modeM0/AS1A08_003T15_9000003648_24906cztM0_level2_quad_clean.evt |
| Size (bytes) | 490,135,680 | 92,050,560 |
| Size | 467.4 MB | 87.8 MB |
| Events in quadrant A | 3,190,948 | 594,350 |
| Events in quadrant B | 3,310,678 | 605,626 |
| Events in quadrant C | 3,248,053 | 573,107 |
| Events in quadrant D | 4,644,672 | 552,720 |
| Mode M0 | |||
|---|---|---|---|
| Quadrant | BADHDUFLAG | Total packets | Discarded packets |
| A | 0 | 13797 | 2 |
| B | 0 | 14049 | 2 |
| C | 0 | 13874 | 2 |
| D | 0 | 18425 | 2 |
| Mode SS | |||
|---|---|---|---|
| Quadrant | BADHDUFLAG | Total packets | Discarded packets |
| A | 0 | 136 | 0 |
| B | 0 | 136 | 0 |
| C | 0 | 136 | 0 |
| D | 0 | 136 | 0 |
| Mode M9 | |||
|---|---|---|---|
| Quadrant | BADHDUFLAG | Total packets | Discarded packets |
| A | 0 | 15 | 0 |
| B | 0 | 16 | 0 |
| C | 0 | 16 | 0 |
| D | 0 | 16 | 0 |
| Quadrant | Total seconds | Saturated seconds | Saturation percentage |
|---|---|---|---|
| A | 6617 | 56 | 0.846305% |
| B | 6617 | 66 | 0.997431% |
| C | 6617 | 104 | 1.571709% |
| D | 6616 | 158 | 2.388150% |
Noise dominated data is calculated using 1-second bins in cleaned event files. If a bin has >2000 counts, and if more than 50% of those come from <1% of pixels, then it is considered to be noise-dominated and hence unusable.
| Quadrant | # 1 sec bins | Bins with >0 counts | Bins with >2000 counts | High rate bins dominated by noise | Noise dominated (total time) | Noise dominated (detector-on time) | Marked lightcurve |
|---|---|---|---|---|---|---|---|
| A | 7607 | 6618 | 1 | 1 | 0.01% | 0.02% | 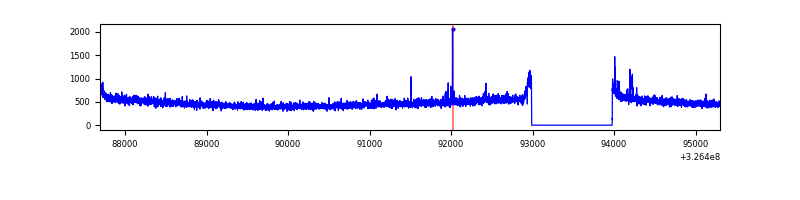 |
| B | 7607 | 6618 | 4 | 4 | 0.05% | 0.06% | 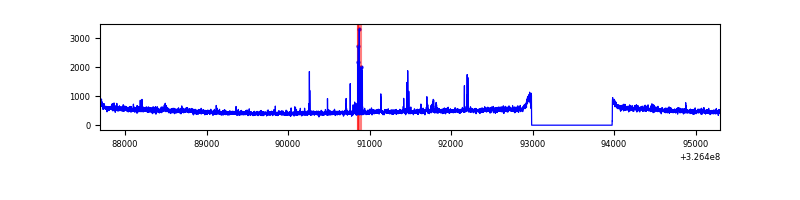 |
| C | 7607 | 6618 | 0 | 0 | 0.00% | 0.00% |  |
| D | 7606 | 6617 | 99 | 99 | 1.30% | 1.50% | 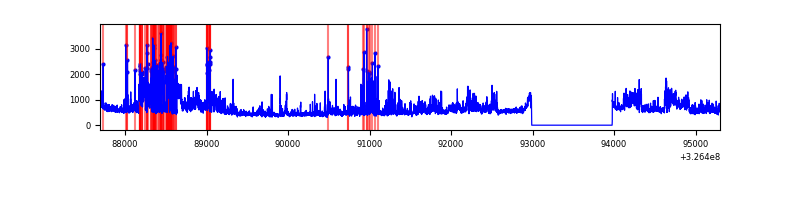 |
Top three noisy pixels from each quadrant. If the there are fewer than three noisy pixels in the level2.evt file, extra rows are filled as -1
| Pixel properties | Quadrant properties | ||||||
|---|---|---|---|---|---|---|---|
| Quadrant | DetID | PixID | Counts | Sigma | Mean | Median | Sigma |
| A | 6 | 16 | 19177 | 109.94 | 822 | 805 | 167.1 |
| A | 13 | 254 | 10685 | 59.12 | 822 | 805 | 167.1 |
| A | 3 | 137 | 7837 | 42.08 | 822 | 805 | 167.1 |
| B | 4 | 80 | 51872 | 323.4 | 817 | 795 | 157.9 |
| B | 0 | 189 | 25442 | 156.05 | 817 | 795 | 157.9 |
| B | 12 | 111 | 19525 | 118.59 | 817 | 795 | 157.9 |
| C | 14 | 238 | 126757 | 677.97 | 789 | 794 | 185.8 |
| C | 5 | 112 | 26676 | 139.3 | 789 | 794 | 185.8 |
| C | 7 | 247 | 18329 | 94.38 | 789 | 794 | 185.8 |
| D | 1 | 52 | 1318254 | 6840.05 | 793 | 770 | 192.6 |
| D | 8 | 195 | 295393 | 1529.61 | 793 | 770 | 192.6 |
| D | 2 | 234 | 26162 | 131.83 | 793 | 770 | 192.6 |
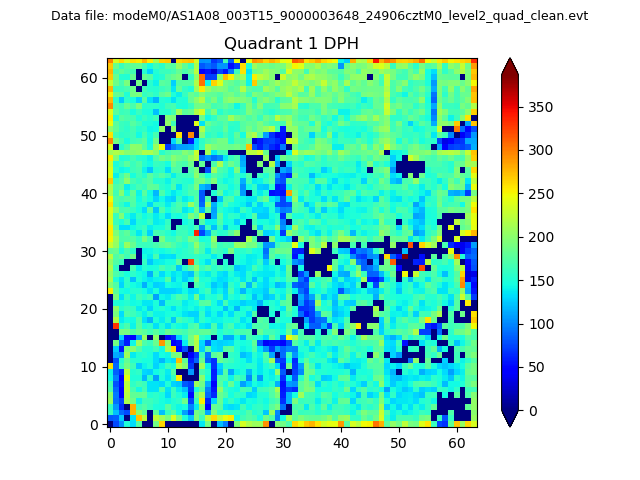
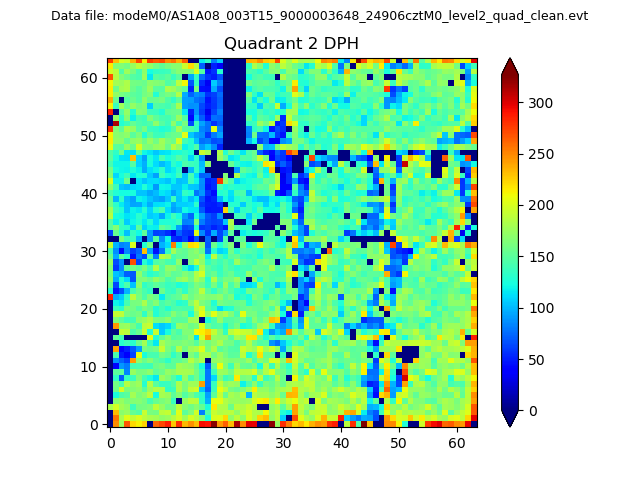
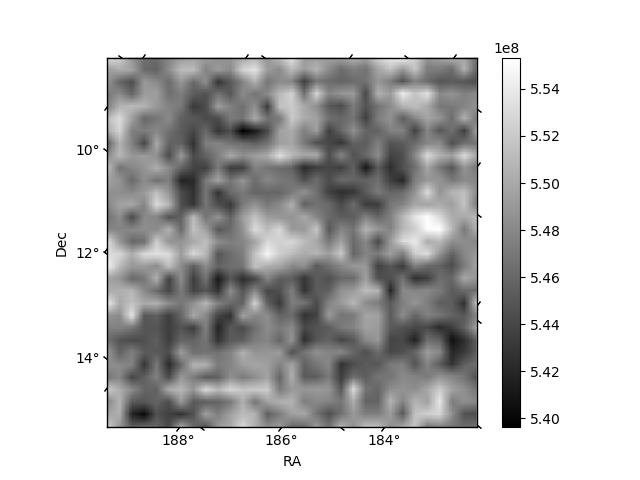
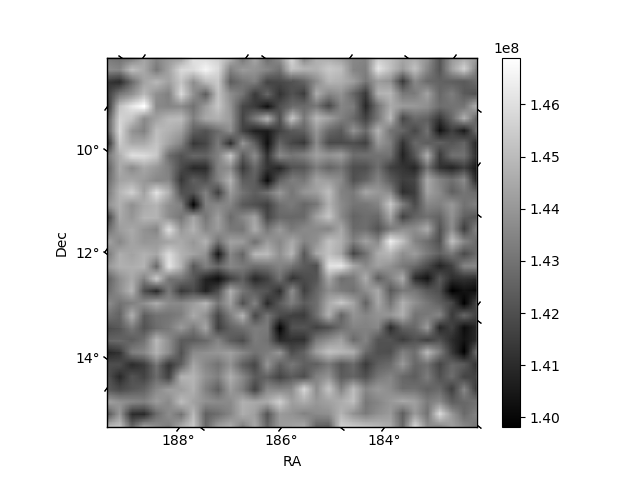
Histogram calculated using DETX and DETY for each event in the final _common_clean file
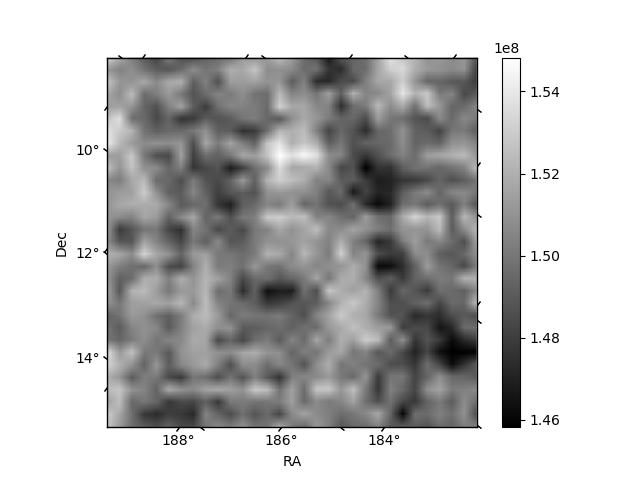
| Quadrant A | 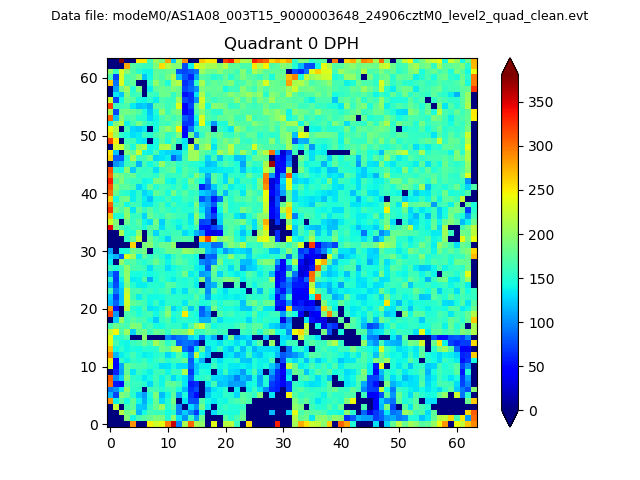 |
 |
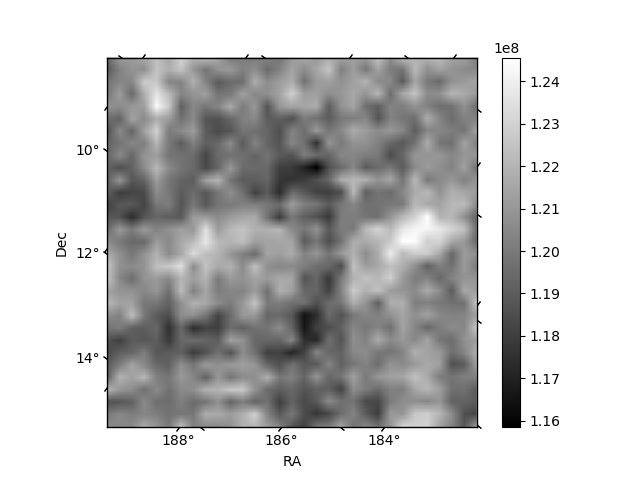
Quadrant B |
|---|---|---|---|
| Quadrant D | 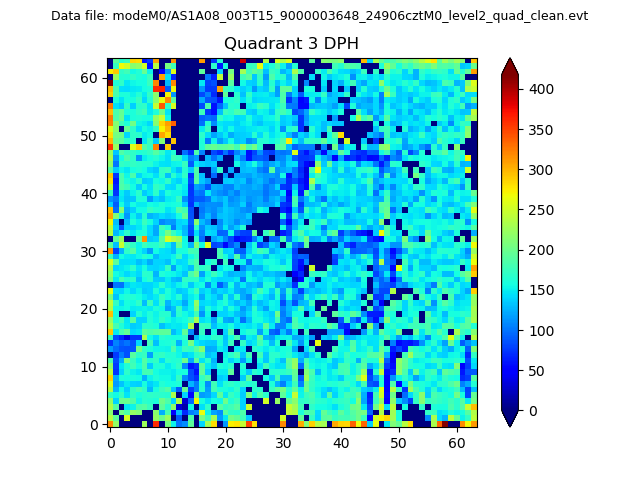 |
 |
Quadrant C |
| Plot type | Count rate plots | Images |
|---|---|---|
| Comparison with Poisson distribution Blue bars denote a histogram of data divided into 1 sec bins. Red curve is a Poisson curve with rate = median count rate of data. |
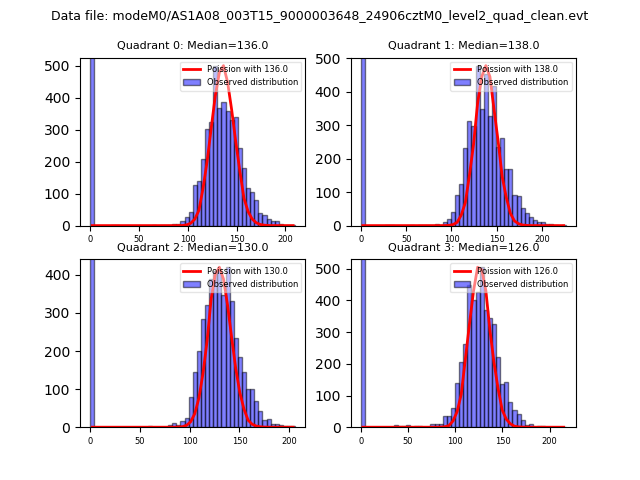 |
 |
| Quadrant-wise count rates Data is divided into 100 sec bins |
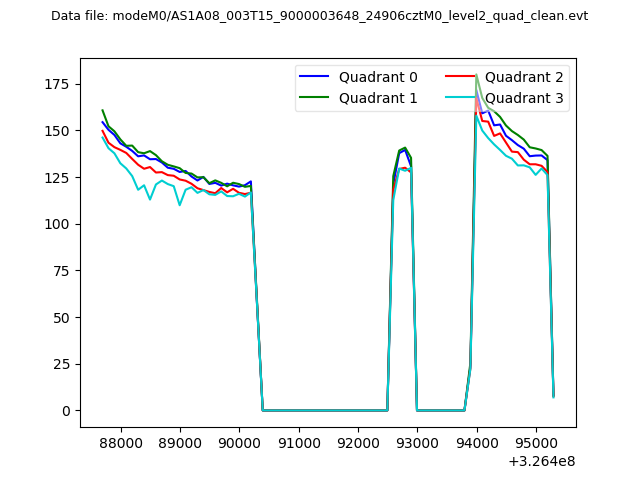 |
|
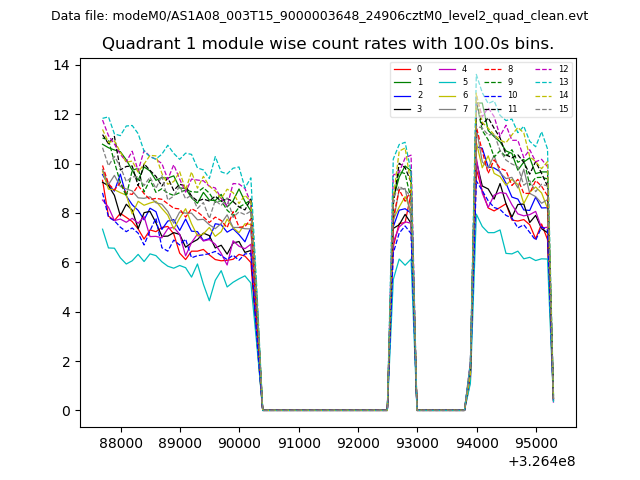
| Module-wise count rates for Quadrant A Data is divided into 100 sec bins |
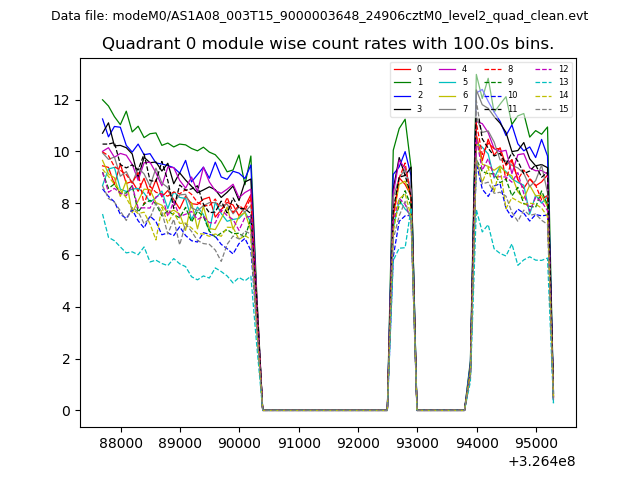 |
 |
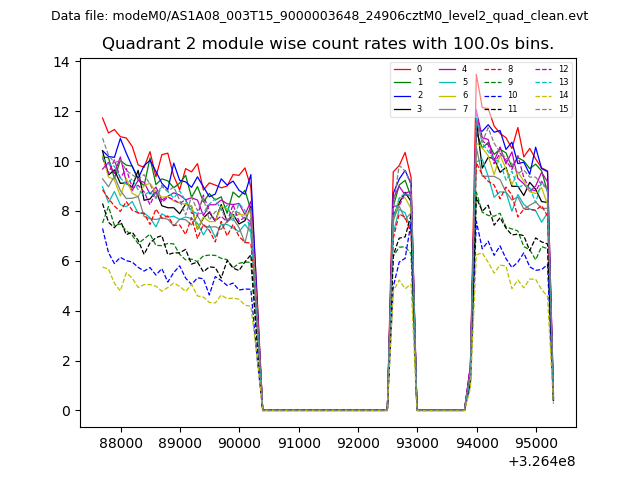
| Module-wise count rates for Quadrant B Data is divided into 100 sec bins |
 |
 |
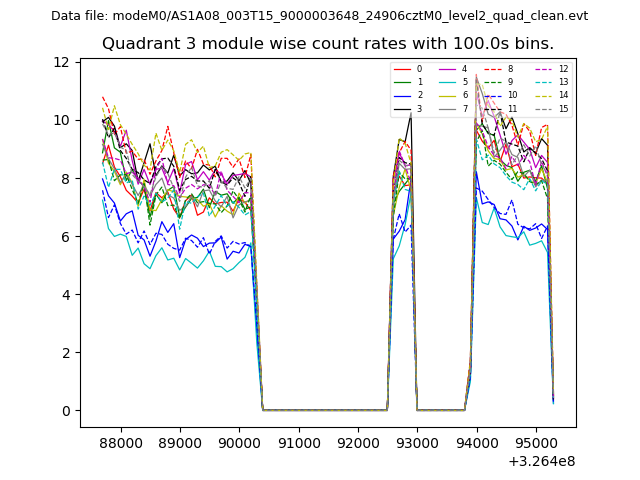
| Module-wise count rates for Quadrant C Data is divided into 100 sec bins |
 |
 |
| Module-wise count rates for Quadrant D Data is divided into 100 sec bins |
 |
 |
| Parameter | Plot |
|---|---|
| CZT HV Monitor | 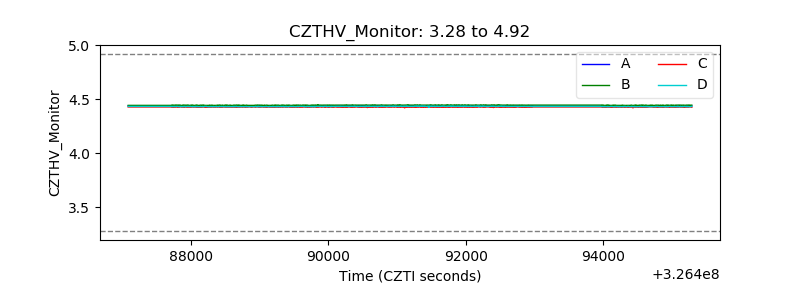 |
| D_VDD | 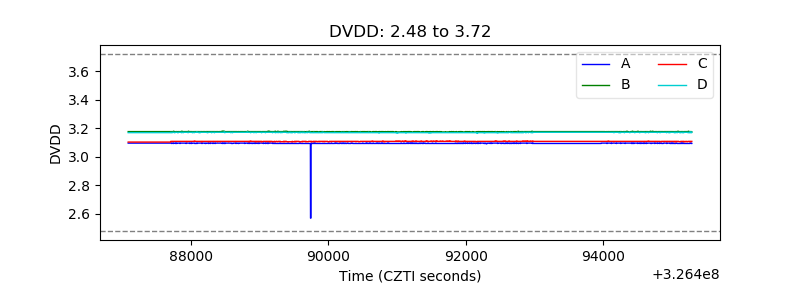 |
| Temperature 1 | 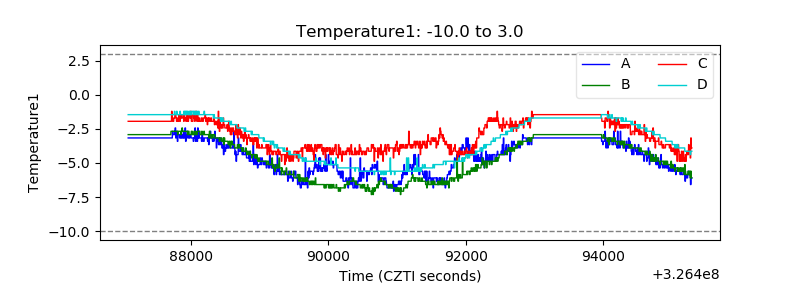 |
| Veto HV Monitor |  |
| Veto LLD | 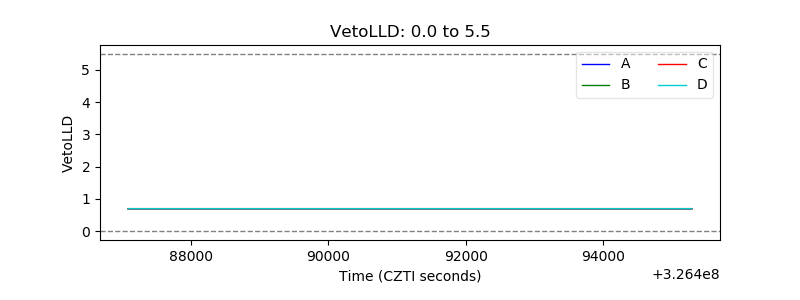 |
| Alpha Counter | 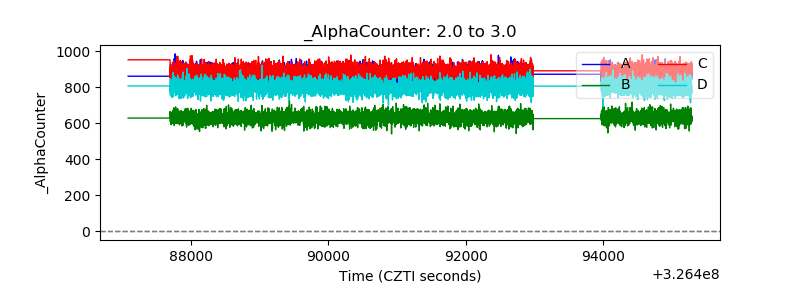 |
| _CPM_Rate | 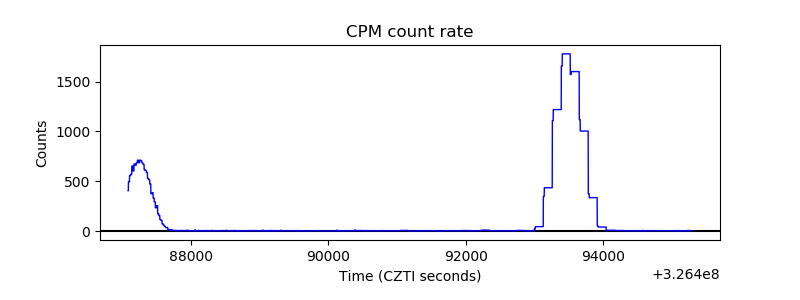 |
| CZT Counter | 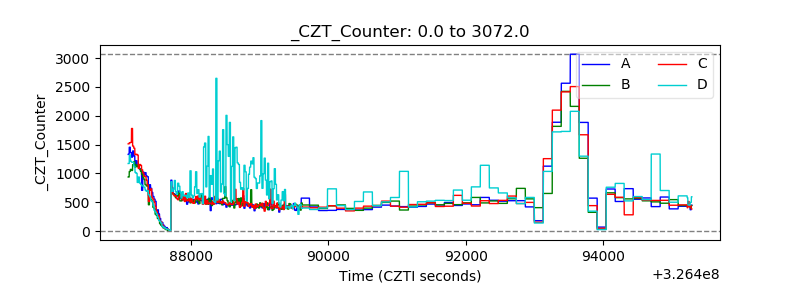 |
| +2.5 Volts monitor |  |
| +5 Volts monitor |  |
| _ROLL_ROT | 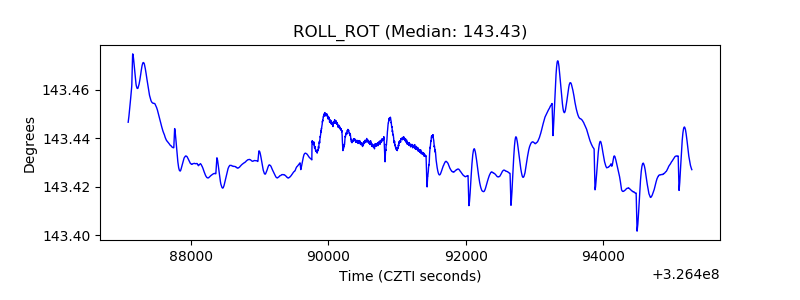 |
| _Roll_DEC | 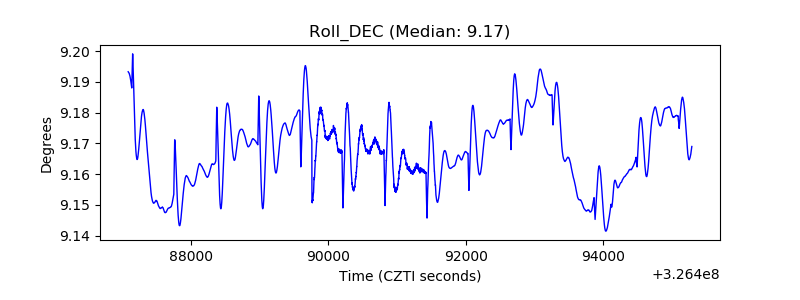 |
| _Roll_RA | 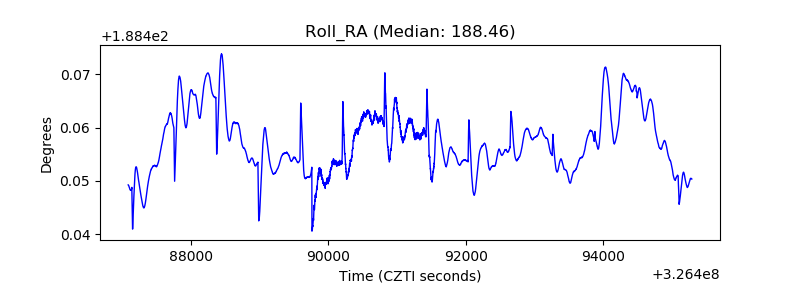 |
| Veto Counter | 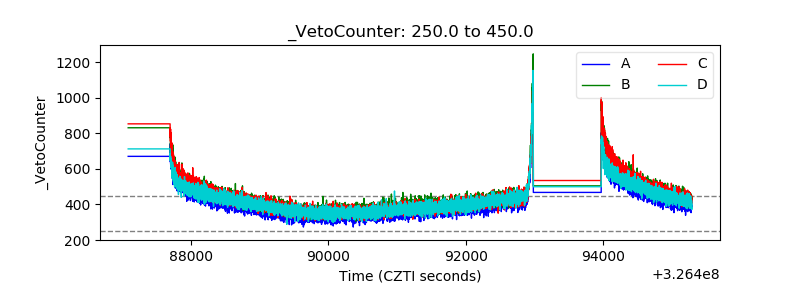 |