| Param | Original file | Final file |
|---|---|---|
| Filename | modeM0/AS1A08_003T15_9000003648_24909cztM0_level2.evt | modeM0/AS1A08_003T15_9000003648_24909cztM0_level2_quad_clean.evt |
| Size (bytes) | 94,296,960 | 28,558,080 |
| Size | 89.9 MB | 27.2 MB |
| Events in quadrant A | 647,742 | 197,466 |
| Events in quadrant B | 665,417 | 205,000 |
| Events in quadrant C | 679,933 | 189,140 |
| Events in quadrant D | 776,191 | 180,157 |
| Mode M0 | |||
|---|---|---|---|
| Quadrant | BADHDUFLAG | Total packets | Discarded packets |
| A | 0 | 2659 | 1 |
| B | 0 | 2723 | 1 |
| C | 0 | 2779 | 1 |
| D | 0 | 3165 | 1 |
| Mode SS | |||
|---|---|---|---|
| Quadrant | BADHDUFLAG | Total packets | Discarded packets |
| A | 0 | 26 | 0 |
| B | 0 | 26 | 0 |
| C | 0 | 26 | 0 |
| D | 0 | 26 | 0 |
| Mode M9 | |||
|---|---|---|---|
| Quadrant | BADHDUFLAG | Total packets | Discarded packets |
| A | 0 | 3 | 0 |
| B | 0 | 4 | 0 |
| C | 0 | 4 | 0 |
| D | 0 | 4 | 0 |
| Quadrant | Total seconds | Saturated seconds | Saturation percentage |
|---|---|---|---|
| A | 1224 | 3 | 0.245098% |
| B | 1224 | 3 | 0.245098% |
| C | 1224 | 8 | 0.653595% |
| D | 1224 | 9 | 0.735294% |
Noise dominated data is calculated using 1-second bins in cleaned event files. If a bin has >2000 counts, and if more than 50% of those come from <1% of pixels, then it is considered to be noise-dominated and hence unusable.
| Quadrant | # 1 sec bins | Bins with >0 counts | Bins with >2000 counts | High rate bins dominated by noise | Noise dominated (total time) | Noise dominated (detector-on time) | Marked lightcurve |
|---|---|---|---|---|---|---|---|
| A | 1224 | 1224 | 0 | 0 | 0.00% | 0.00% | 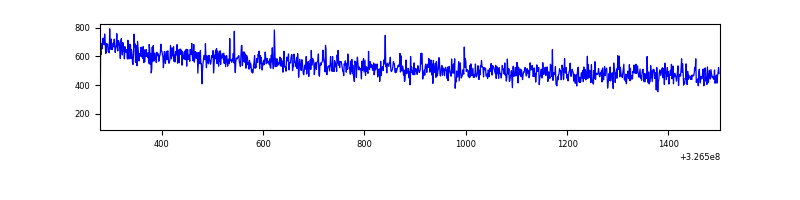 |
| B | 1224 | 1224 | 0 | 0 | 0.00% | 0.00% | 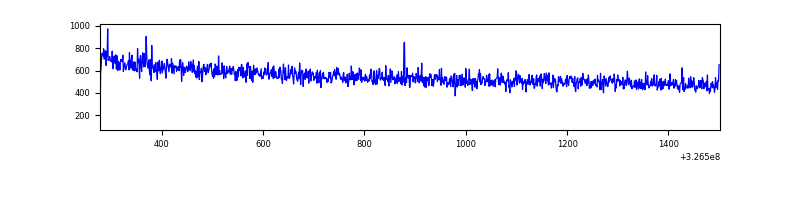 |
| C | 1224 | 1224 | 0 | 0 | 0.00% | 0.00% | 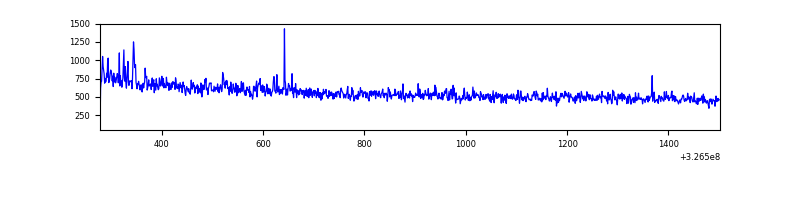 |
| D | 1224 | 1224 | 4 | 4 | 0.33% | 0.33% | 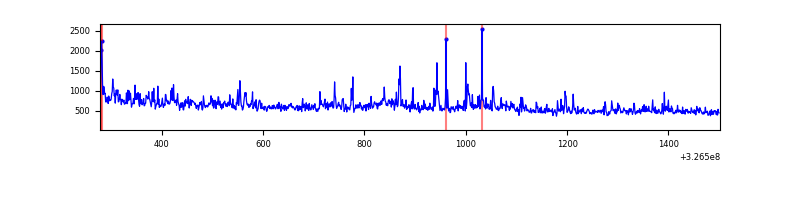 |
Top three noisy pixels from each quadrant. If the there are fewer than three noisy pixels in the level2.evt file, extra rows are filled as -1
| Pixel properties | Quadrant properties | ||||||
|---|---|---|---|---|---|---|---|
| Quadrant | DetID | PixID | Counts | Sigma | Mean | Median | Sigma |
| A | 13 | 254 | 1904 | 49.64 | 167 | 164 | 35.1 |
| A | 0 | 226 | 1434 | 36.23 | 167 | 164 | 35.1 |
| A | 3 | 137 | 1422 | 35.89 | 167 | 164 | 35.1 |
| B | 12 | 111 | 3514 | 100.05 | 169 | 165 | 33.5 |
| B | 11 | 111 | 3265 | 92.61 | 169 | 165 | 33.5 |
| B | 14 | 111 | 2831 | 79.64 | 169 | 165 | 33.5 |
| C | 14 | 238 | 26137 | 670.9 | 161 | 162 | 38.7 |
| C | 5 | 112 | 8417 | 213.21 | 161 | 162 | 38.7 |
| C | 0 | 10 | 6868 | 173.21 | 161 | 162 | 38.7 |
| D | 1 | 52 | 127765 | 3175.09 | 160 | 156 | 40.2 |
| D | 2 | 244 | 19297 | 476.25 | 160 | 156 | 40.2 |
| D | 8 | 195 | 13818 | 339.93 | 160 | 156 | 40.2 |
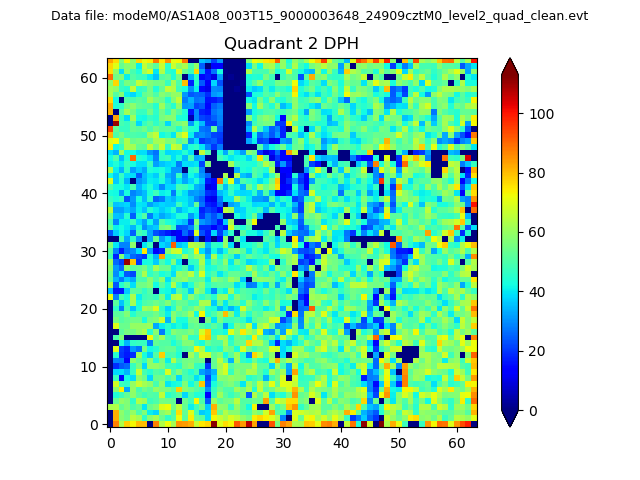
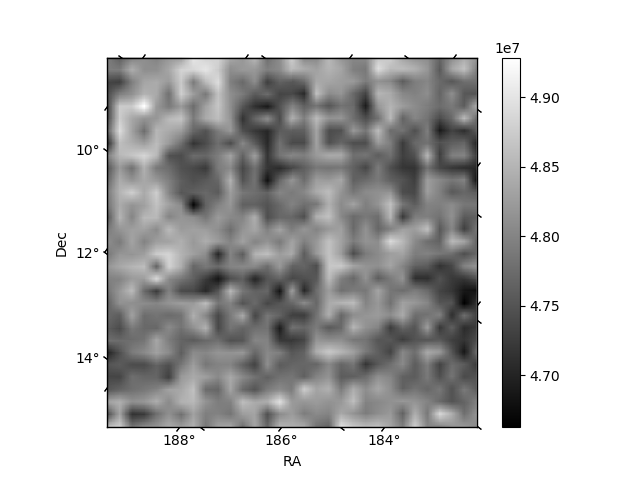
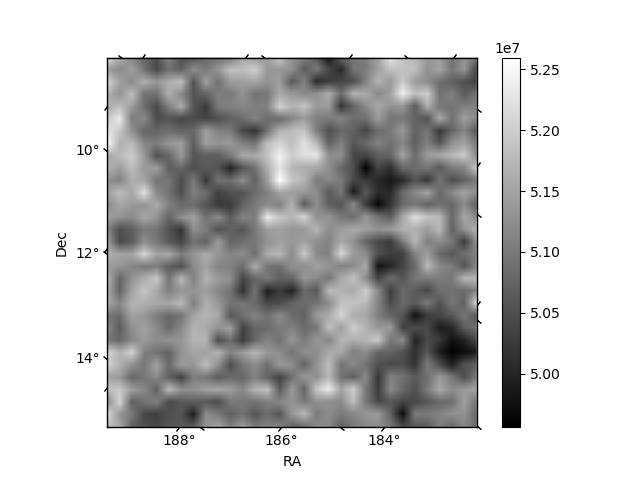
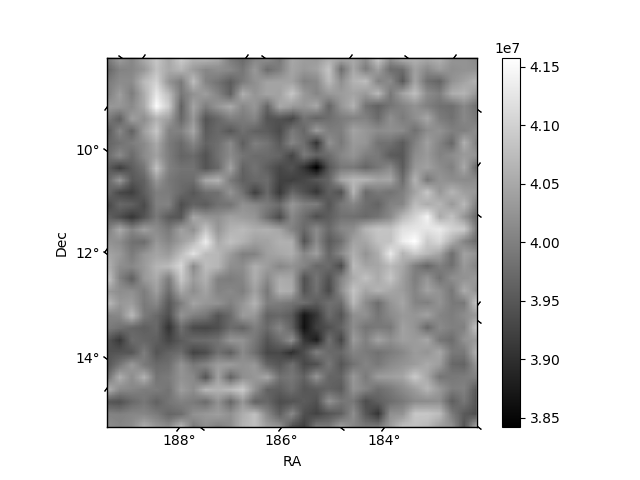
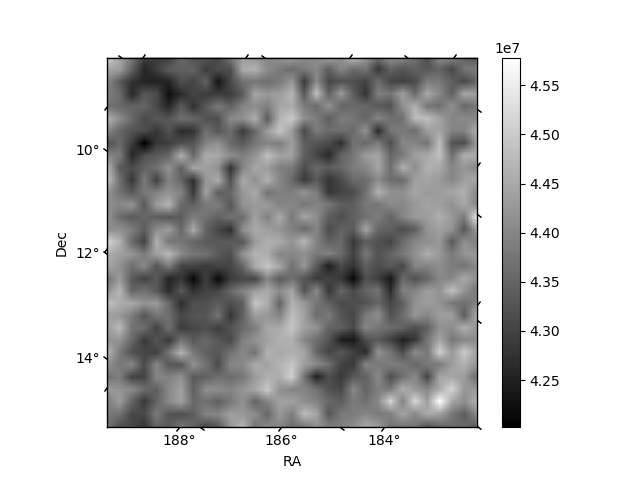
Histogram calculated using DETX and DETY for each event in the final _common_clean file
| Quadrant A | 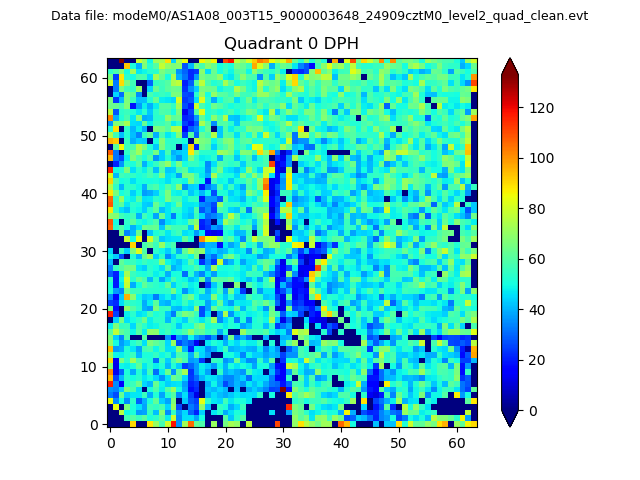 |
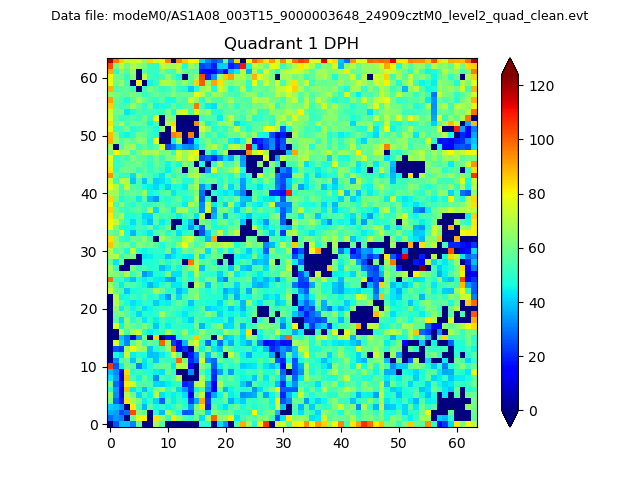 |
Quadrant B |
|---|---|---|---|
| Quadrant D | 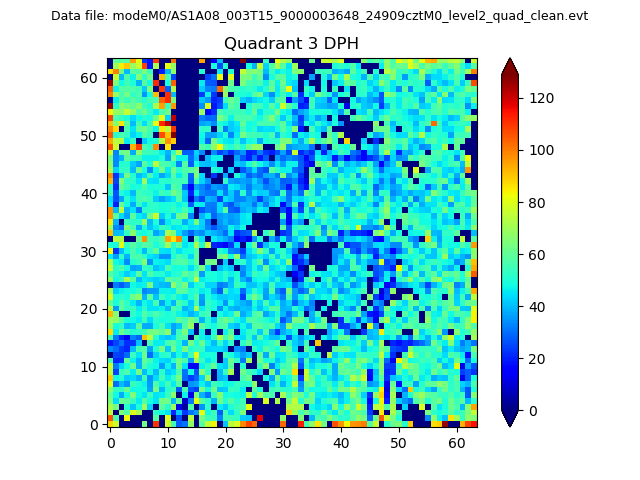 |
 |
Quadrant C |
| Plot type | Count rate plots | Images |
|---|---|---|
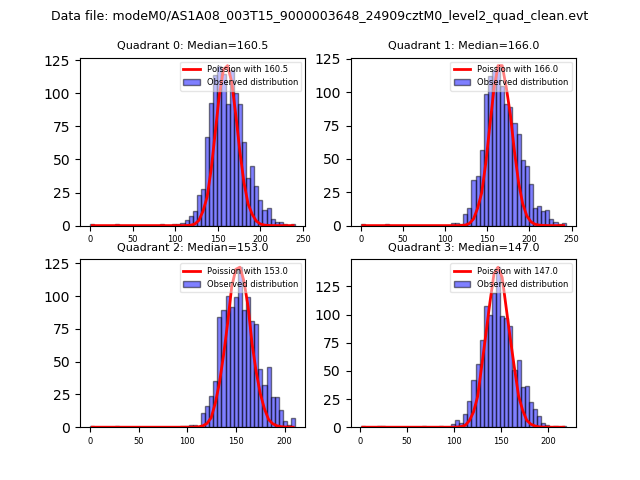
| Comparison with Poisson distribution Blue bars denote a histogram of data divided into 1 sec bins. Red curve is a Poisson curve with rate = median count rate of data. |
 |
 |
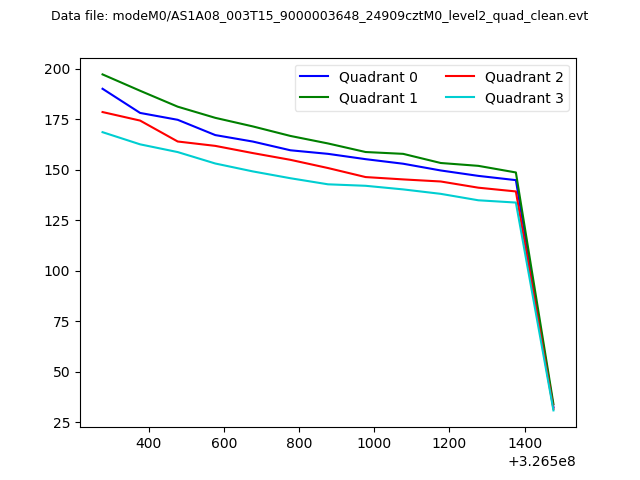
| Quadrant-wise count rates Data is divided into 100 sec bins |
 |
|
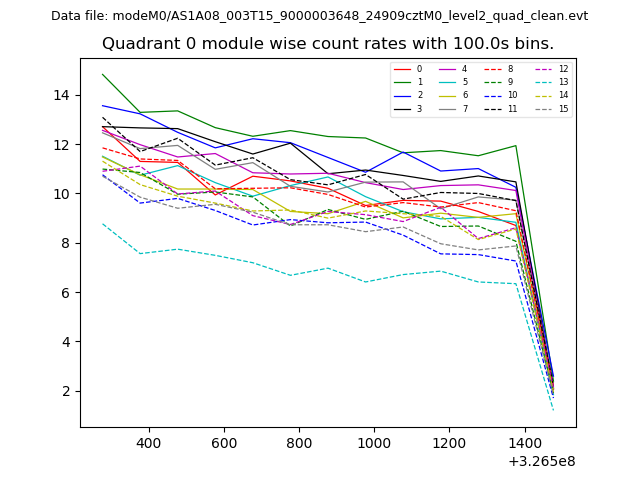
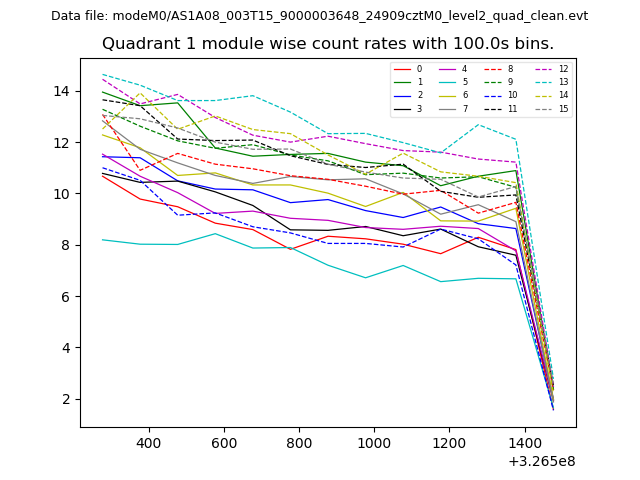
| Module-wise count rates for Quadrant A Data is divided into 100 sec bins |
 |
 |
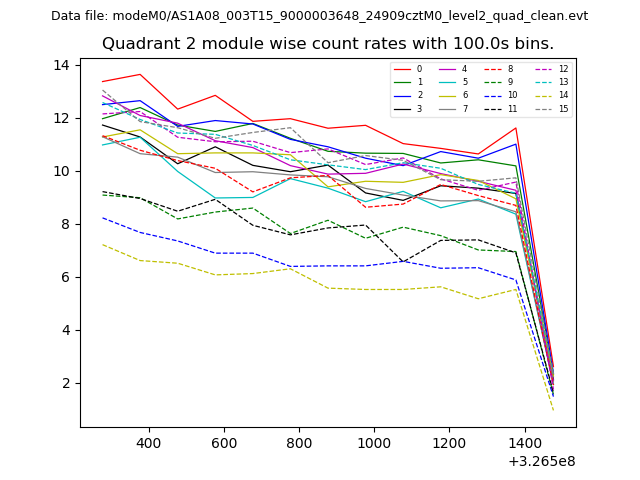
| Module-wise count rates for Quadrant B Data is divided into 100 sec bins |
 |
 |
| Module-wise count rates for Quadrant C Data is divided into 100 sec bins |
 |
 |
| Module-wise count rates for Quadrant D Data is divided into 100 sec bins |
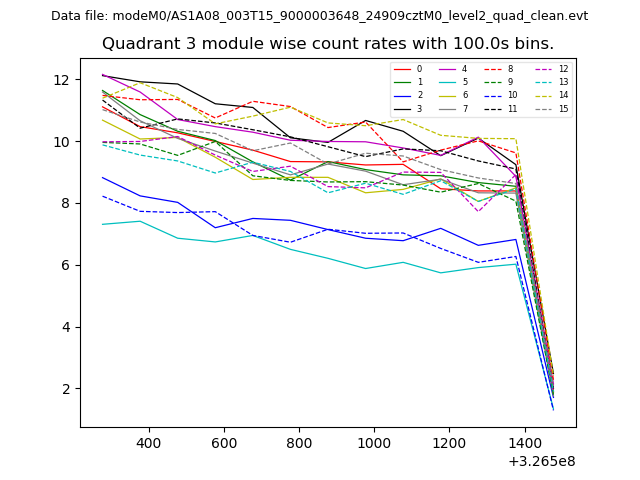 |
 |
| Parameter | Plot |
|---|---|
| CZT HV Monitor | 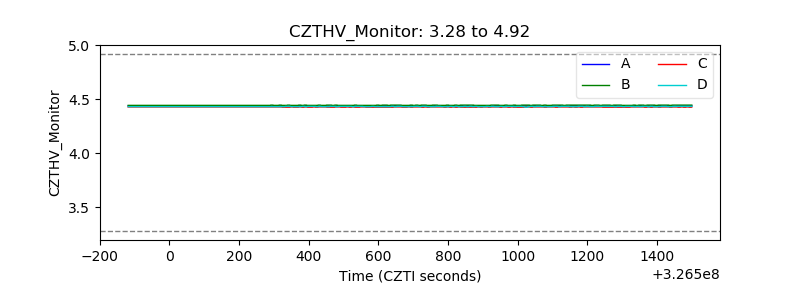 |
| D_VDD | 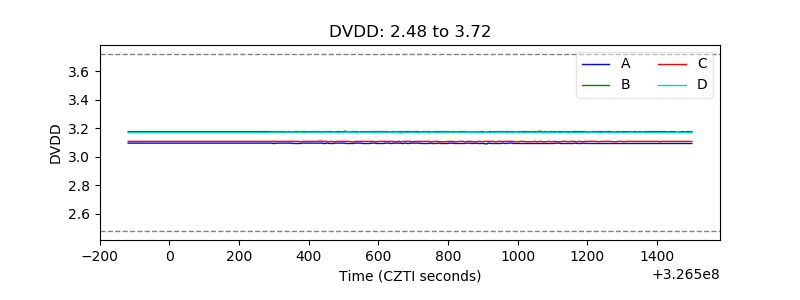 |
| Temperature 1 | 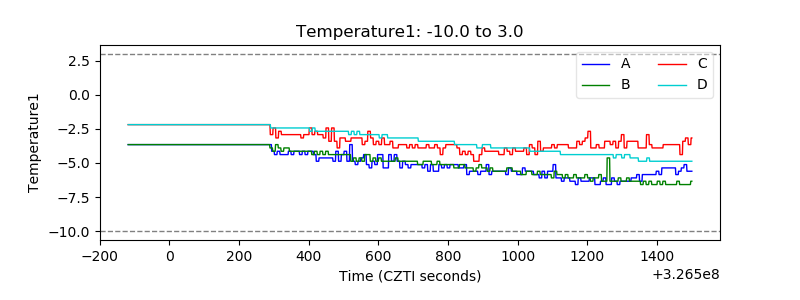 |
| Veto HV Monitor | 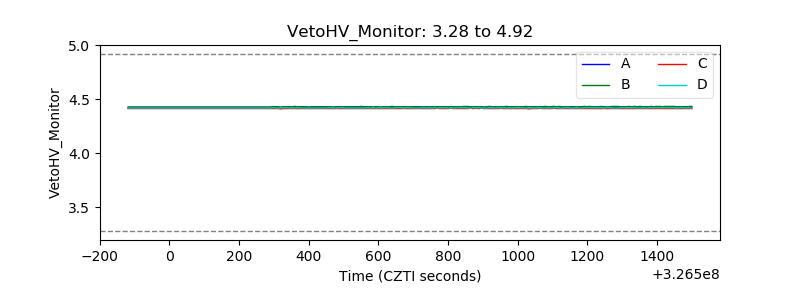 |
| Veto LLD | 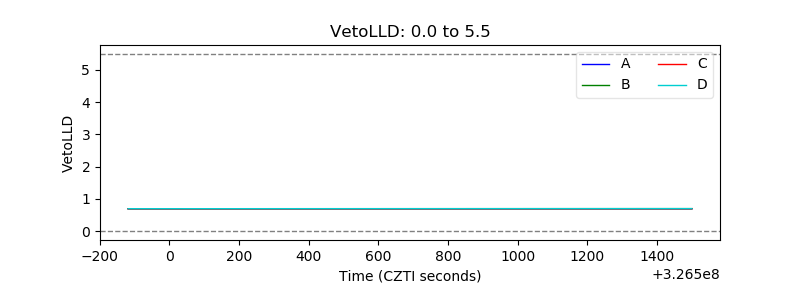 |
| Alpha Counter | 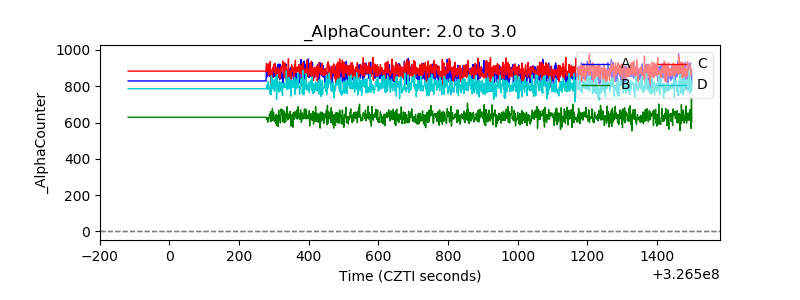 |
| _CPM_Rate | 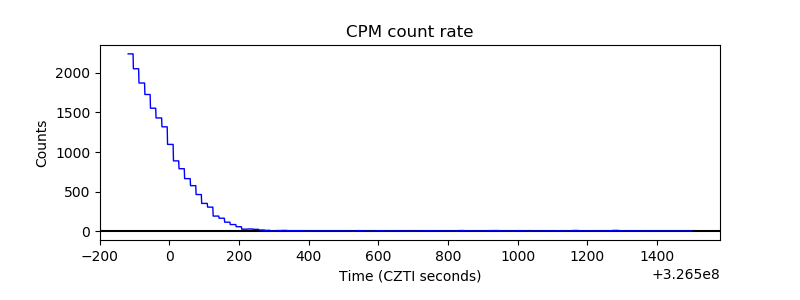 |
| CZT Counter | 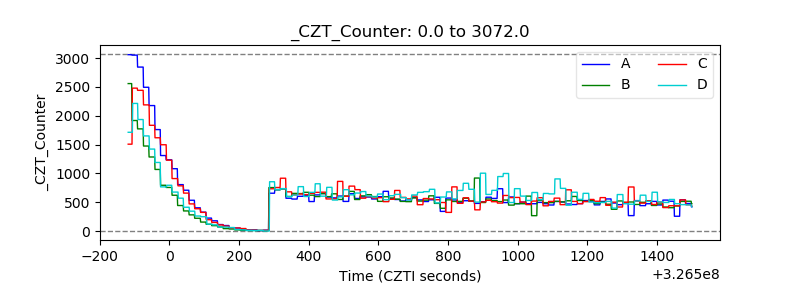 |
| +2.5 Volts monitor |  |
| +5 Volts monitor |  |
| _ROLL_ROT | 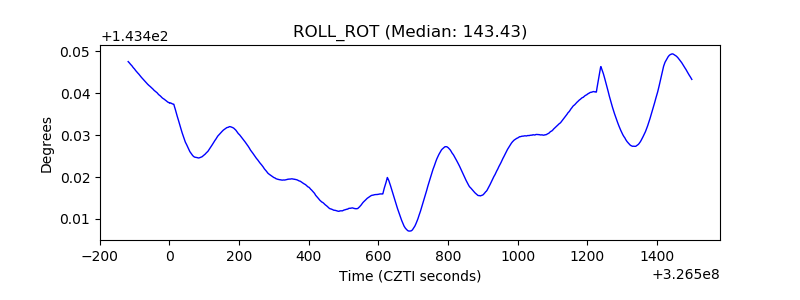 |
| _Roll_DEC | 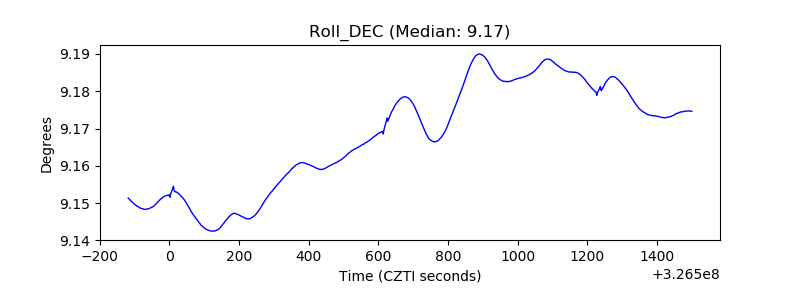 |
| _Roll_RA | 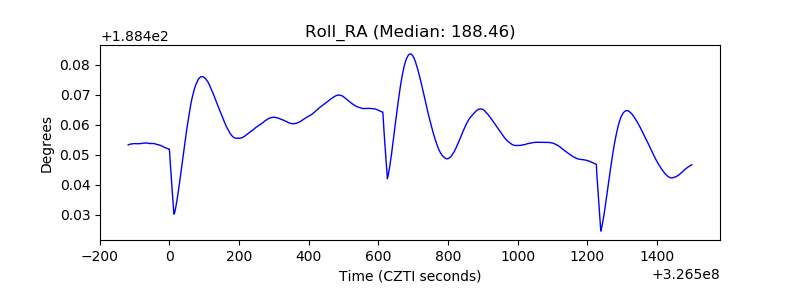 |
| Veto Counter | 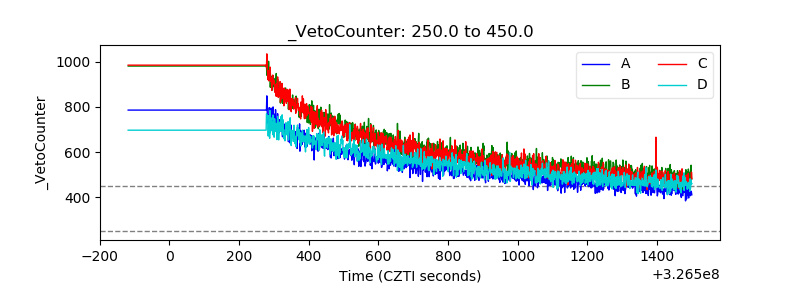 |