| Param | Original file | Final file |
|---|---|---|
| Filename | modeM0/AS1A08_003T16_9000003650cztM0_level2.fits | modeM0/AS1A08_003T16_9000003650cztM0_level2_quad_clean.evt |
| Size (bytes) | 459,593,280 | 309,654,720 |
| Size | 438.3 MB | 295.3 MB |
| Events in quadrant A | 2,888,050 | 1,657,576 |
| Events in quadrant B | 2,779,648 | 1,670,558 |
| Events in quadrant C | 2,753,362 | 1,546,717 |
| Events in quadrant D | 2,427,008 | 1,429,810 |
| Mode SS | |||
|---|---|---|---|
| Quadrant | BADHDUFLAG | Total packets | Discarded packets |
| A | 0 | 910 | 0 |
| B | 0 | 910 | 0 |
| C | 0 | 910 | 0 |
| D | 0 | 910 | 0 |
| Mode M0 | |||
|---|---|---|---|
| Quadrant | BADHDUFLAG | Total packets | Discarded packets |
| A | 0 | 93916 | 0 |
| B | 0 | 95213 | 0 |
| C | 0 | 108793 | 0 |
| D | 0 | 103127 | 0 |
| Mode M9 | |||
|---|---|---|---|
| Quadrant | BADHDUFLAG | Total packets | Discarded packets |
| A | 0 | 73 | 0 |
| B | 0 | 73 | 0 |
| C | 0 | 73 | 0 |
| D | 0 | 73 | 0 |
| Quadrant | Total seconds | Saturated seconds | Saturation percentage |
|---|---|---|---|
| A | 44733 | 667 | 1.491069% |
| B | 44733 | 763 | 1.705676% |
| C | 44733 | 1212 | 2.709409% |
| D | 44733 | 673 | 1.504482% |
Noise dominated data is calculated using 1-second bins in cleaned event files. If a bin has >2000 counts, and if more than 50% of those come from <1% of pixels, then it is considered to be noise-dominated and hence unusable.
| Quadrant | # 1 sec bins | Bins with >0 counts | Bins with >2000 counts | High rate bins dominated by noise | Noise dominated (total time) | Noise dominated (detector-on time) | Marked lightcurve |
|---|---|---|---|---|---|---|---|
| A | 52093 | 44732 | 0 | 0 | 0.00% | 0.00% | 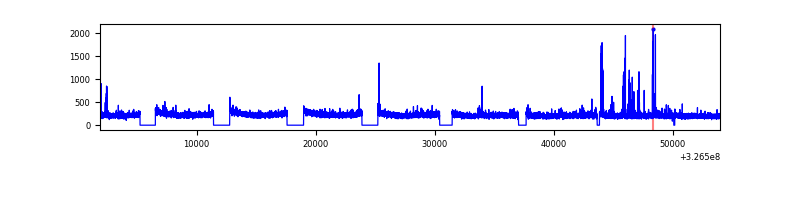 |
| B | 52093 | 44732 | 0 | 0 | 0.00% | 0.00% | 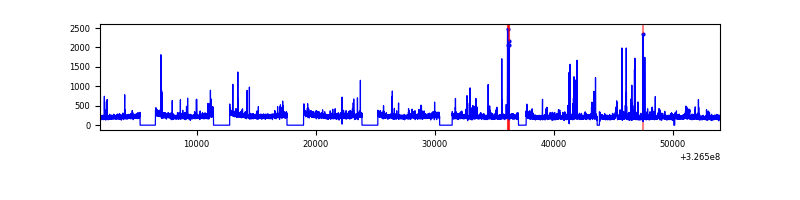 |
| C | 52093 | 44733 | 0 | 0 | 0.00% | 0.00% | 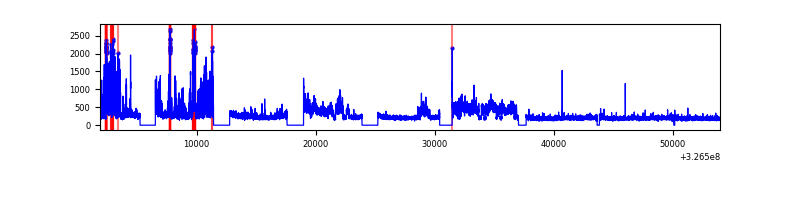 |
| D | 52093 | 44731 | 0 | 0 | 0.00% | 0.00% | 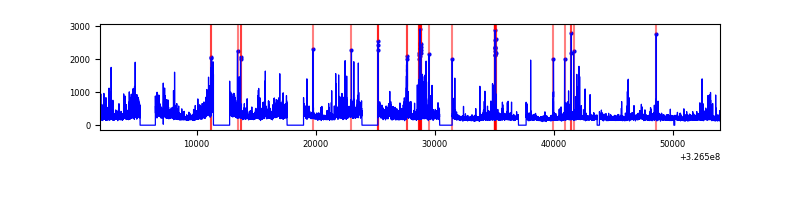 |
Top three noisy pixels from each quadrant. If the there are fewer than three noisy pixels in the level2.evt file, extra rows are filled as -1
| Pixel properties | Quadrant properties | ||||||
|---|---|---|---|---|---|---|---|
| Quadrant | DetID | PixID | Counts | Sigma | Mean | Median | Sigma |
| A | 0 | 29 | 2714 | 11.04 | 752 | 710 | 181.4 |
| A | 7 | 110 | 2368 | 9.14 | 752 | 710 | 181.4 |
| A | 9 | 19 | 2185 | 8.13 | 752 | 710 | 181.4 |
| B | 2 | 9 | 2256 | 10.63 | 735 | 703 | 146.0 |
| B | 2 | 8 | 1830 | 7.72 | 735 | 703 | 146.0 |
| B | 5 | 232 | 1814 | 7.61 | 735 | 703 | 146.0 |
| C | 1 | 81 | 2092 | 7.63 | 726 | 683 | 184.6 |
| C | 1 | 80 | 2074 | 7.53 | 726 | 683 | 184.6 |
| C | 3 | 126 | 1946 | 6.84 | 726 | 683 | 184.6 |
| D | 7 | 3 | 1725 | 6.02 | 691 | 630 | 182.0 |
| D | 10 | 189 | 1714 | 5.96 | 691 | 630 | 182.0 |
| D | 6 | 231 | 1698 | 5.87 | 691 | 630 | 182.0 |
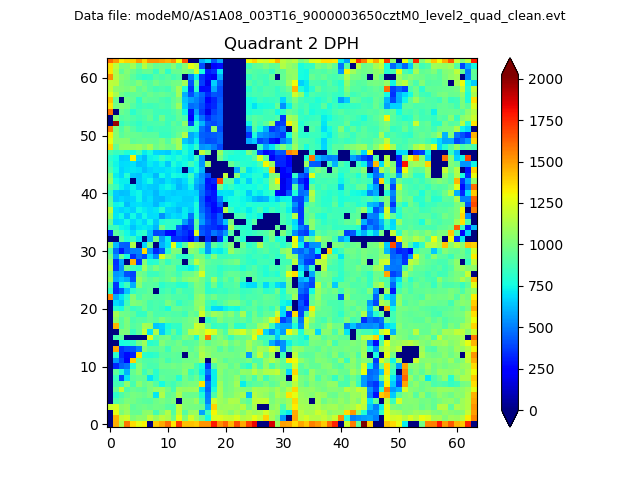
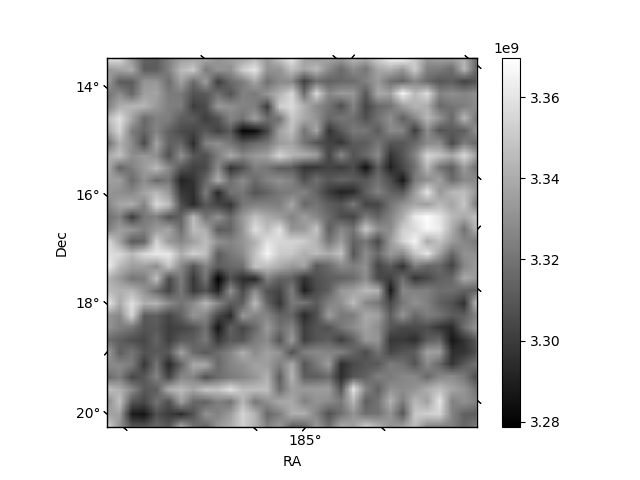
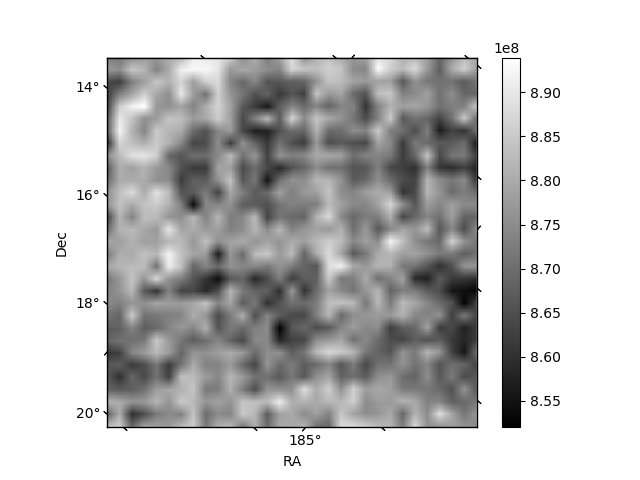
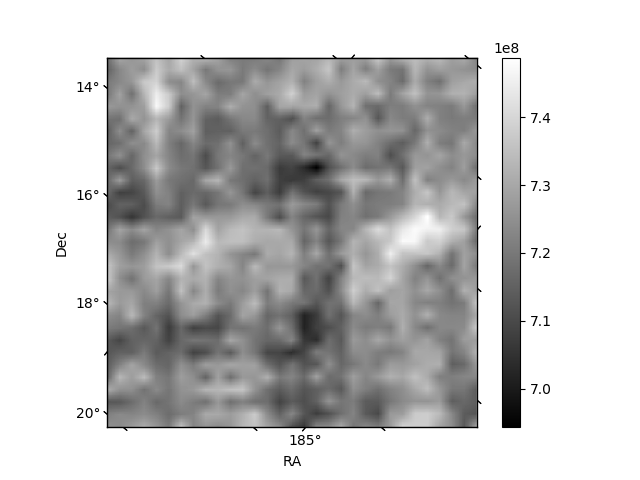
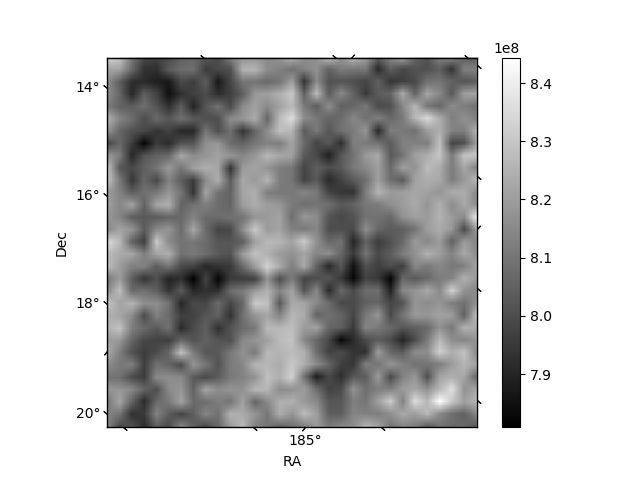
Histogram calculated using DETX and DETY for each event in the final _common_clean file
| Quadrant A | 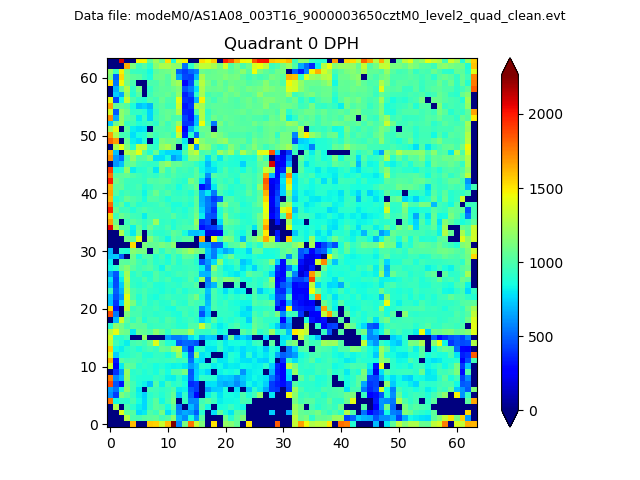 |
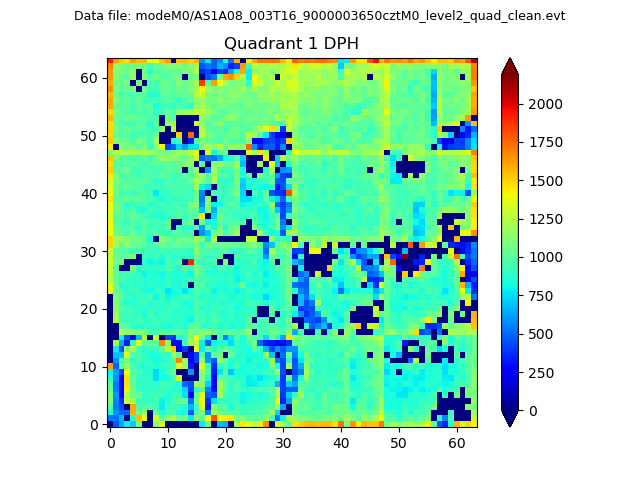 |
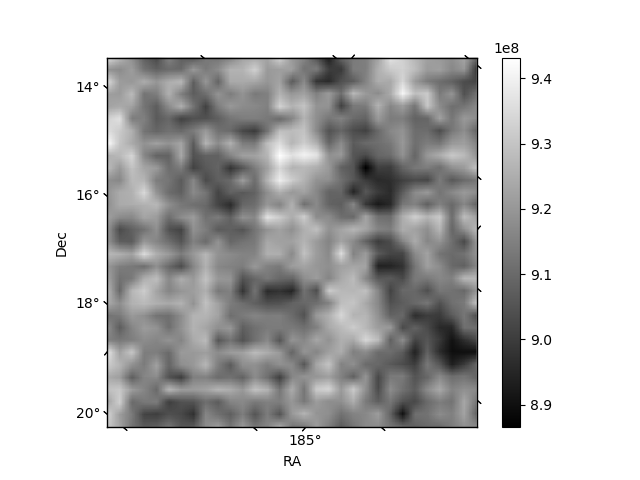
Quadrant B |
|---|---|---|---|
| Quadrant D | 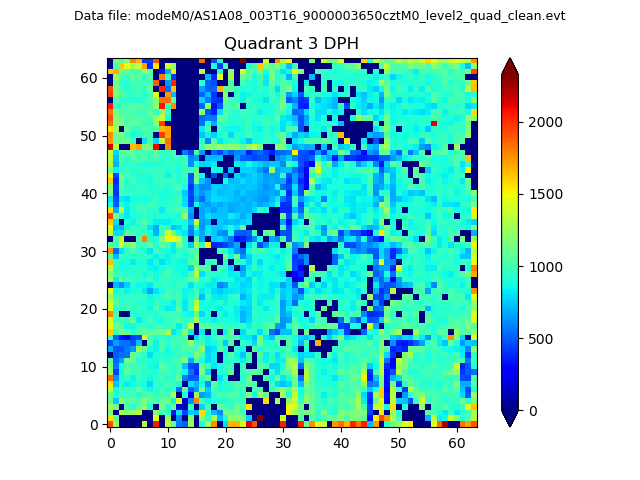 |
 |
Quadrant C |
| Plot type | Count rate plots | Images |
|---|---|---|
| Comparison with Poisson distribution Blue bars denote a histogram of data divided into 1 sec bins. Red curve is a Poisson curve with rate = median count rate of data. |
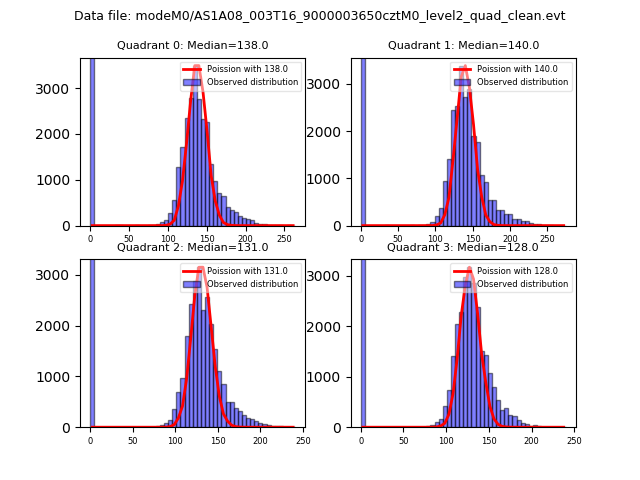 |
 |
| Quadrant-wise count rates Data is divided into 100 sec bins |
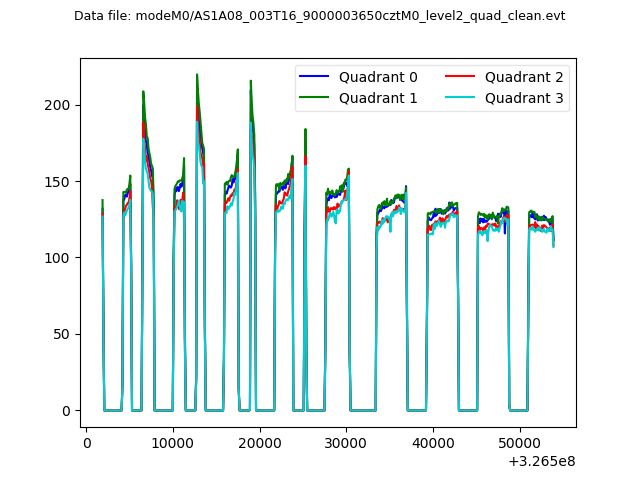 |
|
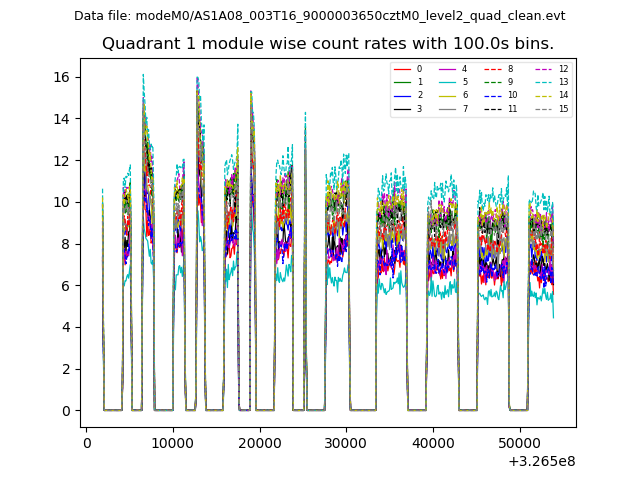
| Module-wise count rates for Quadrant A Data is divided into 100 sec bins |
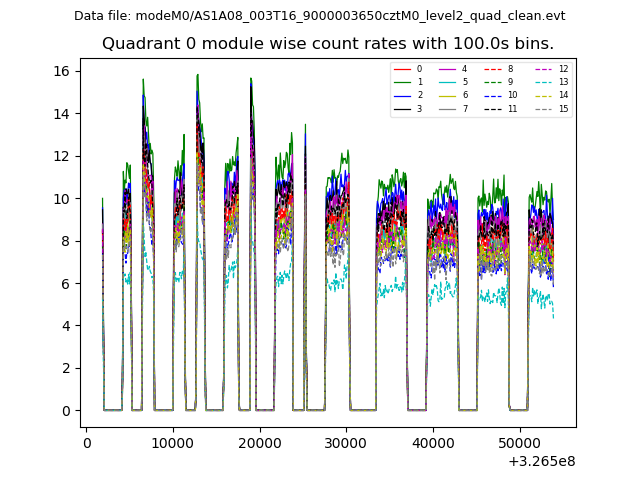 |
 |
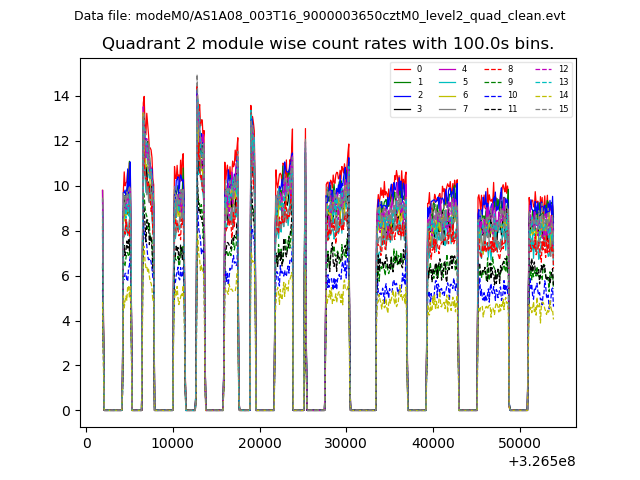
| Module-wise count rates for Quadrant B Data is divided into 100 sec bins |
 |
 |
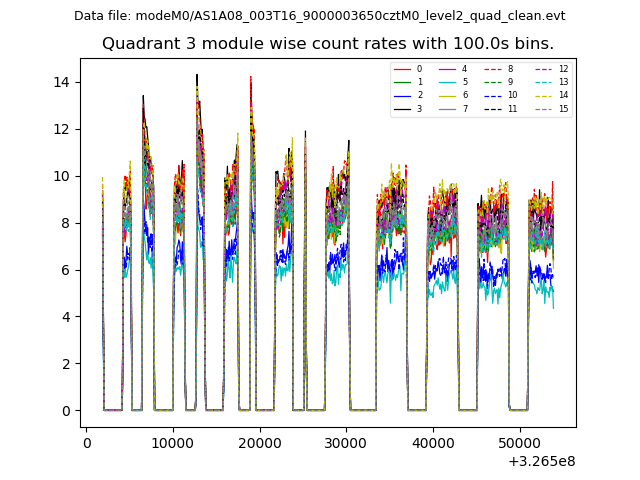
| Module-wise count rates for Quadrant C Data is divided into 100 sec bins |
 |
 |
| Module-wise count rates for Quadrant D Data is divided into 100 sec bins |
 |
 |
| Parameter | Plot |
|---|---|
| CZT HV Monitor | 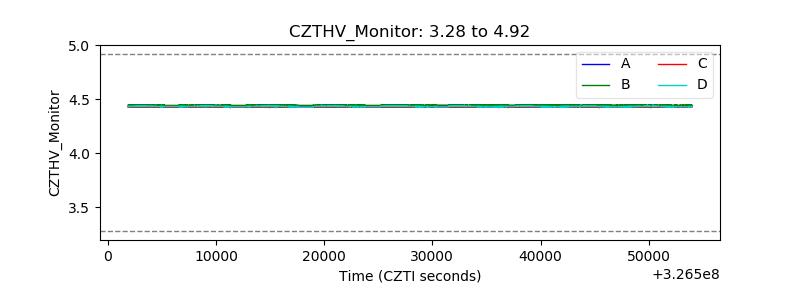 |
| D_VDD | 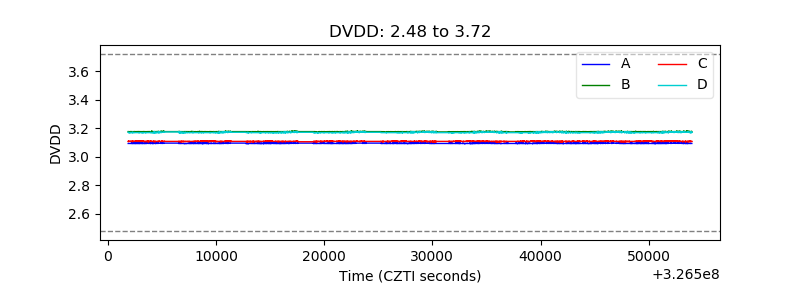 |
| Temperature 1 | 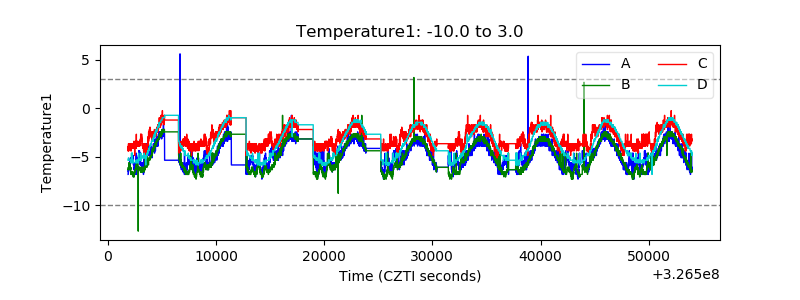 |
| Veto HV Monitor | 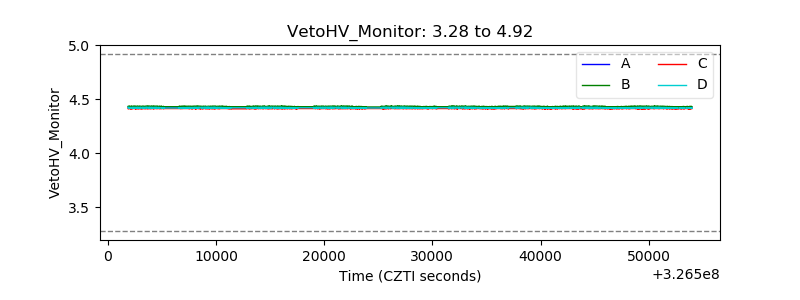 |
| Veto LLD | 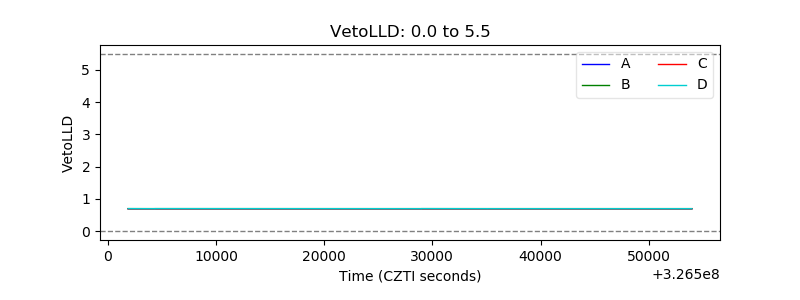 |
| Alpha Counter | 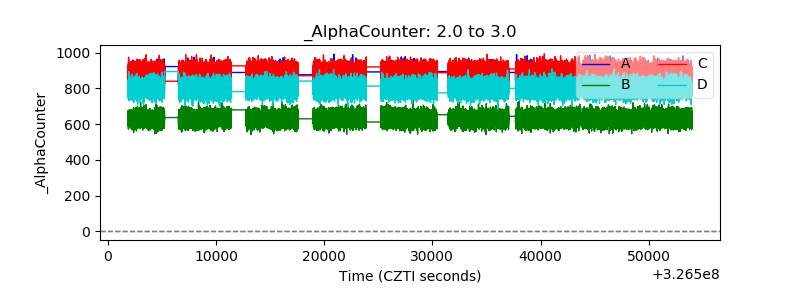 |
| _CPM_Rate | 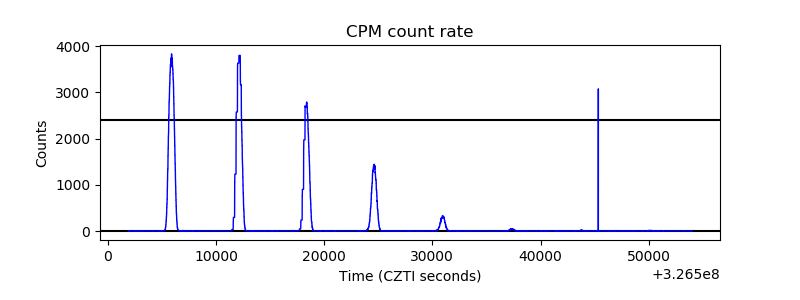 |
| CZT Counter | 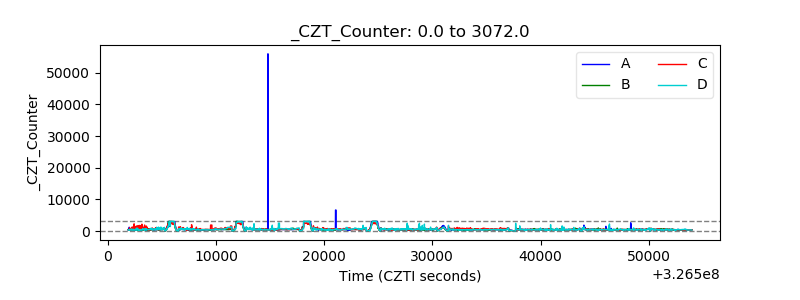 |
| +2.5 Volts monitor | 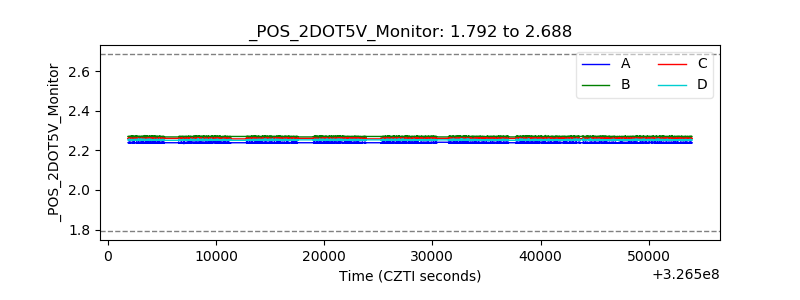 |
| +5 Volts monitor | 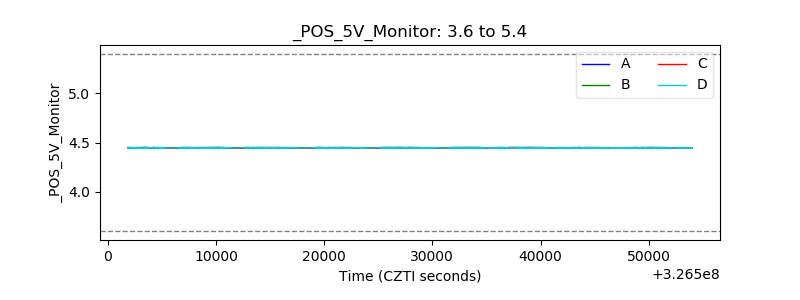 |
| _ROLL_ROT | 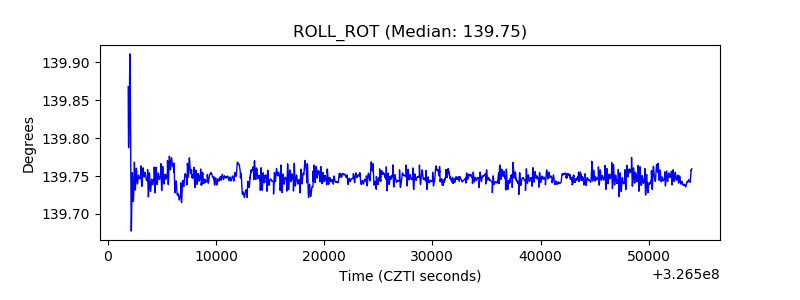 |
| _Roll_DEC | 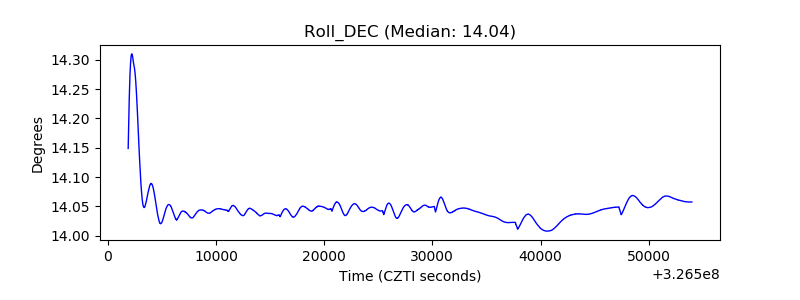 |
| _Roll_RA | 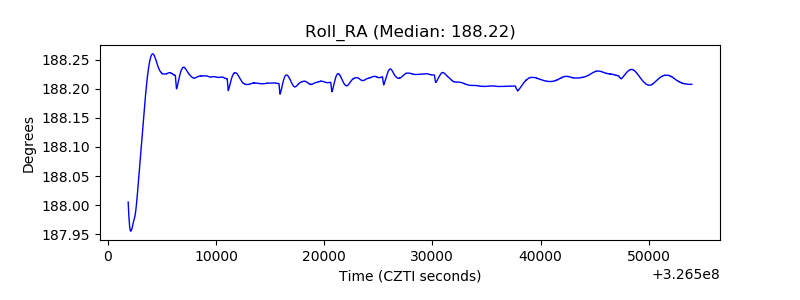 |
| Veto Counter | 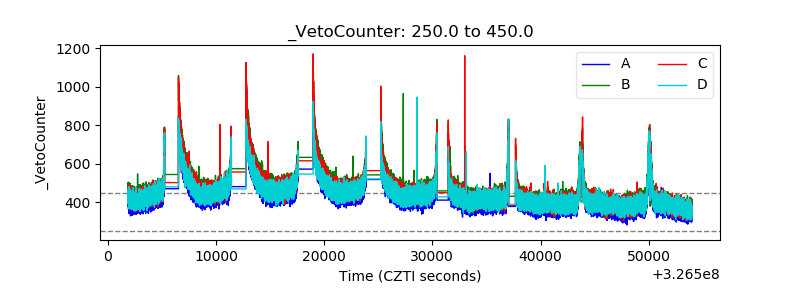 |