| Param | Original file | Final file |
|---|---|---|
| Filename | modeM0/AS1A08_003T16_9000003650_24909cztM0_level2.evt | modeM0/AS1A08_003T16_9000003650_24909cztM0_level2_quad_clean.evt |
| Size (bytes) | 375,140,160 | 59,103,360 |
| Size | 357.8 MB | 56.4 MB |
| Events in quadrant A | 2,361,737 | 375,294 |
| Events in quadrant B | 2,377,707 | 389,000 |
| Events in quadrant C | 3,519,007 | 354,747 |
| Events in quadrant D | 2,787,965 | 345,208 |
| Mode SS | |||
|---|---|---|---|
| Quadrant | BADHDUFLAG | Total packets | Discarded packets |
| A | 0 | 94 | 0 |
| B | 0 | 94 | 0 |
| C | 0 | 94 | 0 |
| D | 0 | 94 | 0 |
| Mode M0 | |||
|---|---|---|---|
| Quadrant | BADHDUFLAG | Total packets | Discarded packets |
| A | 0 | 9809 | 1 |
| B | 0 | 9846 | 1 |
| C | 0 | 13645 | 1 |
| D | 0 | 11477 | 1 |
| Mode M9 | |||
|---|---|---|---|
| Quadrant | BADHDUFLAG | Total packets | Discarded packets |
| A | 0 | 13 | 0 |
| B | 0 | 13 | 0 |
| C | 0 | 13 | 0 |
| D | 0 | 13 | 0 |
| Quadrant | Total seconds | Saturated seconds | Saturation percentage |
|---|---|---|---|
| A | 4630 | 19 | 0.410367% |
| B | 4630 | 21 | 0.453564% |
| C | 4630 | 163 | 3.520518% |
| D | 4630 | 21 | 0.453564% |
Noise dominated data is calculated using 1-second bins in cleaned event files. If a bin has >2000 counts, and if more than 50% of those come from <1% of pixels, then it is considered to be noise-dominated and hence unusable.
| Quadrant | # 1 sec bins | Bins with >0 counts | Bins with >2000 counts | High rate bins dominated by noise | Noise dominated (total time) | Noise dominated (detector-on time) | Marked lightcurve |
|---|---|---|---|---|---|---|---|
| A | 5920 | 4631 | 0 | 0 | 0.00% | 0.00% | 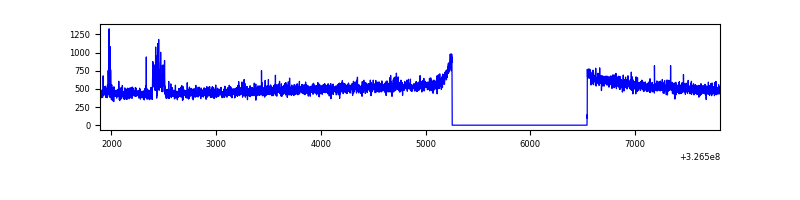 |
| B | 5920 | 4631 | 2 | 2 | 0.03% | 0.04% | 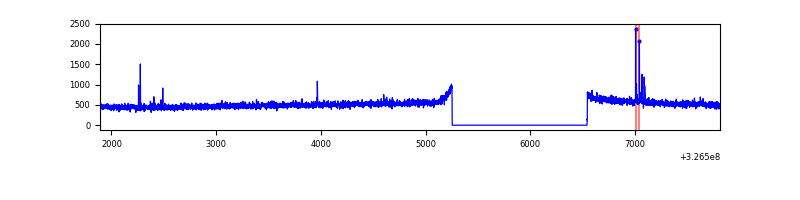 |
| C | 5920 | 4631 | 80 | 80 | 1.35% | 1.73% | 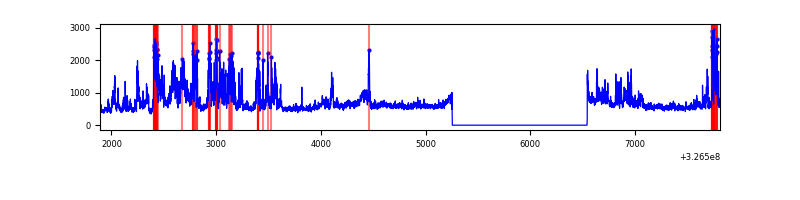 |
| D | 5920 | 4631 | 4 | 4 | 0.07% | 0.09% | 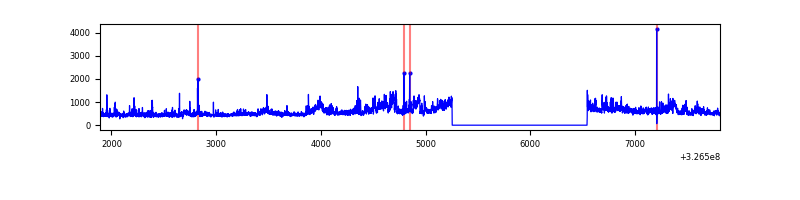 |
Top three noisy pixels from each quadrant. If the there are fewer than three noisy pixels in the level2.evt file, extra rows are filled as -1
| Pixel properties | Quadrant properties | ||||||
|---|---|---|---|---|---|---|---|
| Quadrant | DetID | PixID | Counts | Sigma | Mean | Median | Sigma |
| A | 15 | 223 | 37402 | 307.72 | 601 | 591 | 119.6 |
| A | 15 | 239 | 7693 | 59.37 | 601 | 591 | 119.6 |
| A | 13 | 254 | 7069 | 54.15 | 601 | 591 | 119.6 |
| B | 4 | 80 | 15248 | 127.46 | 602 | 588 | 115.0 |
| B | 12 | 111 | 13898 | 115.72 | 602 | 588 | 115.0 |
| B | 11 | 111 | 12388 | 102.6 | 602 | 588 | 115.0 |
| C | 7 | 247 | 1185774 | 8908.79 | 569 | 574 | 133.0 |
| C | 14 | 238 | 92683 | 692.36 | 569 | 574 | 133.0 |
| C | 2 | 16 | 13669 | 98.43 | 569 | 574 | 133.0 |
| D | 1 | 52 | 484159 | 3478.38 | 573 | 557 | 139.0 |
| D | 2 | 244 | 70522 | 503.23 | 573 | 557 | 139.0 |
| D | 8 | 195 | 48488 | 344.75 | 573 | 557 | 139.0 |
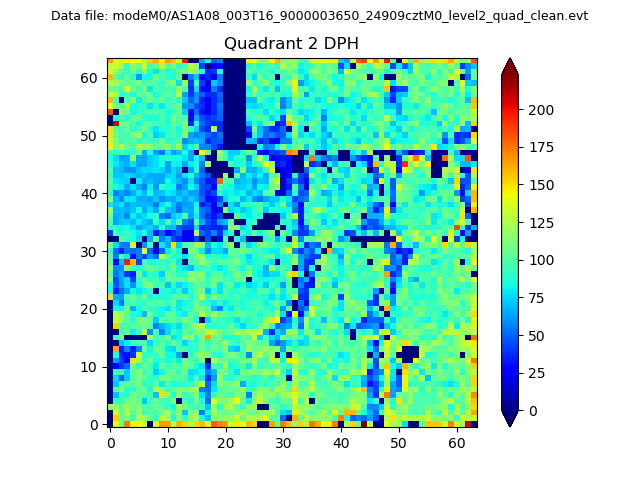
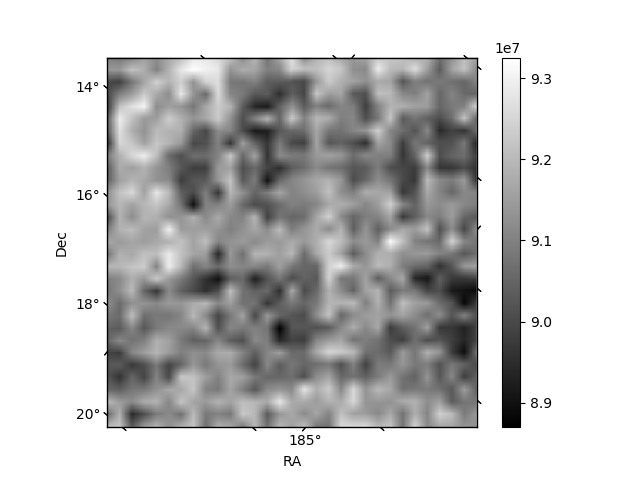
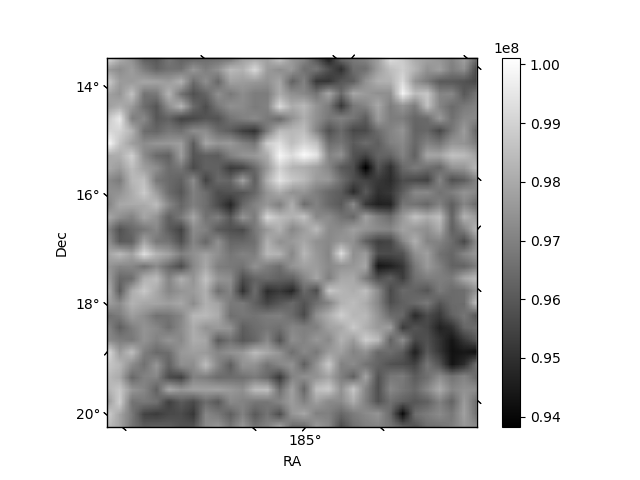
Histogram calculated using DETX and DETY for each event in the final _common_clean file
| Quadrant A |  |
 |
Quadrant B |
|---|---|---|---|
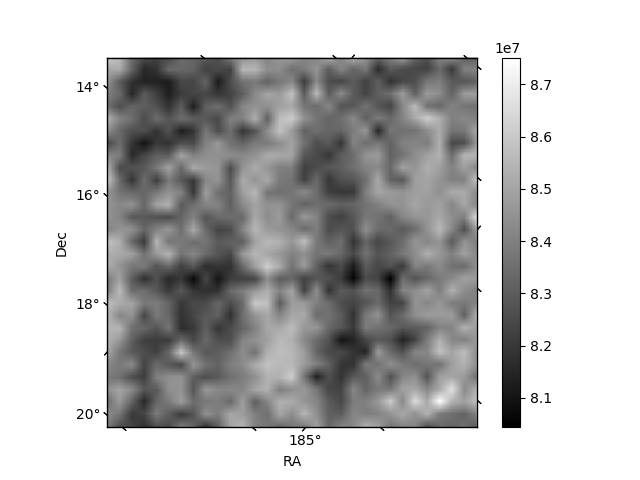
| Quadrant D | 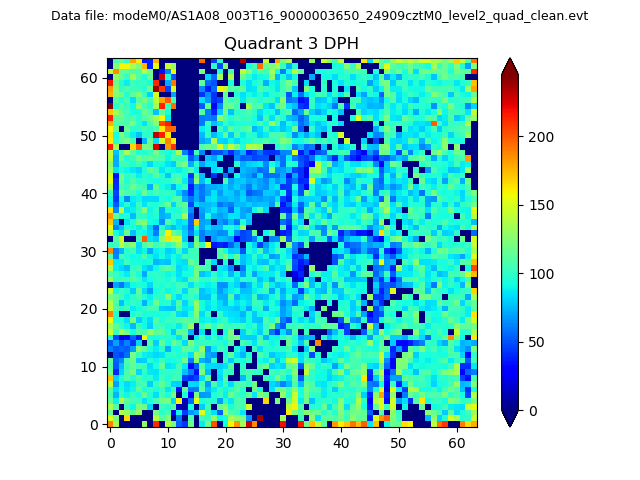 |
 |
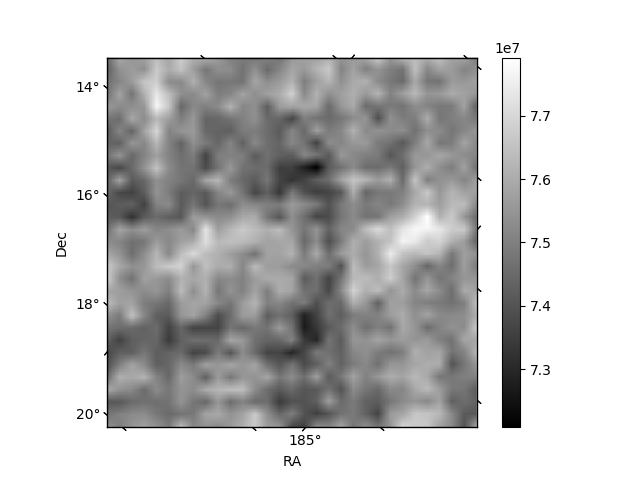
Quadrant C |
| Plot type | Count rate plots | Images |
|---|---|---|
| Comparison with Poisson distribution Blue bars denote a histogram of data divided into 1 sec bins. Red curve is a Poisson curve with rate = median count rate of data. |
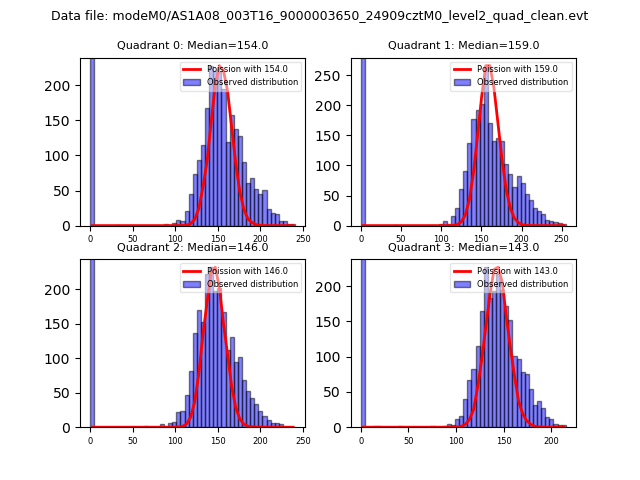 |
 |
| Quadrant-wise count rates Data is divided into 100 sec bins |
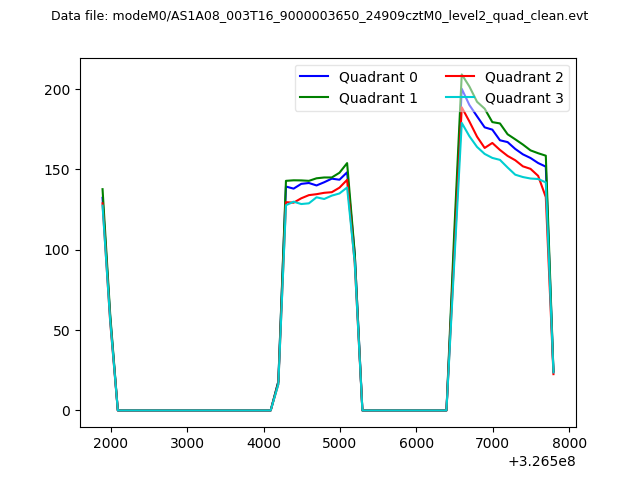 |
|
| Module-wise count rates for Quadrant A Data is divided into 100 sec bins |
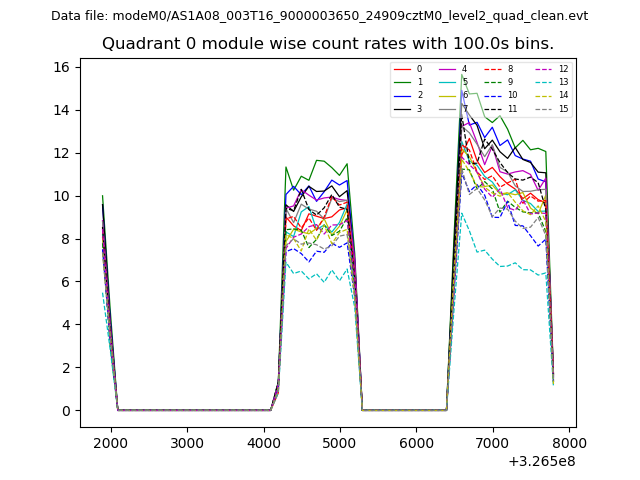 |
 |
| Module-wise count rates for Quadrant B Data is divided into 100 sec bins |
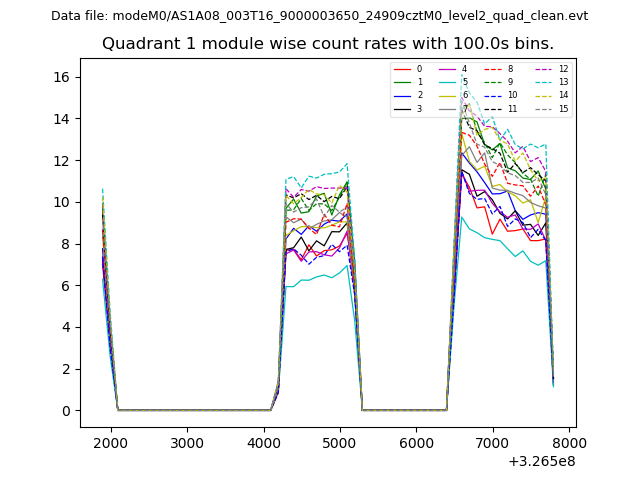 |
 |
| Module-wise count rates for Quadrant C Data is divided into 100 sec bins |
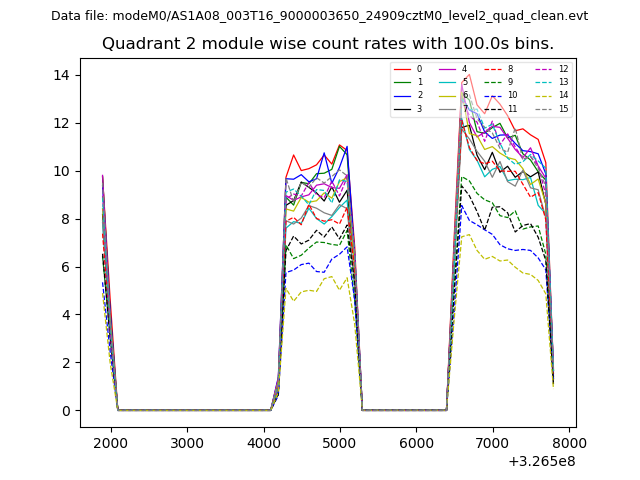 |
 |
| Module-wise count rates for Quadrant D Data is divided into 100 sec bins |
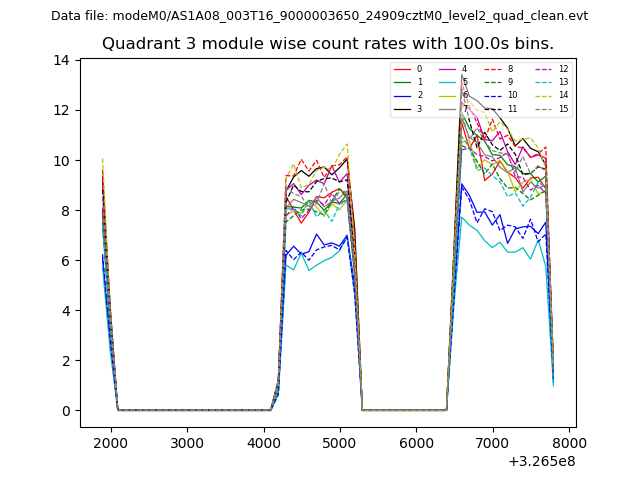 |
 |
| Parameter | Plot |
|---|---|
| CZT HV Monitor | 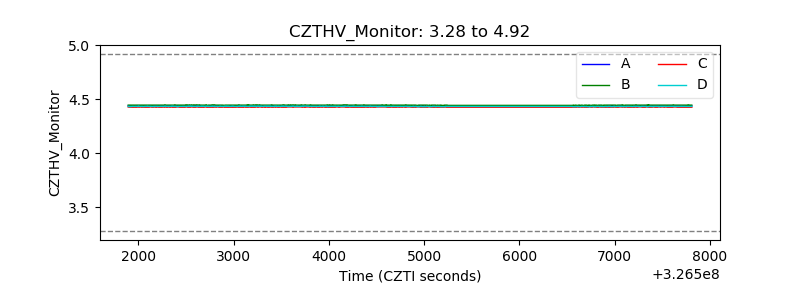 |
| D_VDD | 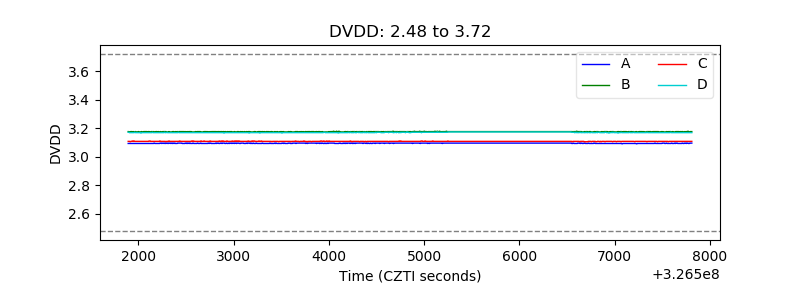 |
| Temperature 1 | 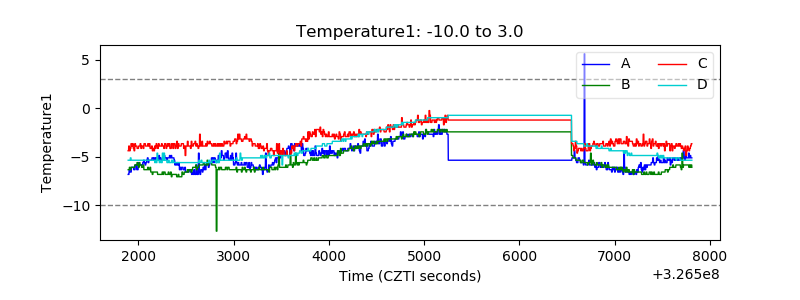 |
| Veto HV Monitor | 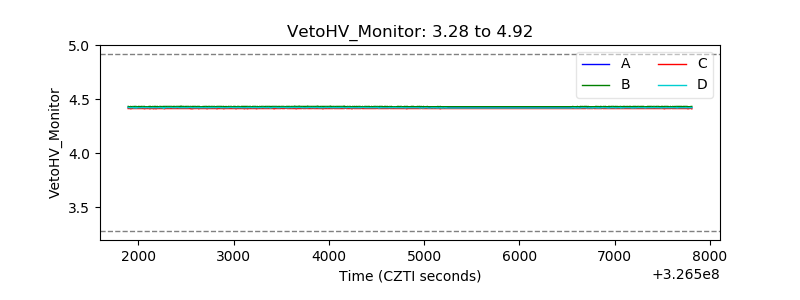 |
| Veto LLD |  |
| Alpha Counter | 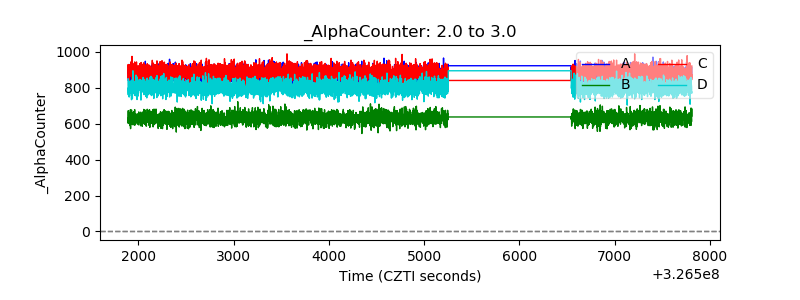 |
| _CPM_Rate | 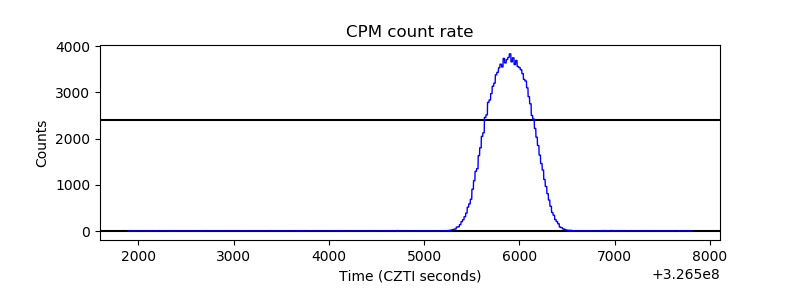 |
| CZT Counter | 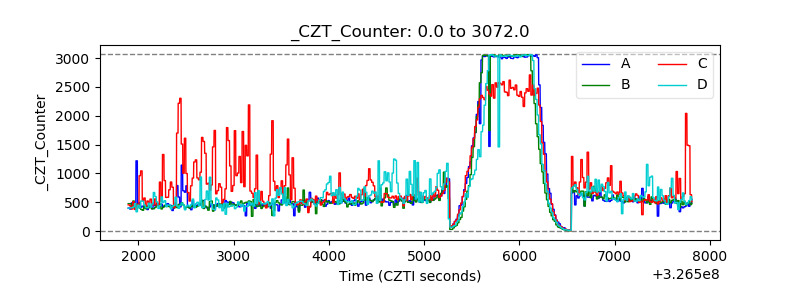 |
| +2.5 Volts monitor |  |
| +5 Volts monitor | 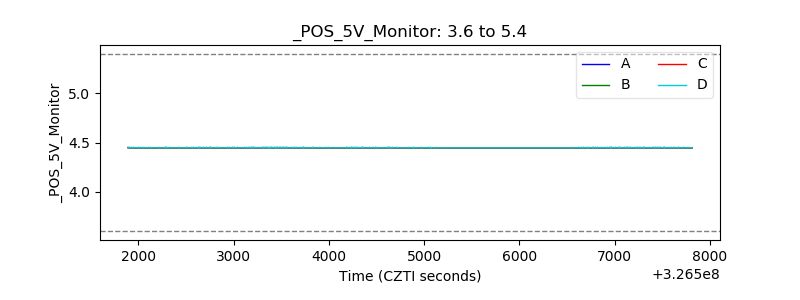 |
| _ROLL_ROT | 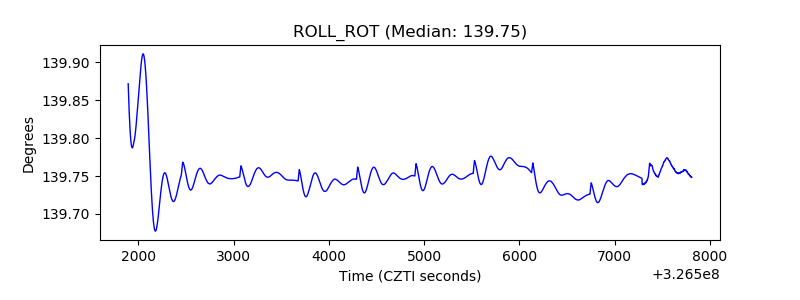 |
| _Roll_DEC | 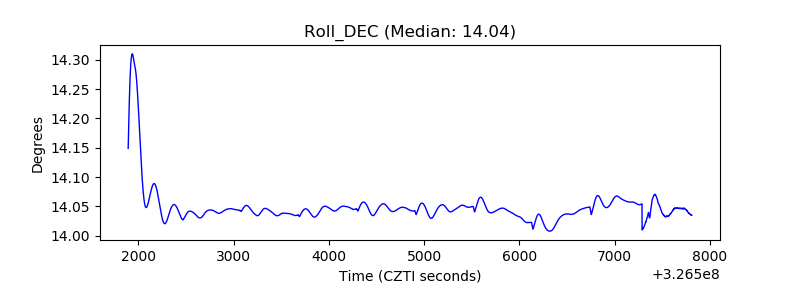 |
| _Roll_RA |  |
| Veto Counter | 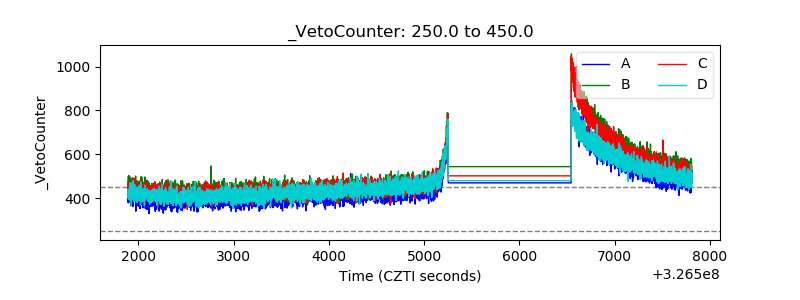 |