| Param | Original file | Final file |
|---|---|---|
| Filename | modeM0/AS1A08_003T16_9000003650_24910cztM0_level2.evt | modeM0/AS1A08_003T16_9000003650_24910cztM0_level2_quad_clean.evt |
| Size (bytes) | 508,610,880 | 90,020,160 |
| Size | 485.0 MB | 85.8 MB |
| Events in quadrant A | 3,229,444 | 592,387 |
| Events in quadrant B | 3,349,130 | 613,863 |
| Events in quadrant C | 4,476,979 | 553,447 |
| Events in quadrant D | 3,928,190 | 534,353 |
| Mode SS | |||
|---|---|---|---|
| Quadrant | BADHDUFLAG | Total packets | Discarded packets |
| A | 0 | 126 | 0 |
| B | 0 | 126 | 0 |
| C | 0 | 126 | 0 |
| D | 0 | 126 | 0 |
| Mode M0 | |||
|---|---|---|---|
| Quadrant | BADHDUFLAG | Total packets | Discarded packets |
| A | 0 | 13202 | 2 |
| B | 0 | 13603 | 2 |
| C | 0 | 17346 | 2 |
| D | 0 | 15876 | 2 |
| Mode M9 | |||
|---|---|---|---|
| Quadrant | BADHDUFLAG | Total packets | Discarded packets |
| A | 0 | 21 | 0 |
| B | 0 | 22 | 0 |
| C | 0 | 22 | 0 |
| D | 0 | 22 | 0 |
| Quadrant | Total seconds | Saturated seconds | Saturation percentage |
|---|---|---|---|
| A | 6189 | 27 | 0.436258% |
| B | 6189 | 40 | 0.646308% |
| C | 6189 | 291 | 4.701890% |
| D | 6189 | 86 | 1.389562% |
Noise dominated data is calculated using 1-second bins in cleaned event files. If a bin has >2000 counts, and if more than 50% of those come from <1% of pixels, then it is considered to be noise-dominated and hence unusable.
| Quadrant | # 1 sec bins | Bins with >0 counts | Bins with >2000 counts | High rate bins dominated by noise | Noise dominated (total time) | Noise dominated (detector-on time) | Marked lightcurve |
|---|---|---|---|---|---|---|---|
| A | 7549 | 6190 | 0 | 0 | 0.00% | 0.00% | 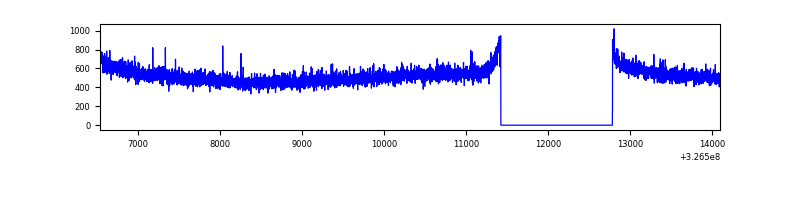 |
| B | 7549 | 6190 | 2 | 2 | 0.03% | 0.03% | 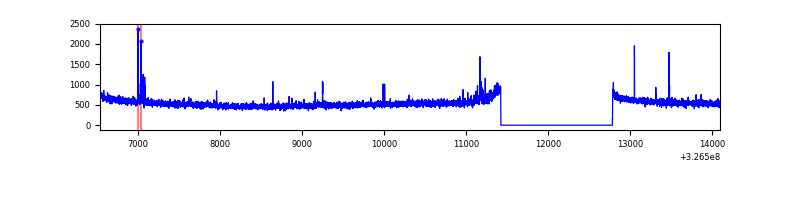 |
| C | 7549 | 6190 | 93 | 93 | 1.23% | 1.50% | 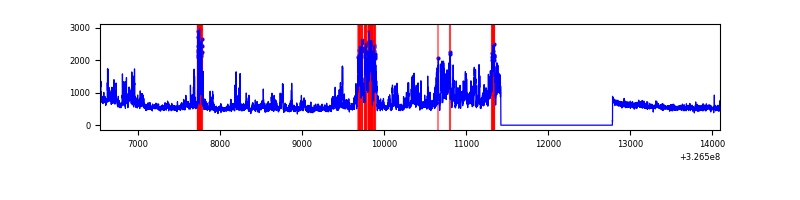 |
| D | 7549 | 6190 | 32 | 32 | 0.42% | 0.52% | 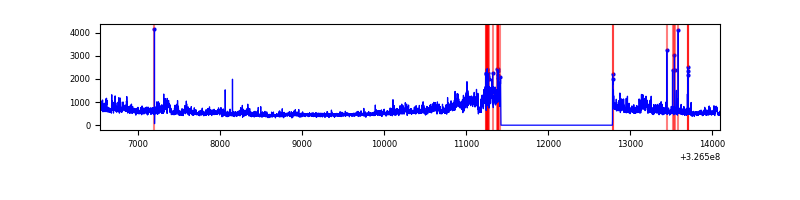 |
Top three noisy pixels from each quadrant. If the there are fewer than three noisy pixels in the level2.evt file, extra rows are filled as -1
| Pixel properties | Quadrant properties | ||||||
|---|---|---|---|---|---|---|---|
| Quadrant | DetID | PixID | Counts | Sigma | Mean | Median | Sigma |
| A | 13 | 254 | 9581 | 52.34 | 837 | 823 | 167.3 |
| A | 3 | 137 | 7172 | 37.94 | 837 | 823 | 167.3 |
| A | 0 | 226 | 7152 | 37.82 | 837 | 823 | 167.3 |
| B | 0 | 189 | 28816 | 176.51 | 840 | 821 | 158.6 |
| B | 4 | 80 | 22688 | 137.87 | 840 | 821 | 158.6 |
| B | 12 | 111 | 18516 | 111.57 | 840 | 821 | 158.6 |
| C | 7 | 247 | 1256292 | 6849.04 | 789 | 796 | 183.3 |
| C | 14 | 238 | 128303 | 695.58 | 789 | 796 | 183.3 |
| C | 2 | 16 | 7335 | 35.67 | 789 | 796 | 183.3 |
| D | 1 | 52 | 692409 | 3624.42 | 790 | 769 | 190.8 |
| D | 8 | 195 | 151750 | 791.19 | 790 | 769 | 190.8 |
| D | 2 | 244 | 77417 | 401.66 | 790 | 769 | 190.8 |
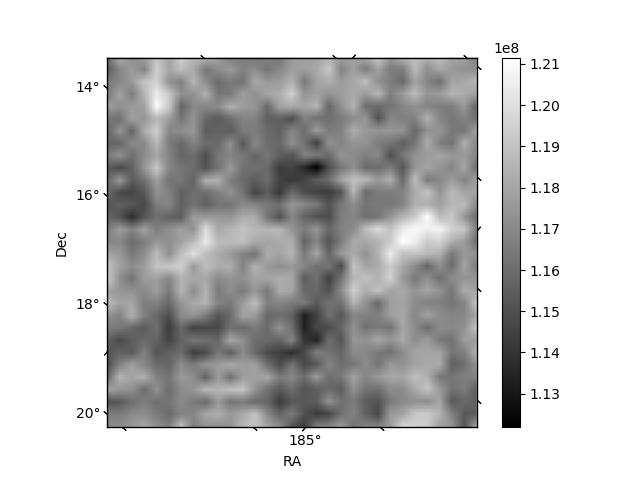
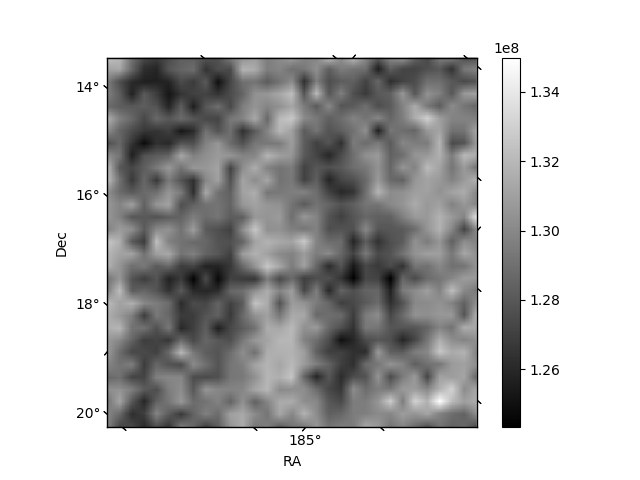
Histogram calculated using DETX and DETY for each event in the final _common_clean file
| Quadrant A | 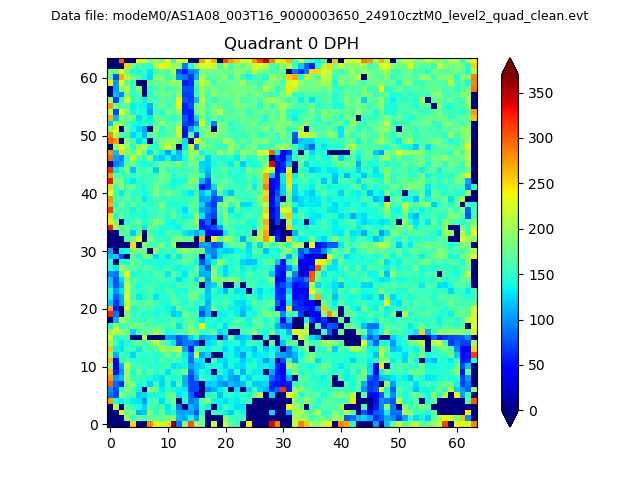 |
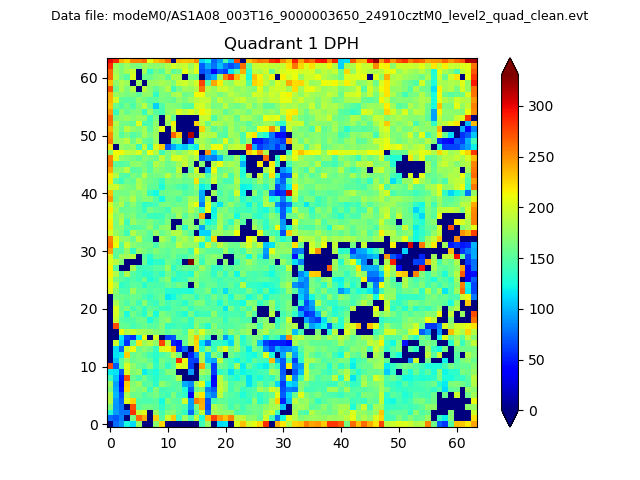 |
Quadrant B |
|---|---|---|---|
| Quadrant D |  |
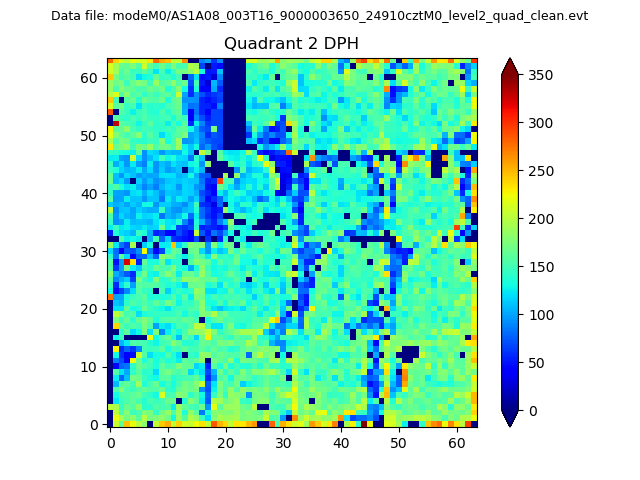 |
Quadrant C |
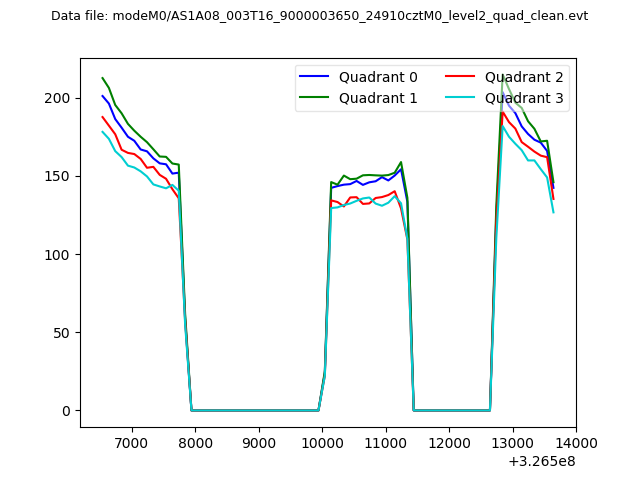
| Plot type | Count rate plots | Images |
|---|---|---|
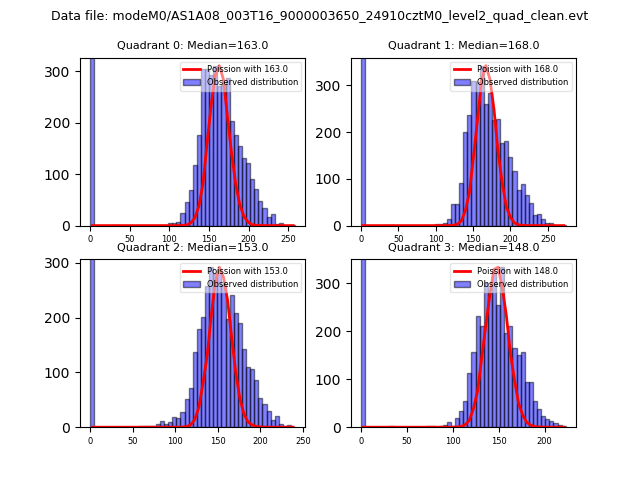
| Comparison with Poisson distribution Blue bars denote a histogram of data divided into 1 sec bins. Red curve is a Poisson curve with rate = median count rate of data. |
 |
 |
| Quadrant-wise count rates Data is divided into 100 sec bins |
 |
|
| Module-wise count rates for Quadrant A Data is divided into 100 sec bins |
 |
 |
| Module-wise count rates for Quadrant B Data is divided into 100 sec bins |
 |
 |
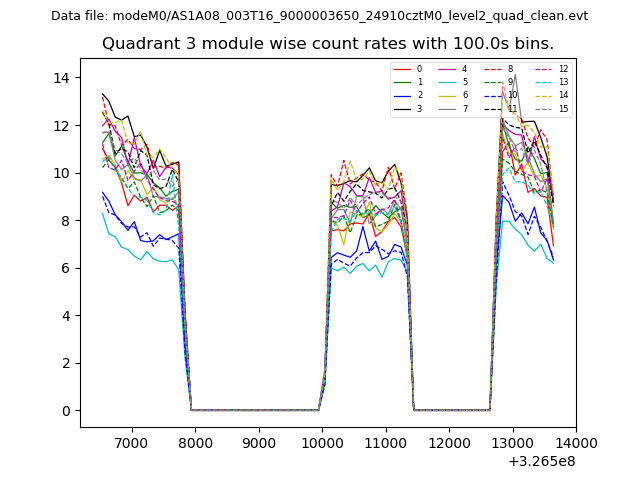
| Module-wise count rates for Quadrant C Data is divided into 100 sec bins |
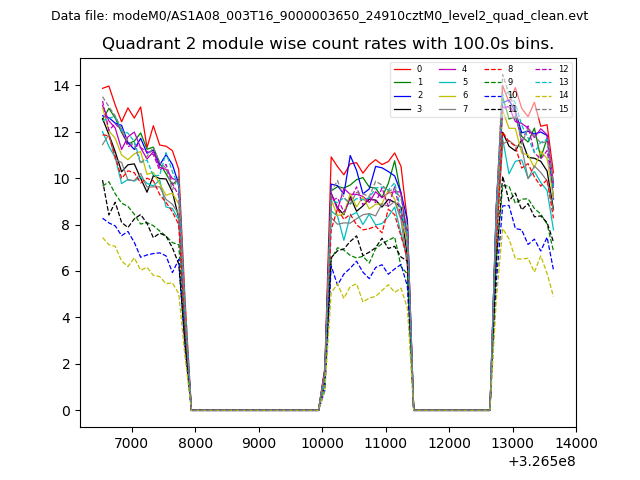 |
 |
| Module-wise count rates for Quadrant D Data is divided into 100 sec bins |
 |
 |
| Parameter | Plot |
|---|---|
| CZT HV Monitor |  |
| D_VDD | 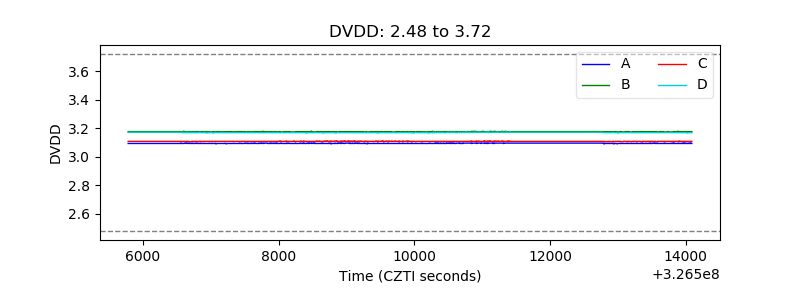 |
| Temperature 1 | 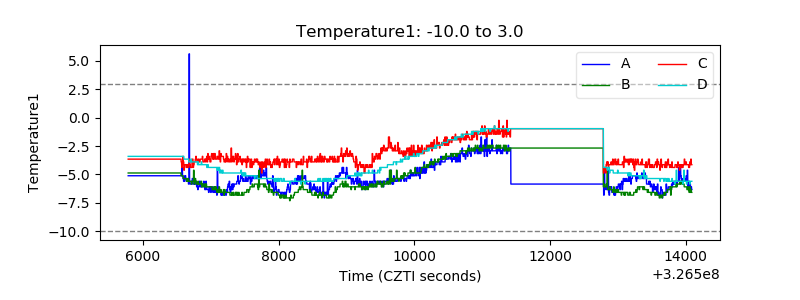 |
| Veto HV Monitor | 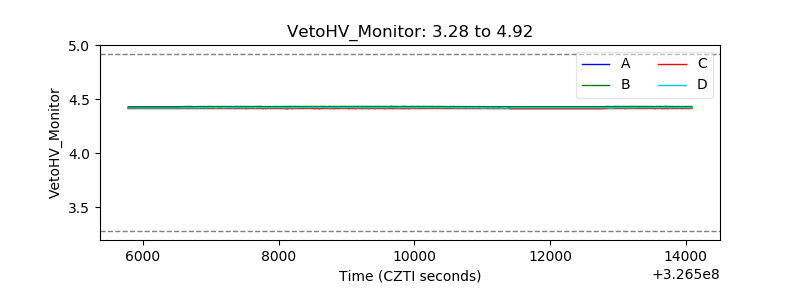 |
| Veto LLD | 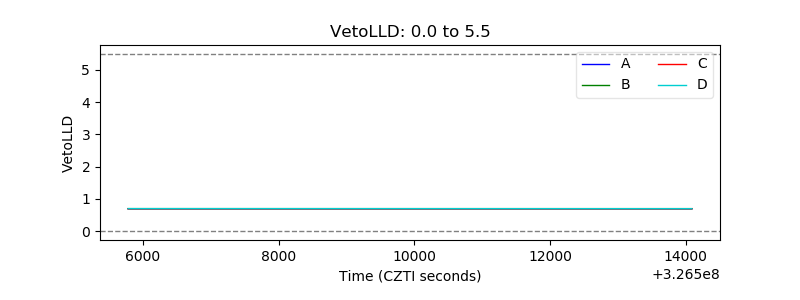 |
| Alpha Counter | 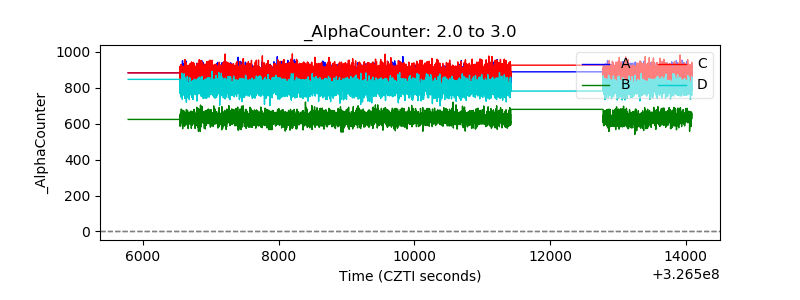 |
| _CPM_Rate | 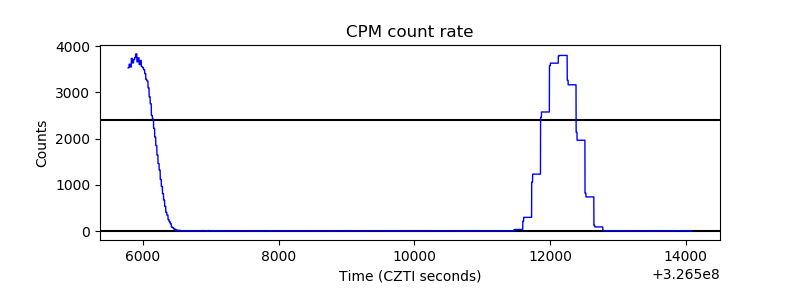 |
| CZT Counter | 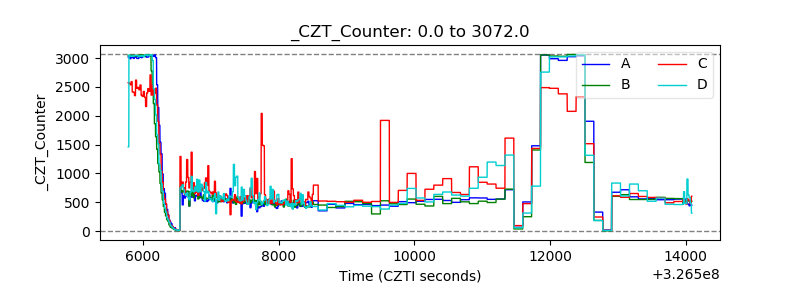 |
| +2.5 Volts monitor |  |
| +5 Volts monitor | 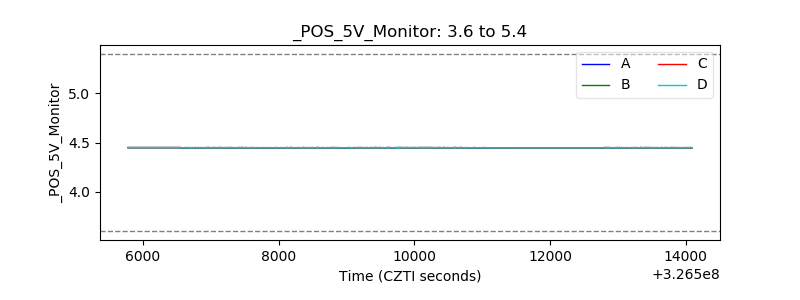 |
| _ROLL_ROT | 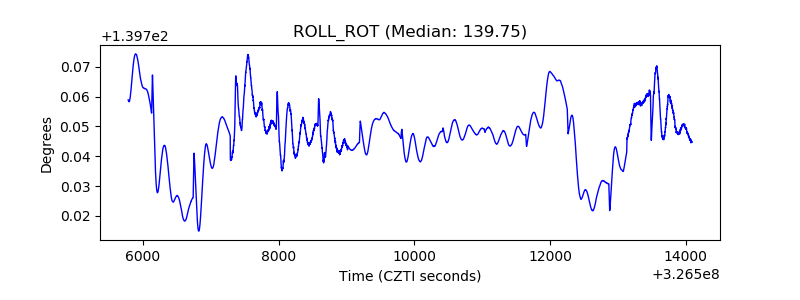 |
| _Roll_DEC | 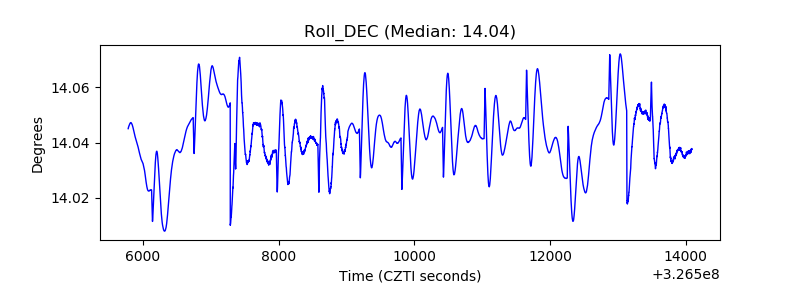 |
| _Roll_RA | 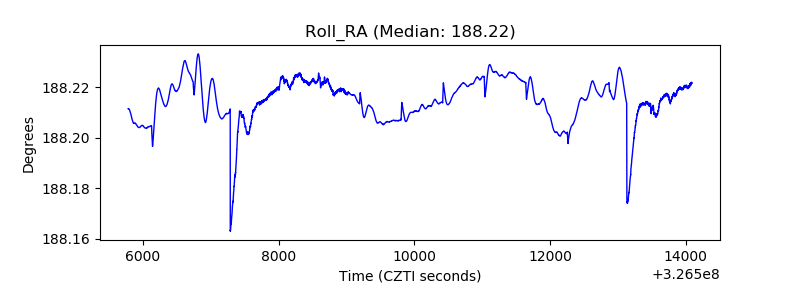 |
| Veto Counter | 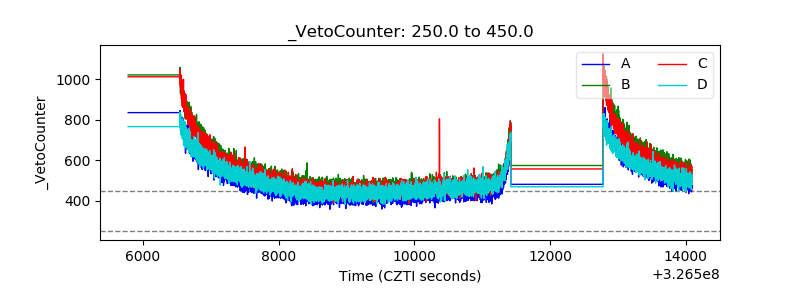 |