| Param | Original file | Final file |
|---|---|---|
| Filename | modeM0/AS1A08_003T16_9000003650_24911cztM0_level2.evt | modeM0/AS1A08_003T16_9000003650_24911cztM0_level2_quad_clean.evt |
| Size (bytes) | 461,914,560 | 76,916,160 |
| Size | 440.5 MB | 73.4 MB |
| Events in quadrant A | 3,154,467 | 490,999 |
| Events in quadrant B | 3,253,674 | 507,859 |
| Events in quadrant C | 3,555,736 | 464,032 |
| Events in quadrant D | 3,619,304 | 448,199 |
| Mode SS | |||
|---|---|---|---|
| Quadrant | BADHDUFLAG | Total packets | Discarded packets |
| A | 0 | 122 | 0 |
| B | 0 | 122 | 0 |
| C | 0 | 122 | 0 |
| D | 0 | 122 | 0 |
| Mode M0 | |||
|---|---|---|---|
| Quadrant | BADHDUFLAG | Total packets | Discarded packets |
| A | 0 | 12729 | 1 |
| B | 0 | 13124 | 1 |
| C | 0 | 14197 | 1 |
| D | 0 | 14626 | 1 |
| Mode M9 | |||
|---|---|---|---|
| Quadrant | BADHDUFLAG | Total packets | Discarded packets |
| A | 0 | 14 | 0 |
| B | 0 | 14 | 0 |
| C | 0 | 14 | 0 |
| D | 0 | 14 | 0 |
| Quadrant | Total seconds | Saturated seconds | Saturation percentage |
|---|---|---|---|
| A | 5981 | 12 | 0.200635% |
| B | 5981 | 40 | 0.668784% |
| C | 5981 | 84 | 1.404447% |
| D | 5982 | 44 | 0.735540% |
Noise dominated data is calculated using 1-second bins in cleaned event files. If a bin has >2000 counts, and if more than 50% of those come from <1% of pixels, then it is considered to be noise-dominated and hence unusable.
| Quadrant | # 1 sec bins | Bins with >0 counts | Bins with >2000 counts | High rate bins dominated by noise | Noise dominated (total time) | Noise dominated (detector-on time) | Marked lightcurve |
|---|---|---|---|---|---|---|---|
| A | 7371 | 5982 | 0 | 0 | 0.00% | 0.00% | 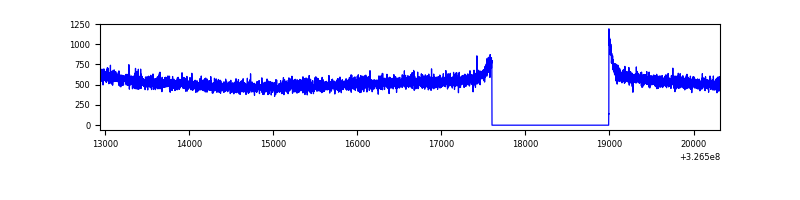 |
| B | 7371 | 5982 | 0 | 0 | 0.00% | 0.00% | 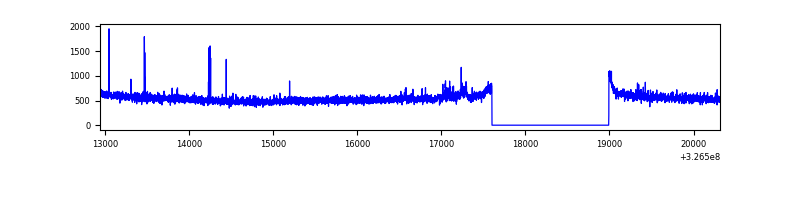 |
| C | 7371 | 5982 | 1 | 1 | 0.01% | 0.02% | 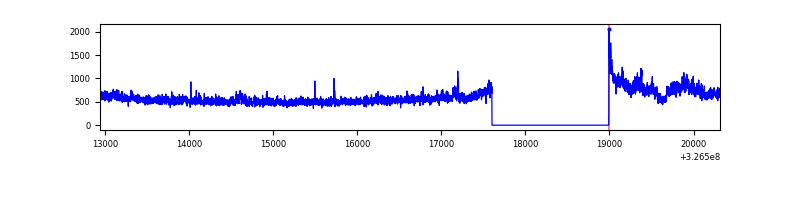 |
| D | 7372 | 5983 | 22 | 22 | 0.30% | 0.37% | 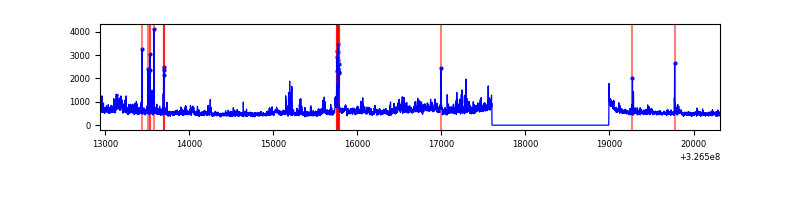 |
Top three noisy pixels from each quadrant. If the there are fewer than three noisy pixels in the level2.evt file, extra rows are filled as -1
| Pixel properties | Quadrant properties | ||||||
|---|---|---|---|---|---|---|---|
| Quadrant | DetID | PixID | Counts | Sigma | Mean | Median | Sigma |
| A | 13 | 254 | 9592 | 53.24 | 818 | 805 | 165.0 |
| A | 3 | 137 | 7036 | 37.75 | 818 | 805 | 165.0 |
| A | 0 | 226 | 6897 | 36.91 | 818 | 805 | 165.0 |
| B | 0 | 189 | 23816 | 151.09 | 818 | 799 | 152.3 |
| B | 12 | 111 | 18045 | 113.21 | 818 | 799 | 152.3 |
| B | 4 | 80 | 17598 | 110.27 | 818 | 799 | 152.3 |
| C | 7 | 247 | 389069 | 2186.18 | 773 | 779 | 177.6 |
| C | 14 | 238 | 128228 | 717.57 | 773 | 779 | 177.6 |
| C | 2 | 16 | 13549 | 71.9 | 773 | 779 | 177.6 |
| D | 1 | 52 | 356166 | 1923.8 | 772 | 752 | 184.7 |
| D | 2 | 244 | 190604 | 1027.64 | 772 | 752 | 184.7 |
| D | 8 | 195 | 125796 | 676.84 | 772 | 752 | 184.7 |
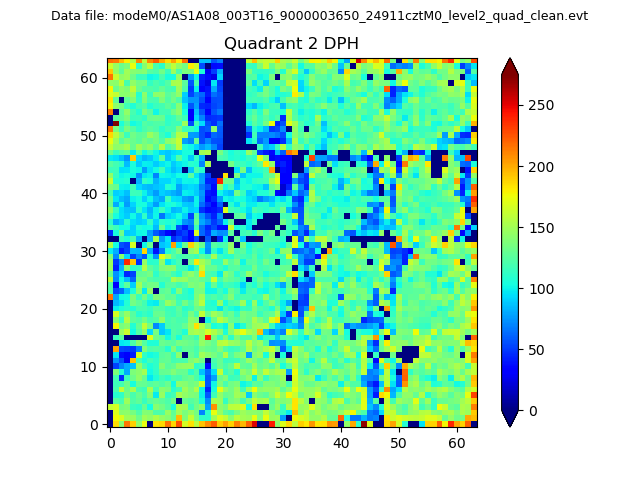
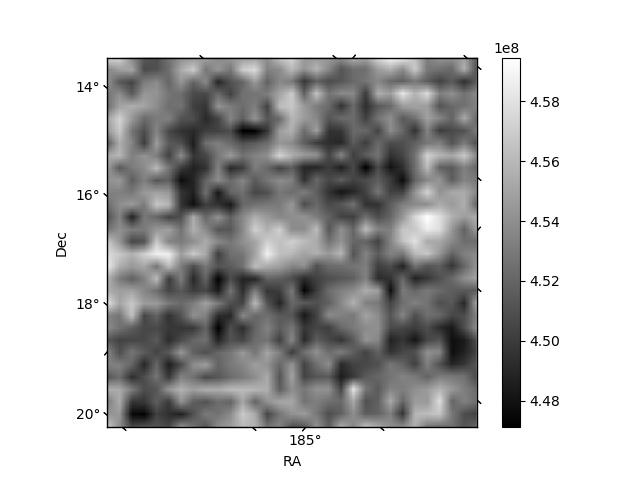
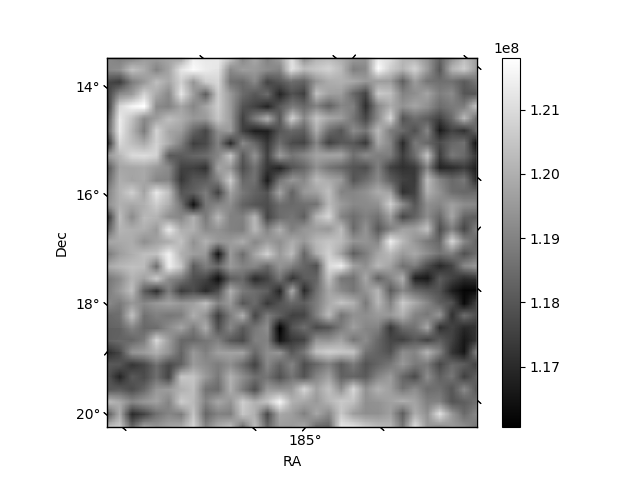
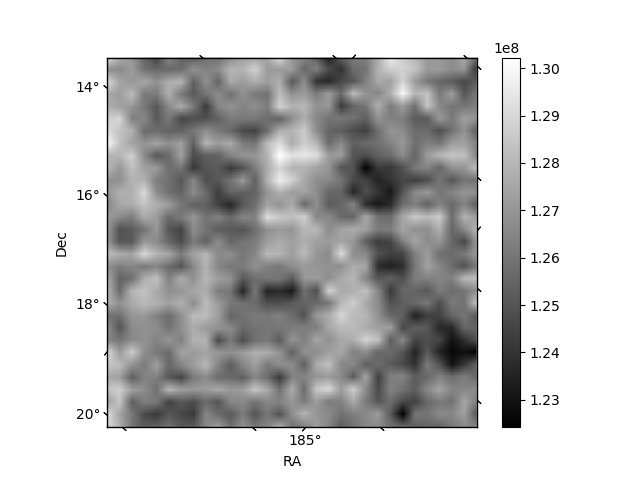
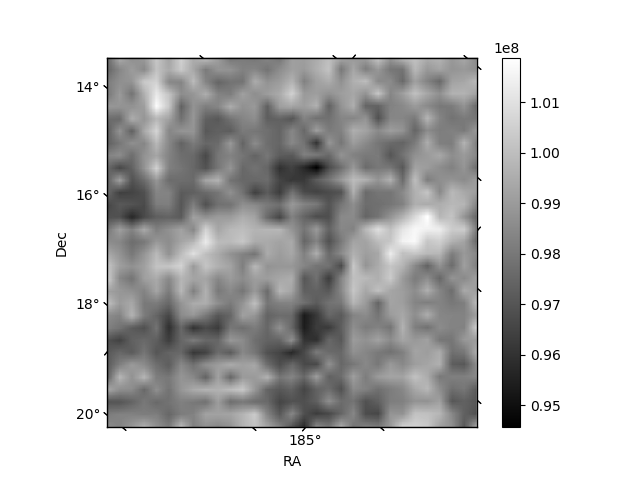
Histogram calculated using DETX and DETY for each event in the final _common_clean file
| Quadrant A |  |
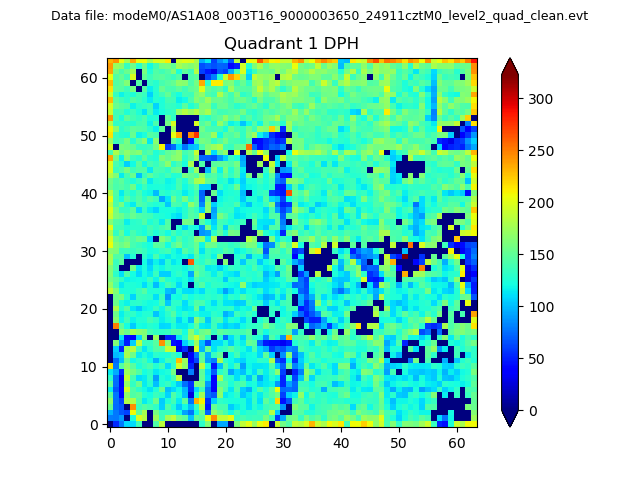 |
Quadrant B |
|---|---|---|---|
| Quadrant D | 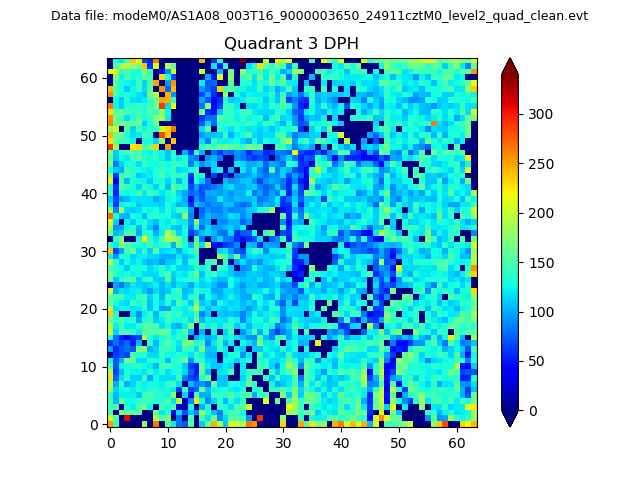 |
 |
Quadrant C |
| Plot type | Count rate plots | Images |
|---|---|---|
| Comparison with Poisson distribution Blue bars denote a histogram of data divided into 1 sec bins. Red curve is a Poisson curve with rate = median count rate of data. |
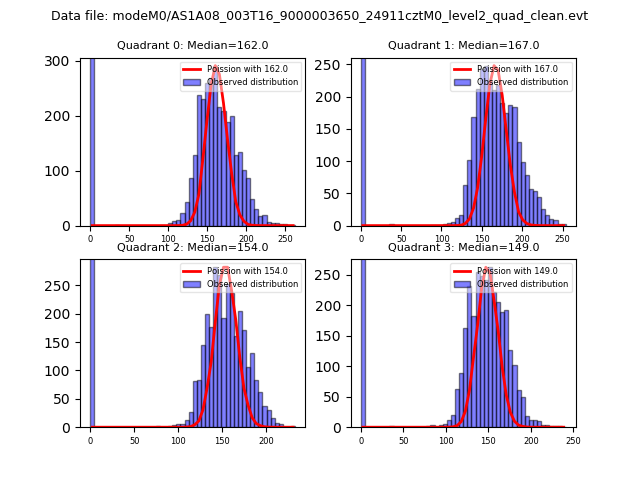 |
 |
| Quadrant-wise count rates Data is divided into 100 sec bins |
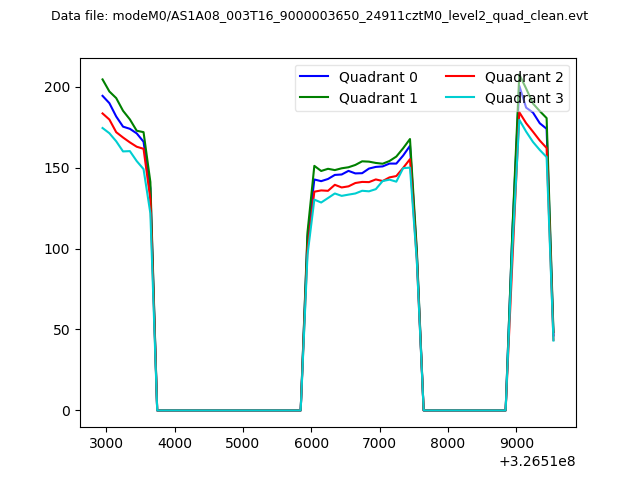 |
|
| Module-wise count rates for Quadrant A Data is divided into 100 sec bins |
 |
 |
| Module-wise count rates for Quadrant B Data is divided into 100 sec bins |
 |
 |
| Module-wise count rates for Quadrant C Data is divided into 100 sec bins |
 |
 |
| Module-wise count rates for Quadrant D Data is divided into 100 sec bins |
 |
 |
| Parameter | Plot |
|---|---|
| CZT HV Monitor |  |
| D_VDD | 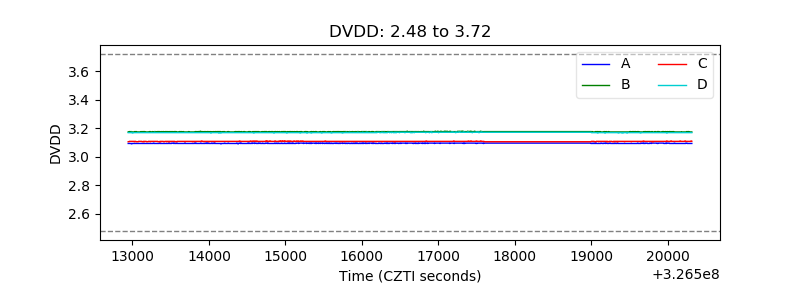 |
| Temperature 1 |  |
| Veto HV Monitor | 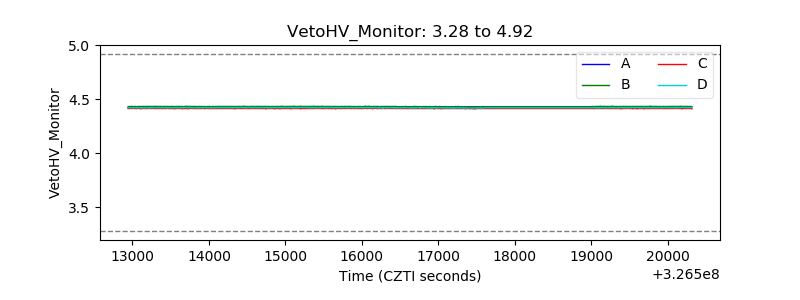 |
| Veto LLD | 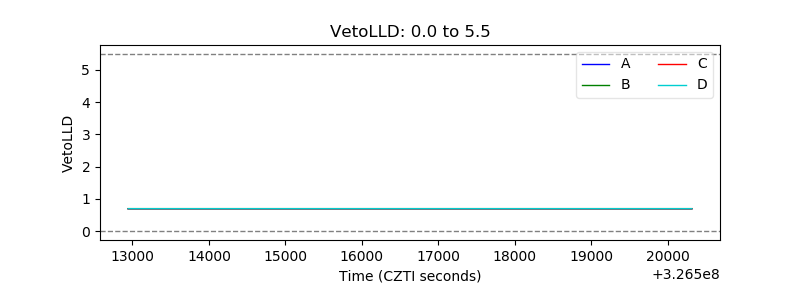 |
| Alpha Counter | 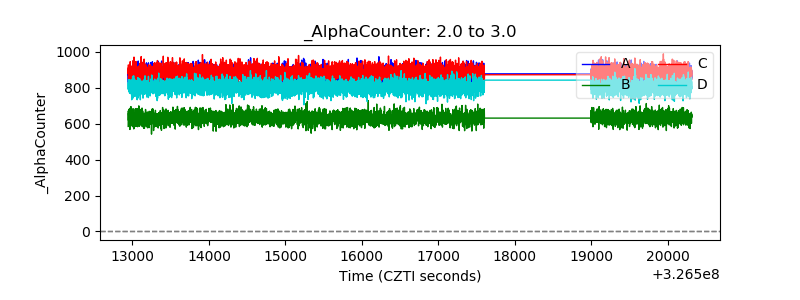 |
| _CPM_Rate | 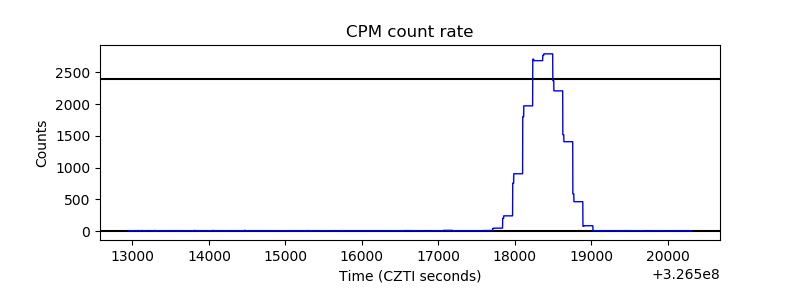 |
| CZT Counter | 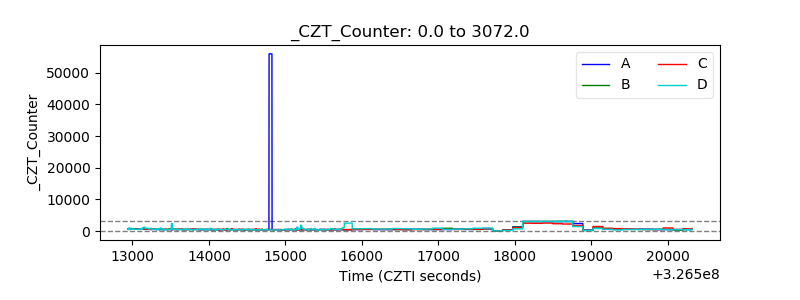 |
| +2.5 Volts monitor | 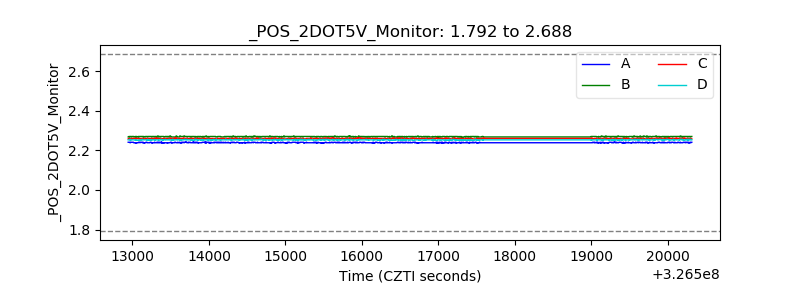 |
| +5 Volts monitor | 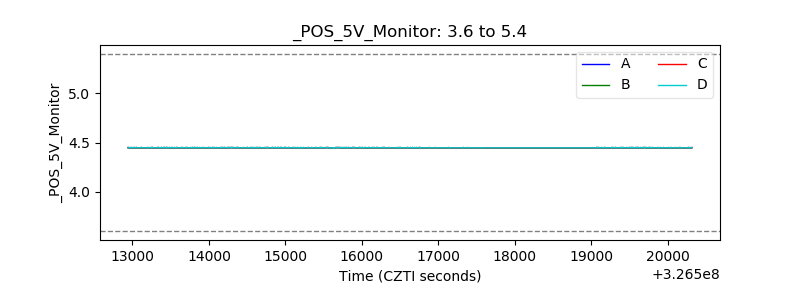 |
| _ROLL_ROT | 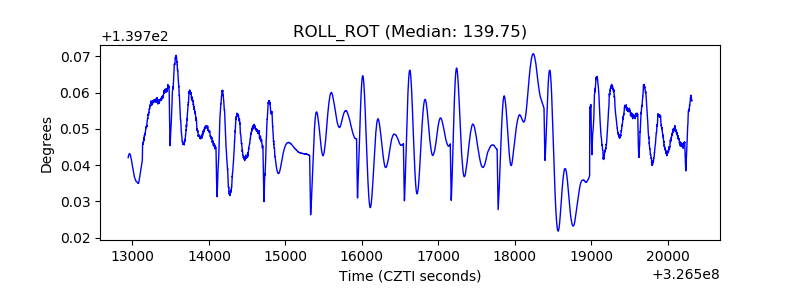 |
| _Roll_DEC | 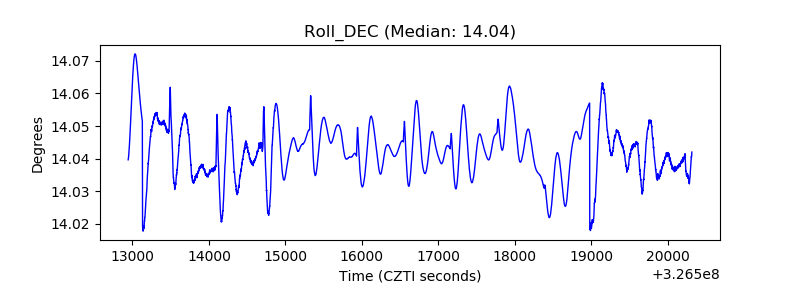 |
| _Roll_RA | 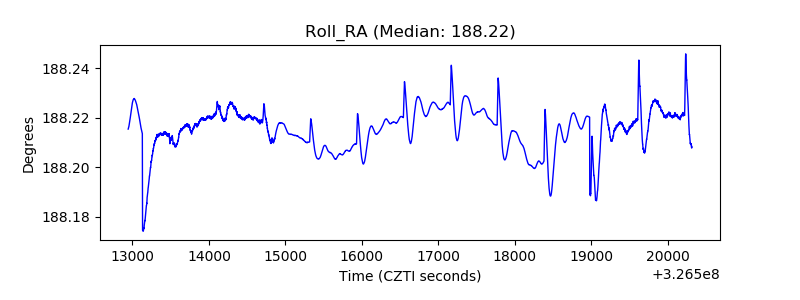 |
| Veto Counter | 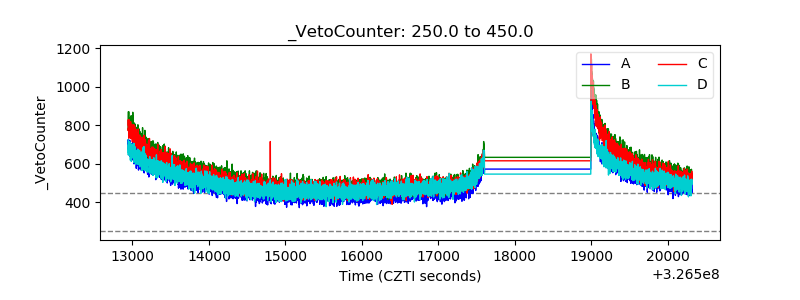 |