| Param | Original file | Final file |
|---|---|---|
| Filename | modeM0/AS1A08_003T16_9000003650_24912cztM0_level2.evt | modeM0/AS1A08_003T16_9000003650_24912cztM0_level2_quad_clean.evt |
| Size (bytes) | 483,033,600 | 71,631,360 |
| Size | 460.7 MB | 68.3 MB |
| Events in quadrant A | 3,245,607 | 449,330 |
| Events in quadrant B | 3,313,440 | 460,302 |
| Events in quadrant C | 3,961,662 | 423,078 |
| Events in quadrant D | 3,692,010 | 408,072 |
| Mode SS | |||
|---|---|---|---|
| Quadrant | BADHDUFLAG | Total packets | Discarded packets |
| A | 0 | 124 | 0 |
| B | 0 | 124 | 0 |
| C | 0 | 124 | 0 |
| D | 0 | 124 | 0 |
| Mode M0 | |||
|---|---|---|---|
| Quadrant | BADHDUFLAG | Total packets | Discarded packets |
| A | 0 | 13026 | 2 |
| B | 0 | 13255 | 2 |
| C | 0 | 15956 | 2 |
| D | 0 | 15004 | 2 |
| Mode M9 | |||
|---|---|---|---|
| Quadrant | BADHDUFLAG | Total packets | Discarded packets |
| A | 0 | 13 | 0 |
| B | 0 | 14 | 0 |
| C | 0 | 14 | 0 |
| D | 0 | 14 | 0 |
| Quadrant | Total seconds | Saturated seconds | Saturation percentage |
|---|---|---|---|
| A | 6136 | 27 | 0.440026% |
| B | 6135 | 60 | 0.977995% |
| C | 6135 | 92 | 1.499593% |
| D | 6135 | 40 | 0.651997% |
Noise dominated data is calculated using 1-second bins in cleaned event files. If a bin has >2000 counts, and if more than 50% of those come from <1% of pixels, then it is considered to be noise-dominated and hence unusable.
| Quadrant | # 1 sec bins | Bins with >0 counts | Bins with >2000 counts | High rate bins dominated by noise | Noise dominated (total time) | Noise dominated (detector-on time) | Marked lightcurve |
|---|---|---|---|---|---|---|---|
| A | 7476 | 6137 | 2 | 2 | 0.03% | 0.03% | 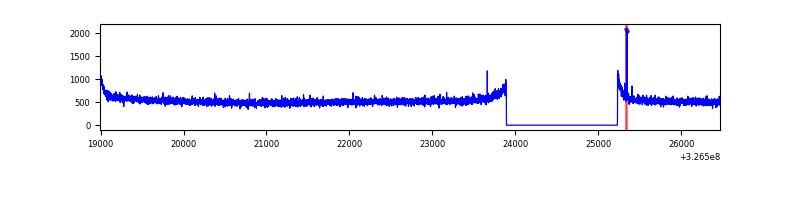 |
| B | 7475 | 6136 | 0 | 0 | 0.00% | 0.00% |  |
| C | 7475 | 6136 | 1 | 1 | 0.01% | 0.02% | 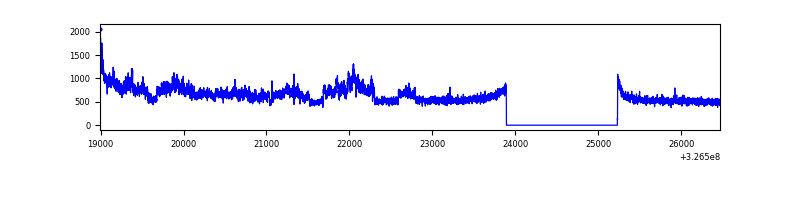 |
| D | 7475 | 6136 | 19 | 19 | 0.25% | 0.31% | 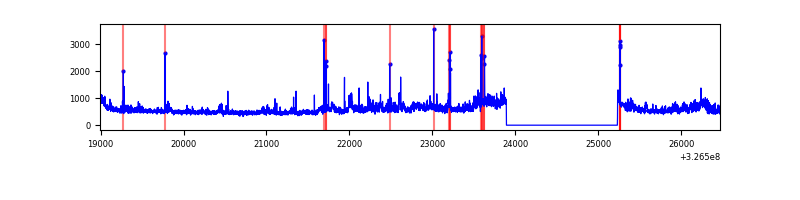 |
Top three noisy pixels from each quadrant. If the there are fewer than three noisy pixels in the level2.evt file, extra rows are filled as -1
| Pixel properties | Quadrant properties | ||||||
|---|---|---|---|---|---|---|---|
| Quadrant | DetID | PixID | Counts | Sigma | Mean | Median | Sigma |
| A | 13 | 254 | 10011 | 55.58 | 839 | 825 | 165.3 |
| A | 3 | 137 | 7435 | 39.99 | 839 | 825 | 165.3 |
| A | 0 | 226 | 7169 | 38.38 | 839 | 825 | 165.3 |
| B | 12 | 111 | 18711 | 114.29 | 836 | 818 | 156.6 |
| B | 11 | 111 | 16870 | 102.53 | 836 | 818 | 156.6 |
| B | 14 | 111 | 16017 | 97.08 | 836 | 818 | 156.6 |
| C | 7 | 247 | 739173 | 4058.64 | 789 | 798 | 181.9 |
| C | 14 | 238 | 131826 | 720.22 | 789 | 798 | 181.9 |
| C | 0 | 10 | 11442 | 58.51 | 789 | 798 | 181.9 |
| D | 1 | 52 | 471851 | 2438.35 | 793 | 772 | 193.2 |
| D | 2 | 244 | 108117 | 555.63 | 793 | 772 | 193.2 |
| D | 8 | 195 | 67477 | 345.27 | 793 | 772 | 193.2 |
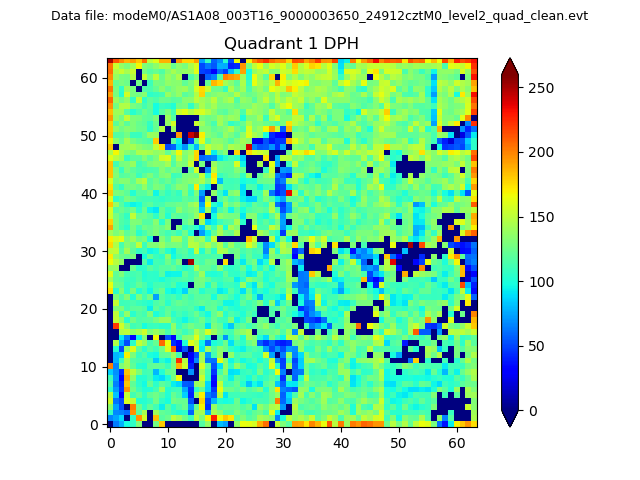
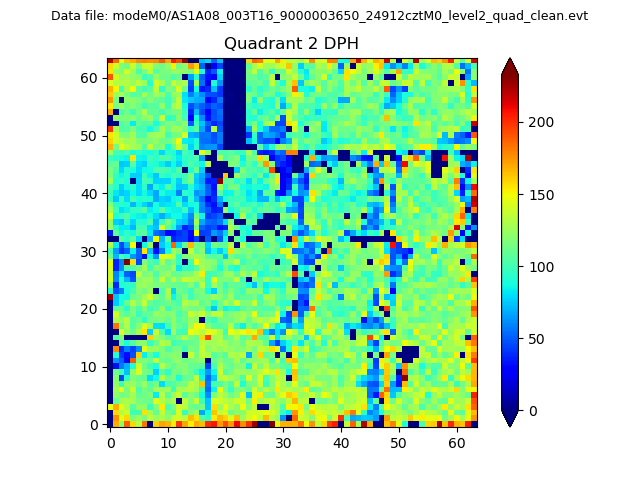
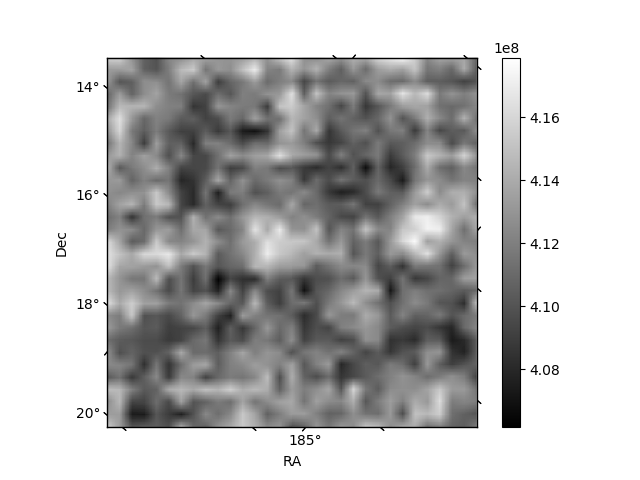
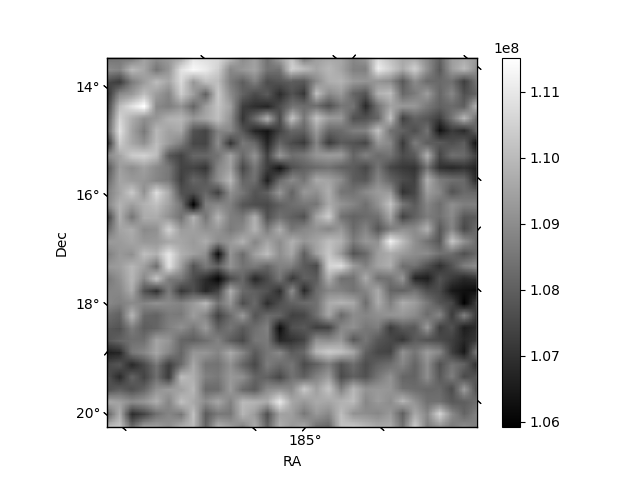
Histogram calculated using DETX and DETY for each event in the final _common_clean file
| Quadrant A | 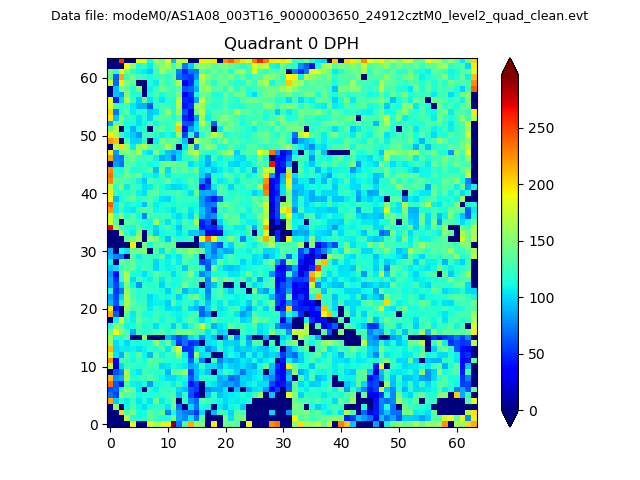 |
 |
Quadrant B |
|---|---|---|---|
| Quadrant D | 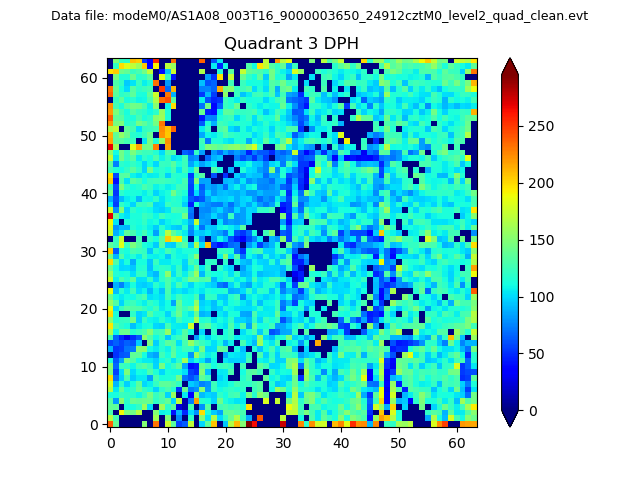 |
 |
Quadrant C |
| Plot type | Count rate plots | Images |
|---|---|---|
| Comparison with Poisson distribution Blue bars denote a histogram of data divided into 1 sec bins. Red curve is a Poisson curve with rate = median count rate of data. |
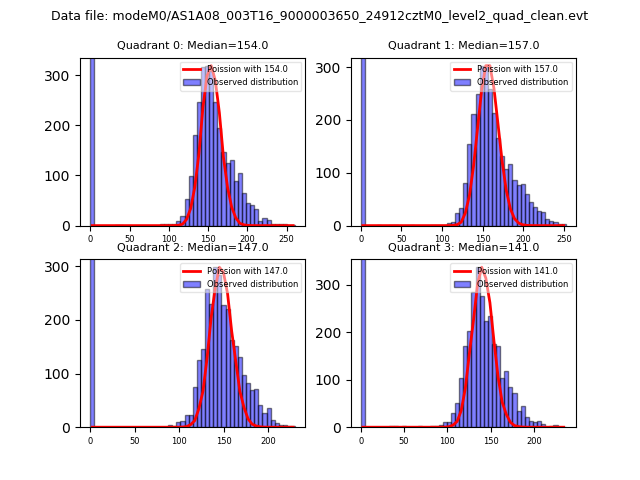 |
 |
| Quadrant-wise count rates Data is divided into 100 sec bins |
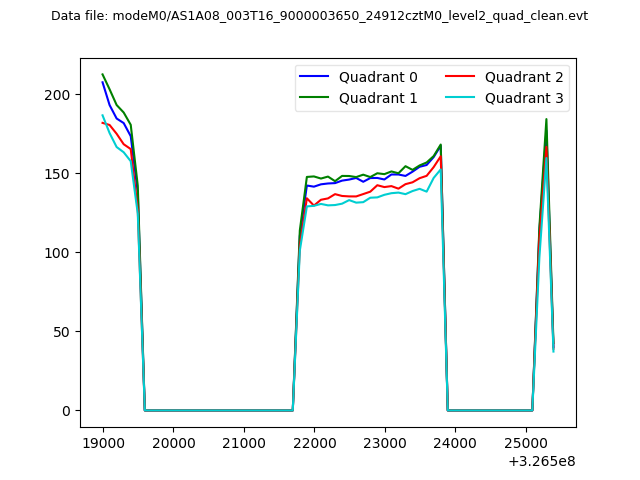 |
|
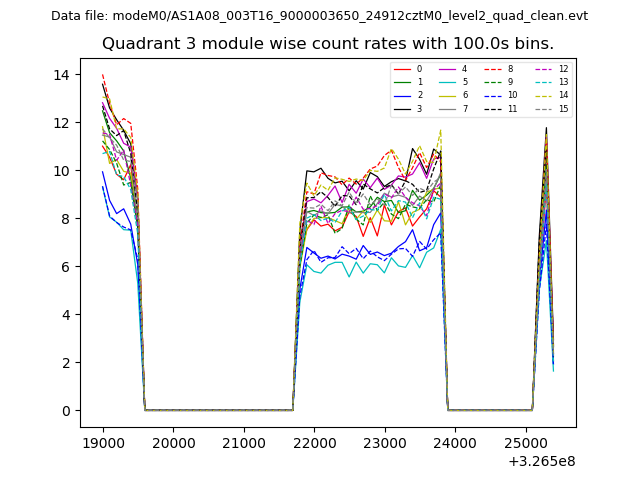
| Module-wise count rates for Quadrant A Data is divided into 100 sec bins |
 |
 |
| Module-wise count rates for Quadrant B Data is divided into 100 sec bins |
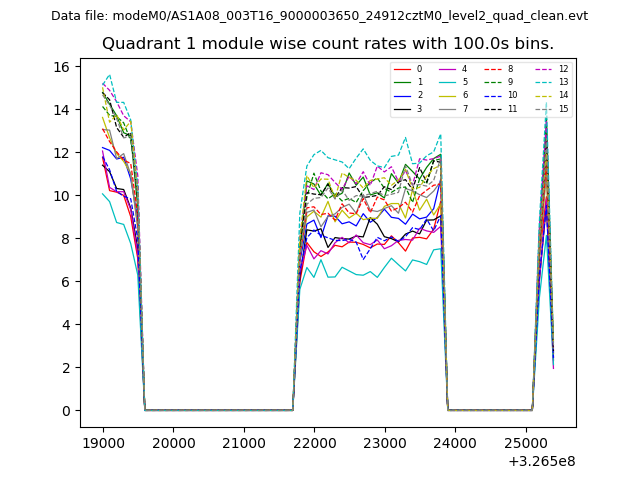 |
 |
| Module-wise count rates for Quadrant C Data is divided into 100 sec bins |
 |
 |
| Module-wise count rates for Quadrant D Data is divided into 100 sec bins |
 |
 |
| Parameter | Plot |
|---|---|
| CZT HV Monitor | 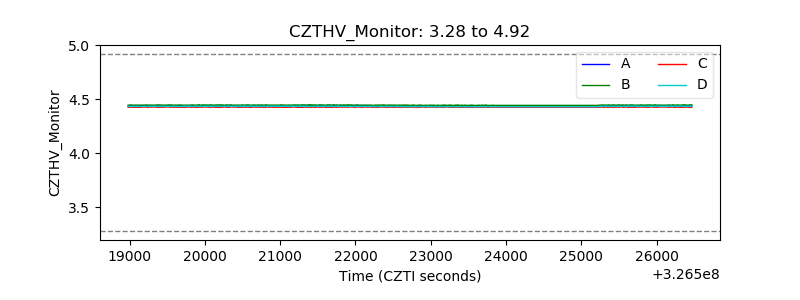 |
| D_VDD | 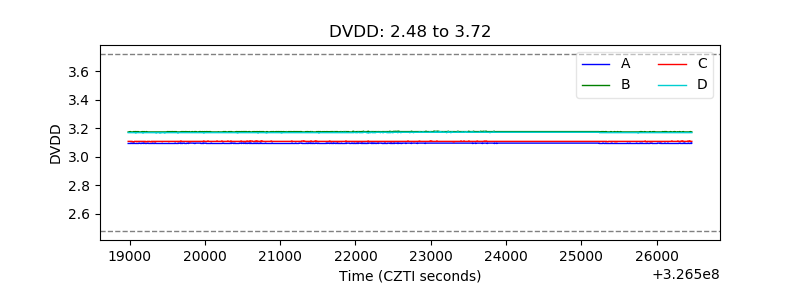 |
| Temperature 1 | 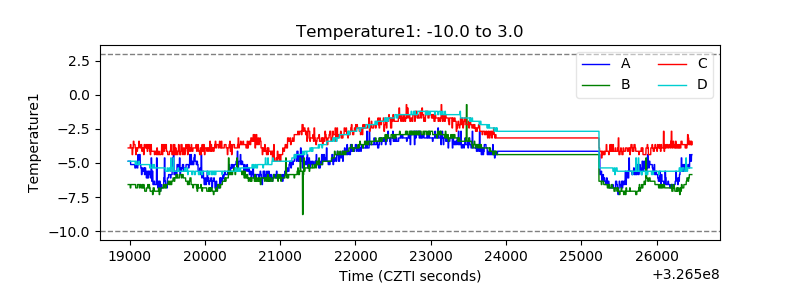 |
| Veto HV Monitor | 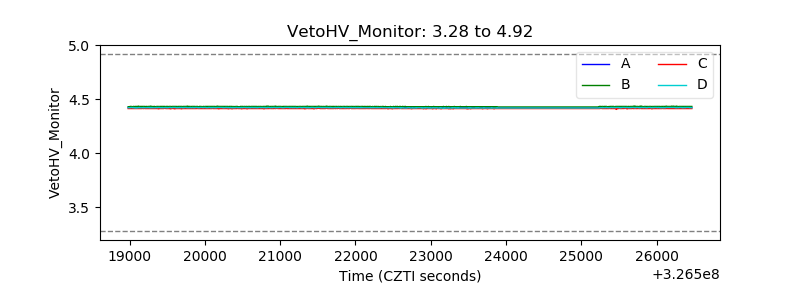 |
| Veto LLD |  |
| Alpha Counter | 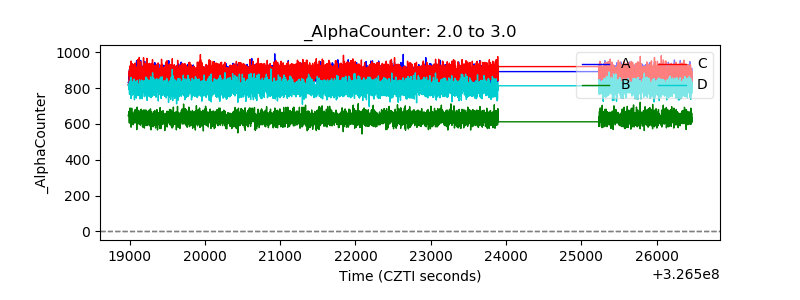 |
| _CPM_Rate | 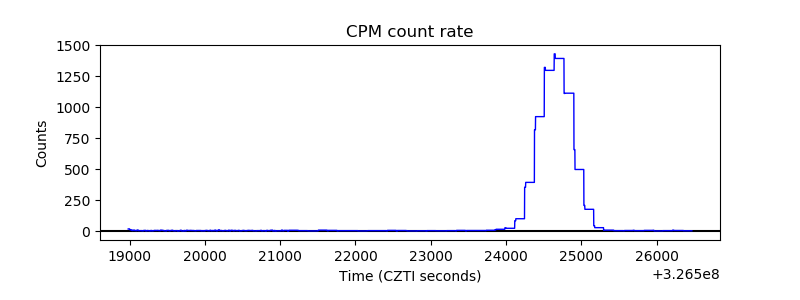 |
| CZT Counter | 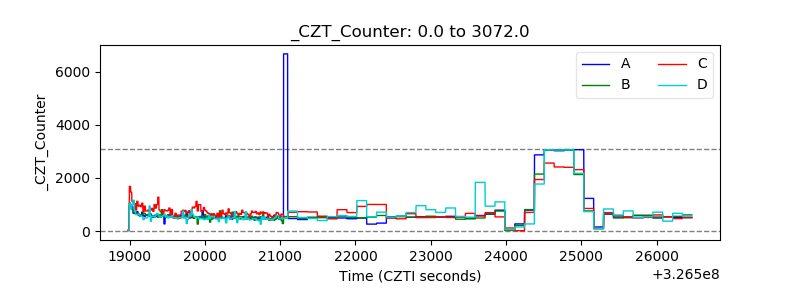 |
| +2.5 Volts monitor |  |
| +5 Volts monitor |  |
| _ROLL_ROT | 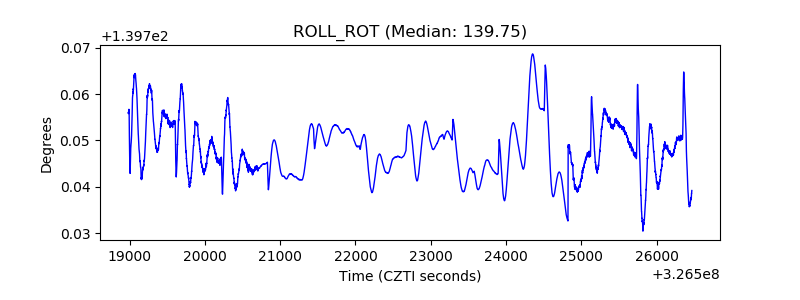 |
| _Roll_DEC | 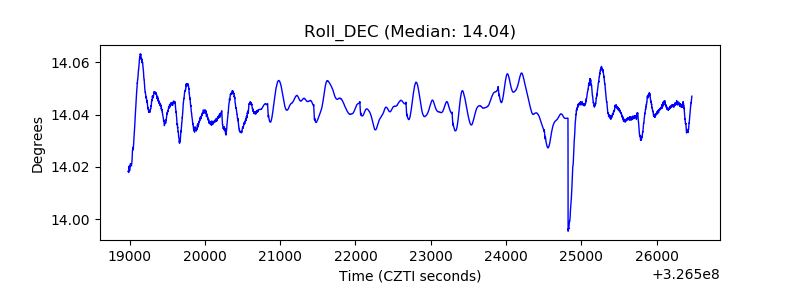 |
| _Roll_RA | 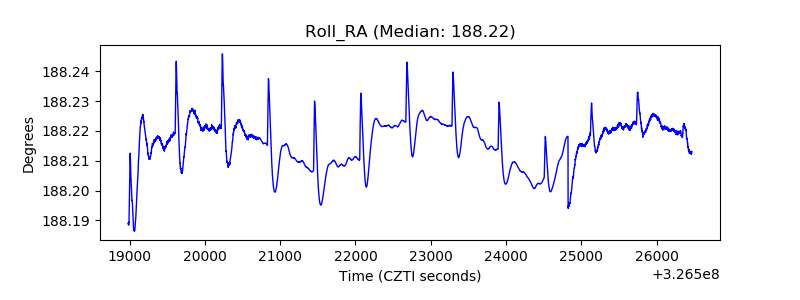 |
| Veto Counter |  |