| Param | Original file | Final file |
|---|---|---|
| Filename | modeM0/AS1A08_003T16_9000003650_24913cztM0_level2.evt | modeM0/AS1A08_003T16_9000003650_24913cztM0_level2_quad_clean.evt |
| Size (bytes) | 511,994,880 | 72,881,280 |
| Size | 488.3 MB | 69.5 MB |
| Events in quadrant A | 3,453,460 | 446,924 |
| Events in quadrant B | 3,530,429 | 455,976 |
| Events in quadrant C | 4,008,052 | 423,751 |
| Events in quadrant D | 4,059,312 | 413,001 |
| Mode SS | |||
|---|---|---|---|
| Quadrant | BADHDUFLAG | Total packets | Discarded packets |
| A | 0 | 140 | 0 |
| B | 0 | 140 | 0 |
| C | 0 | 140 | 0 |
| D | 0 | 140 | 0 |
| Mode M0 | |||
|---|---|---|---|
| Quadrant | BADHDUFLAG | Total packets | Discarded packets |
| A | 0 | 14090 | 2 |
| B | 0 | 14282 | 2 |
| C | 0 | 16134 | 2 |
| D | 0 | 16373 | 2 |
| Mode M9 | |||
|---|---|---|---|
| Quadrant | BADHDUFLAG | Total packets | Discarded packets |
| A | 0 | 23 | 0 |
| B | 0 | 23 | 0 |
| C | 0 | 23 | 0 |
| D | 0 | 23 | 0 |
| Quadrant | Total seconds | Saturated seconds | Saturation percentage |
|---|---|---|---|
| A | 6693 | 83 | 1.240102% |
| B | 6693 | 122 | 1.822800% |
| C | 6694 | 151 | 2.255751% |
| D | 6694 | 124 | 1.852405% |
Noise dominated data is calculated using 1-second bins in cleaned event files. If a bin has >2000 counts, and if more than 50% of those come from <1% of pixels, then it is considered to be noise-dominated and hence unusable.
| Quadrant | # 1 sec bins | Bins with >0 counts | Bins with >2000 counts | High rate bins dominated by noise | Noise dominated (total time) | Noise dominated (detector-on time) | Marked lightcurve |
|---|---|---|---|---|---|---|---|
| A | 9088 | 6695 | 2 | 2 | 0.02% | 0.03% | 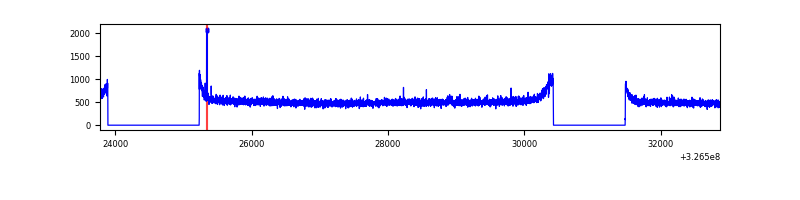 |
| B | 9088 | 6695 | 0 | 0 | 0.00% | 0.00% | 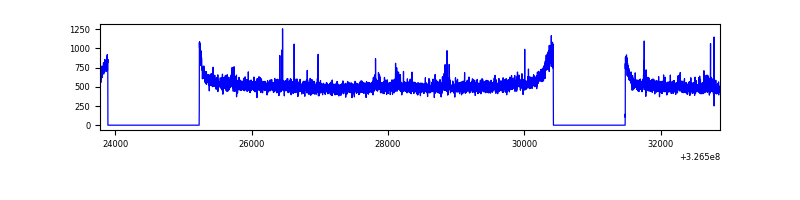 |
| C | 9089 | 6696 | 3 | 3 | 0.03% | 0.04% | 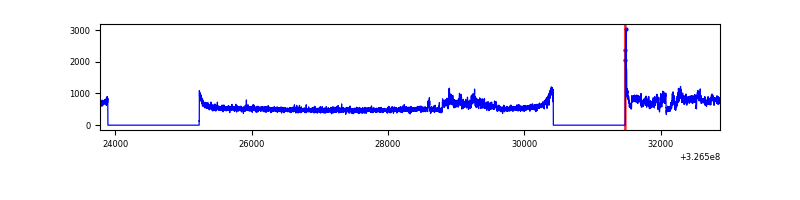 |
| D | 9089 | 6696 | 64 | 64 | 0.70% | 0.96% | 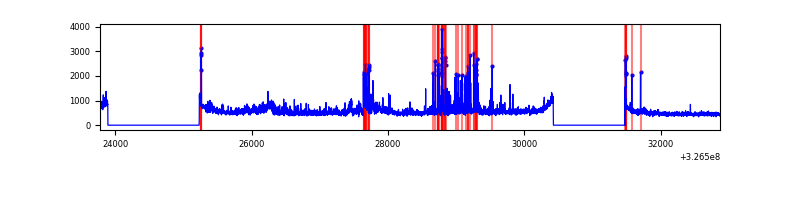 |
Top three noisy pixels from each quadrant. If the there are fewer than three noisy pixels in the level2.evt file, extra rows are filled as -1
| Pixel properties | Quadrant properties | ||||||
|---|---|---|---|---|---|---|---|
| Quadrant | DetID | PixID | Counts | Sigma | Mean | Median | Sigma |
| A | 13 | 254 | 10658 | 54.88 | 893 | 875 | 178.3 |
| A | 12 | 96 | 9005 | 45.61 | 893 | 875 | 178.3 |
| A | 3 | 137 | 8247 | 41.36 | 893 | 875 | 178.3 |
| B | 0 | 189 | 31485 | 180.16 | 888 | 868 | 169.9 |
| B | 12 | 111 | 21185 | 119.55 | 888 | 868 | 169.9 |
| B | 11 | 111 | 18760 | 105.28 | 888 | 868 | 169.9 |
| C | 7 | 247 | 567799 | 2873.31 | 843 | 850 | 197.3 |
| C | 14 | 238 | 135976 | 684.82 | 843 | 850 | 197.3 |
| C | 0 | 10 | 16568 | 79.66 | 843 | 850 | 197.3 |
| D | 1 | 52 | 420213 | 2032.69 | 849 | 825 | 206.3 |
| D | 12 | 233 | 143558 | 691.8 | 849 | 825 | 206.3 |
| D | 8 | 195 | 115195 | 554.33 | 849 | 825 | 206.3 |
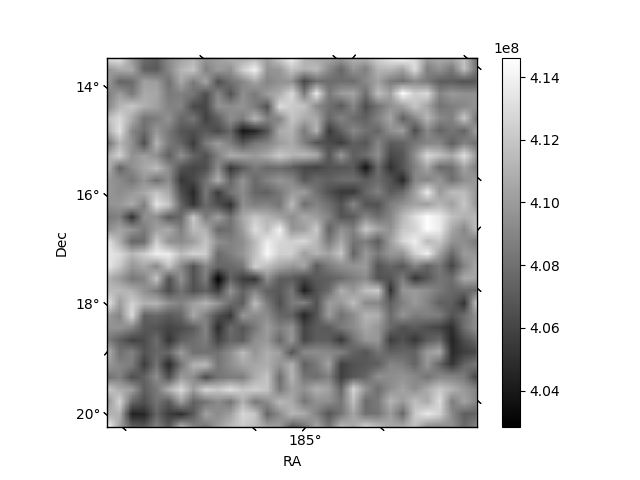
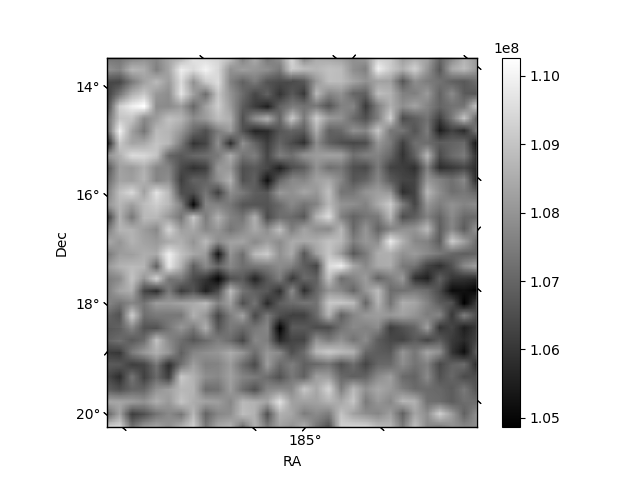
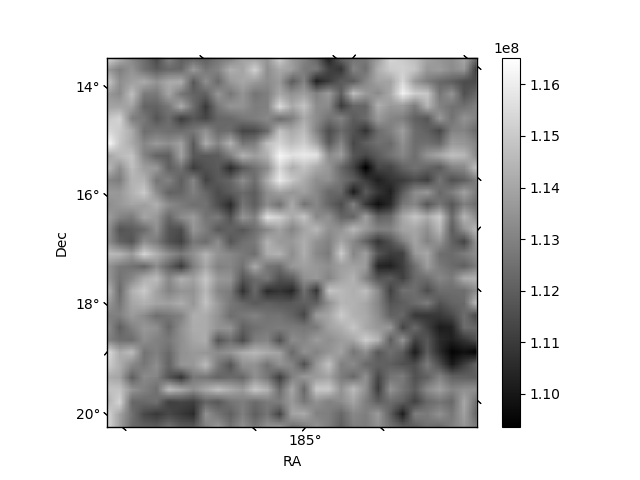
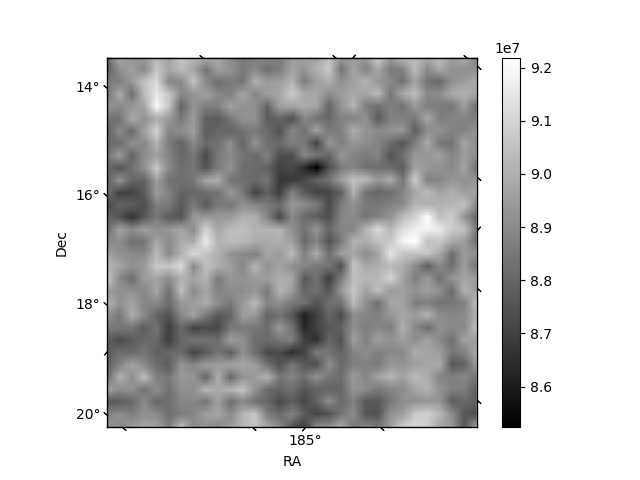
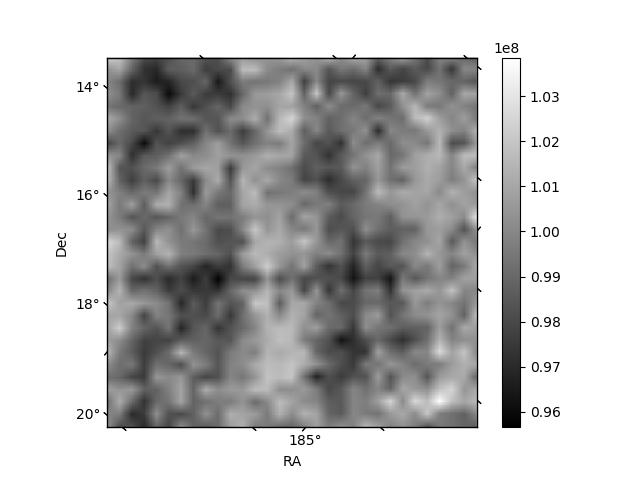
Histogram calculated using DETX and DETY for each event in the final _common_clean file
| Quadrant A | 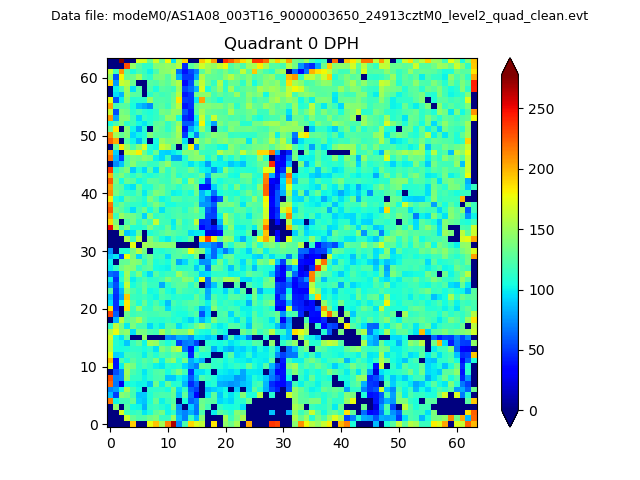 |
 |
Quadrant B |
|---|---|---|---|
| Quadrant D | 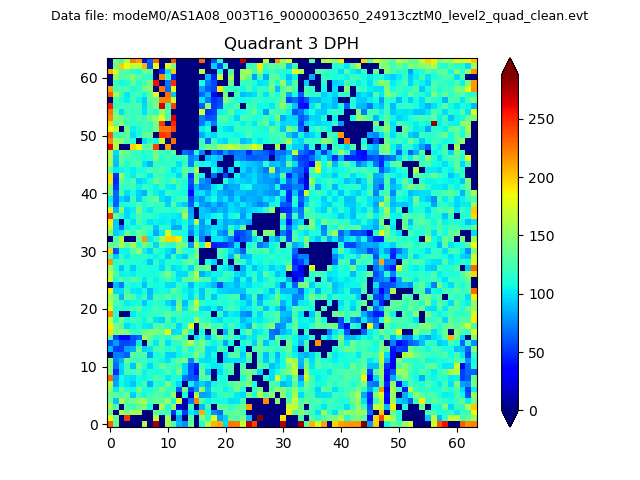 |
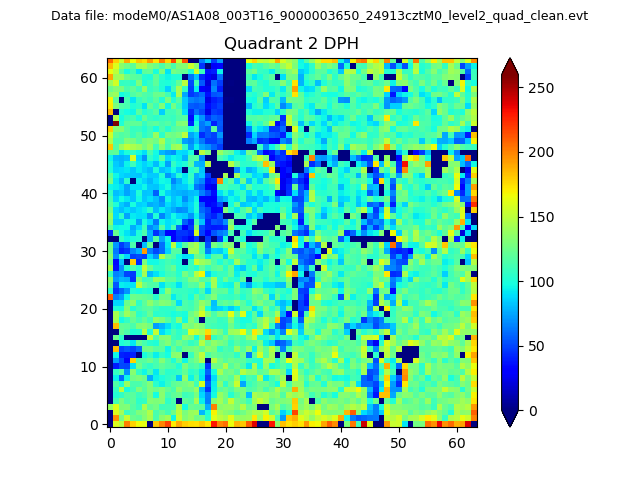 |
Quadrant C |
| Plot type | Count rate plots | Images |
|---|---|---|
| Comparison with Poisson distribution Blue bars denote a histogram of data divided into 1 sec bins. Red curve is a Poisson curve with rate = median count rate of data. |
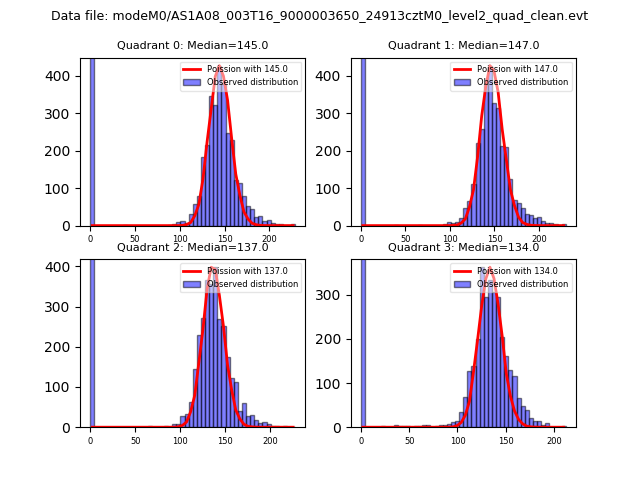 |
 |
| Quadrant-wise count rates Data is divided into 100 sec bins |
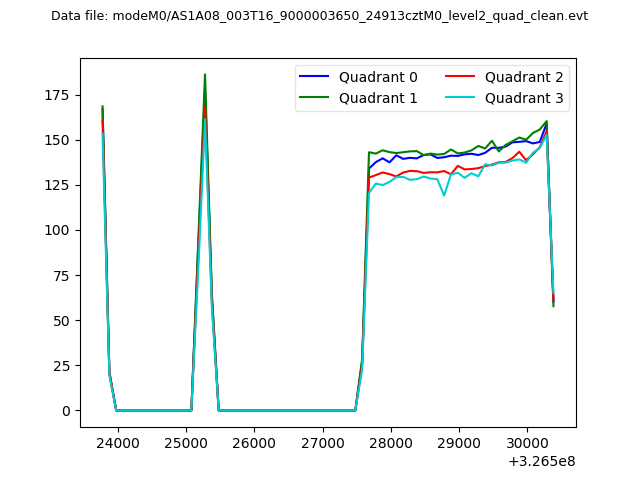 |
|
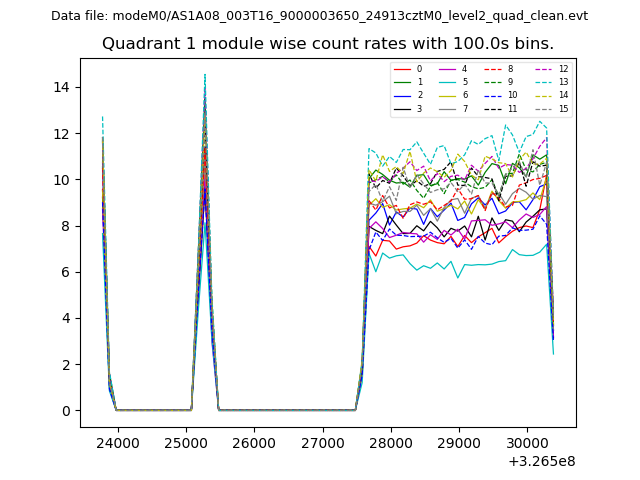
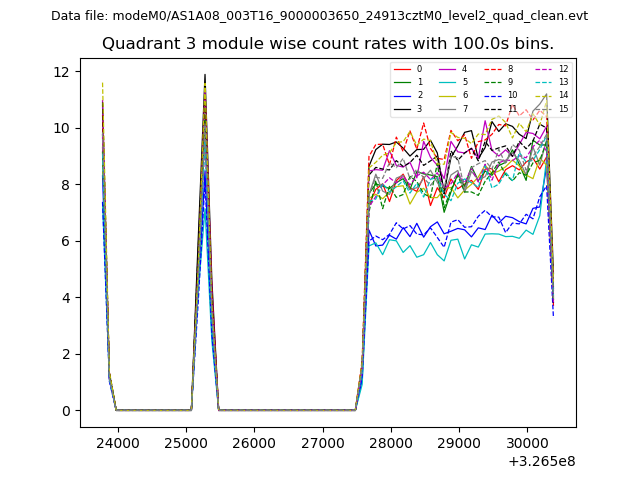
| Module-wise count rates for Quadrant A Data is divided into 100 sec bins |
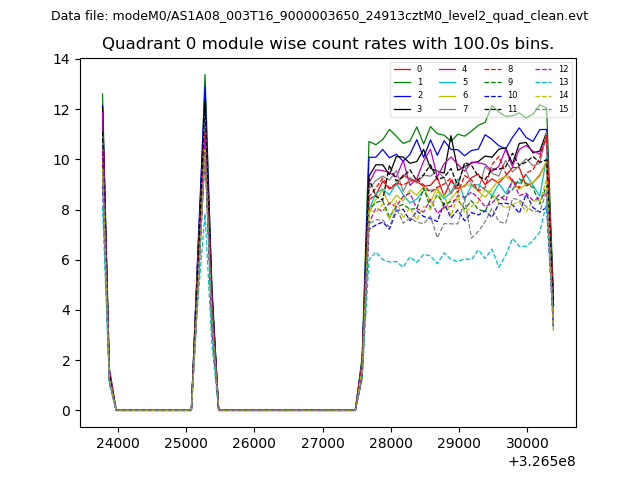 |
 |
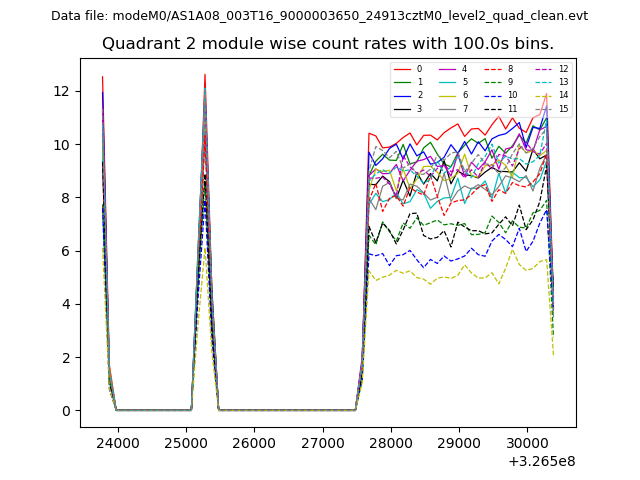
| Module-wise count rates for Quadrant B Data is divided into 100 sec bins |
 |
 |
| Module-wise count rates for Quadrant C Data is divided into 100 sec bins |
 |
 |
| Module-wise count rates for Quadrant D Data is divided into 100 sec bins |
 |
 |
| Parameter | Plot |
|---|---|
| CZT HV Monitor | 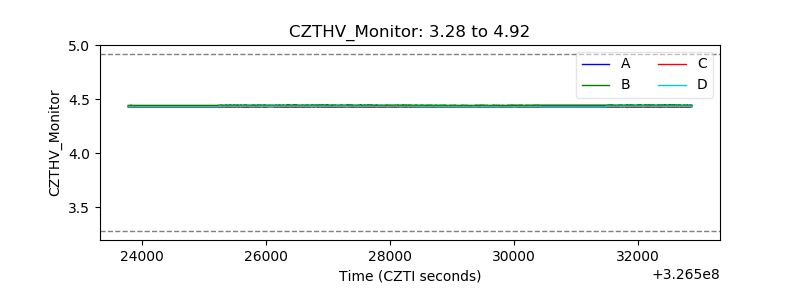 |
| D_VDD | 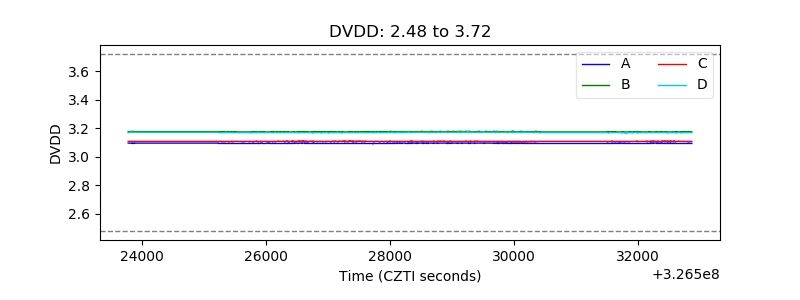 |
| Temperature 1 | 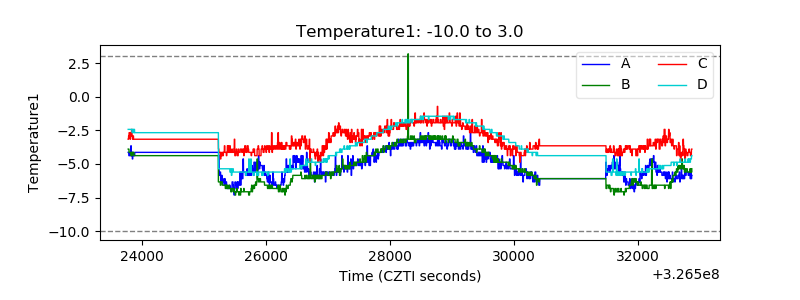 |
| Veto HV Monitor | 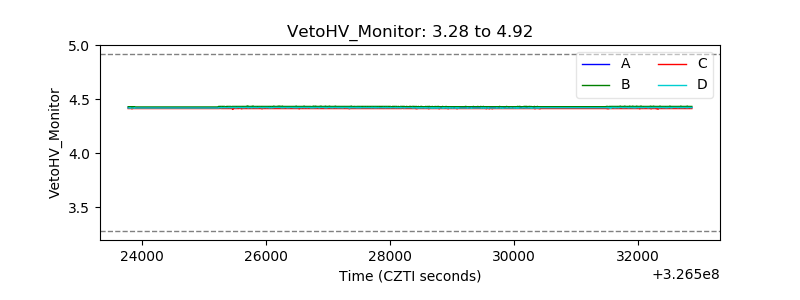 |
| Veto LLD | 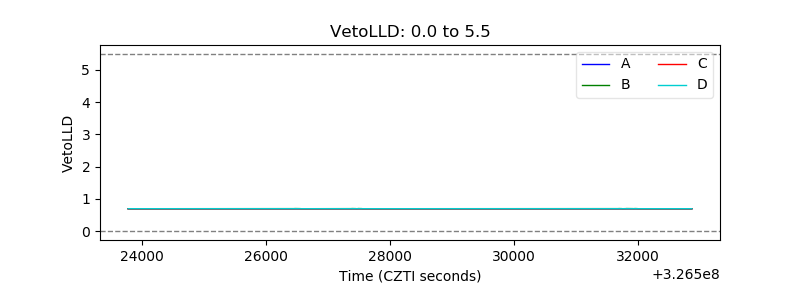 |
| Alpha Counter |  |
| _CPM_Rate | 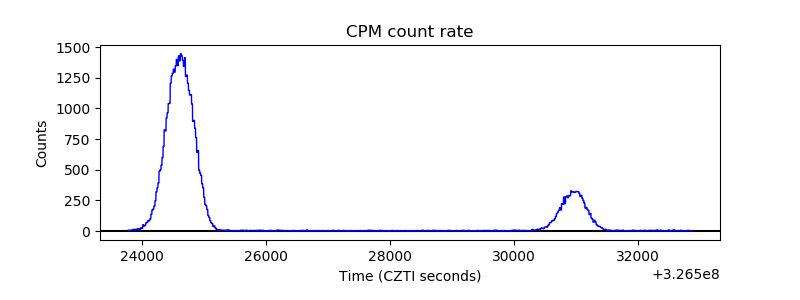 |
| CZT Counter | 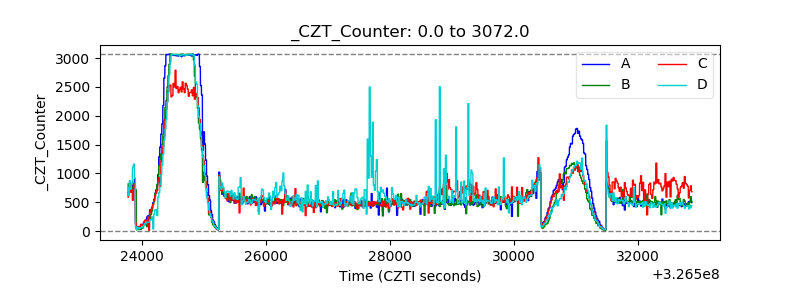 |
| +2.5 Volts monitor |  |
| +5 Volts monitor |  |
| _ROLL_ROT | 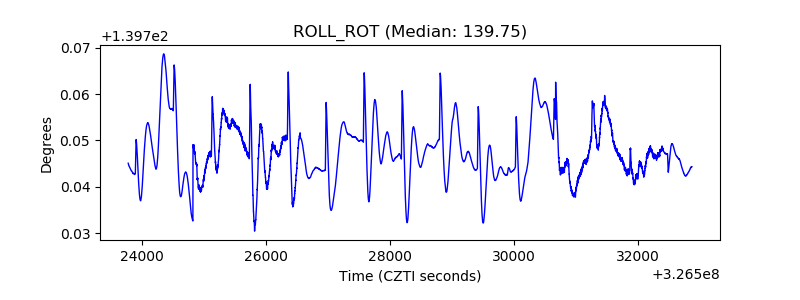 |
| _Roll_DEC | 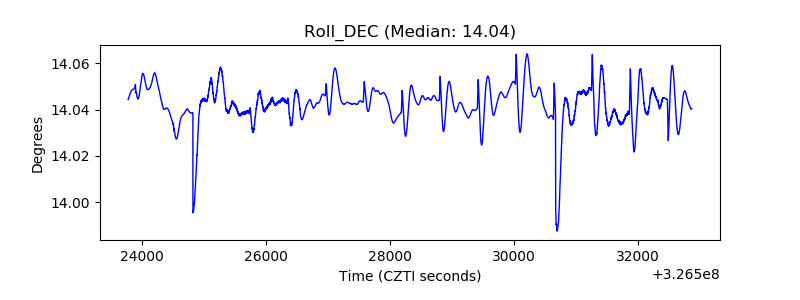 |
| _Roll_RA | 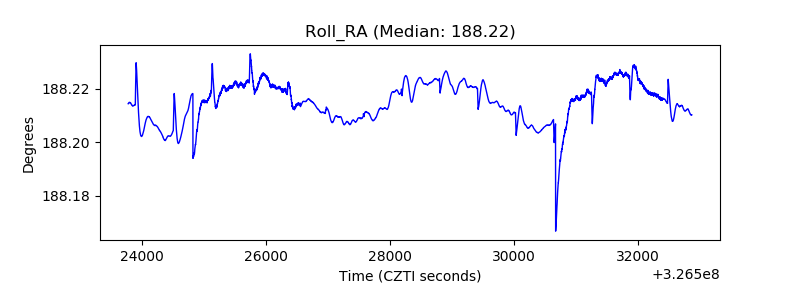 |
| Veto Counter | 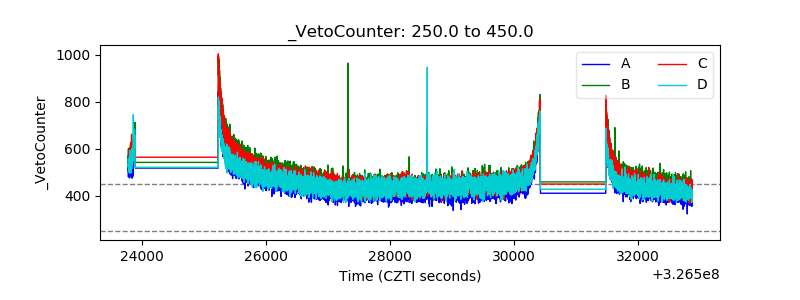 |