| Param | Original file | Final file |
|---|---|---|
| Filename | modeM0/AS1A08_003T16_9000003650_24916cztM0_level2.evt | modeM0/AS1A08_003T16_9000003650_24916cztM0_level2_quad_clean.evt |
| Size (bytes) | 542,831,040 | 89,634,240 |
| Size | 517.7 MB | 85.5 MB |
| Events in quadrant A | 4,093,377 | 550,540 |
| Events in quadrant B | 4,048,312 | 562,558 |
| Events in quadrant C | 3,885,577 | 530,042 |
| Events in quadrant D | 3,876,509 | 522,930 |
| Mode SS | |||
|---|---|---|---|
| Quadrant | BADHDUFLAG | Total packets | Discarded packets |
| A | 0 | 162 | 0 |
| B | 0 | 162 | 0 |
| C | 0 | 162 | 0 |
| D | 0 | 162 | 0 |
| Mode M0 | |||
|---|---|---|---|
| Quadrant | BADHDUFLAG | Total packets | Discarded packets |
| A | 0 | 17102 | 2 |
| B | 0 | 16979 | 3 |
| C | 0 | 16403 | 2 |
| D | 0 | 16652 | 2 |
| Mode M9 | |||
|---|---|---|---|
| Quadrant | BADHDUFLAG | Total packets | Discarded packets |
| A | 0 | 2 | 0 |
| B | 0 | 2 | 0 |
| C | 0 | 2 | 0 |
| D | 0 | 2 | 0 |
| Quadrant | Total seconds | Saturated seconds | Saturation percentage |
|---|---|---|---|
| A | 7879 | 364 | 4.619876% |
| B | 7879 | 336 | 4.264501% |
| C | 7879 | 338 | 4.289885% |
| D | 7879 | 247 | 3.134916% |
Noise dominated data is calculated using 1-second bins in cleaned event files. If a bin has >2000 counts, and if more than 50% of those come from <1% of pixels, then it is considered to be noise-dominated and hence unusable.
| Quadrant | # 1 sec bins | Bins with >0 counts | Bins with >2000 counts | High rate bins dominated by noise | Noise dominated (total time) | Noise dominated (detector-on time) | Marked lightcurve |
|---|---|---|---|---|---|---|---|
| A | 8159 | 7880 | 33 | 33 | 0.40% | 0.42% | 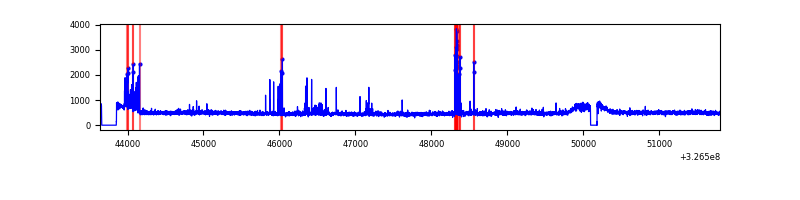 |
| B | 8159 | 7880 | 13 | 13 | 0.16% | 0.16% | 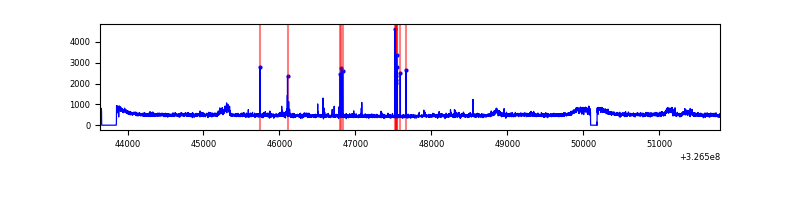 |
| C | 8159 | 7880 | 0 | 0 | 0.00% | 0.00% | 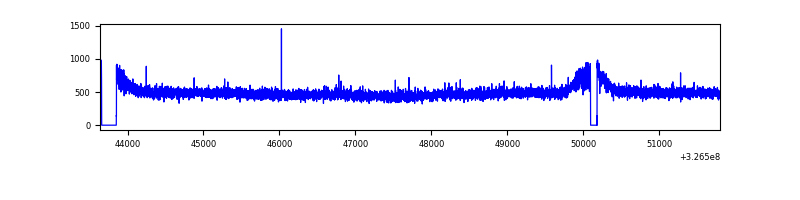 |
| D | 8159 | 7880 | 13 | 13 | 0.16% | 0.16% | 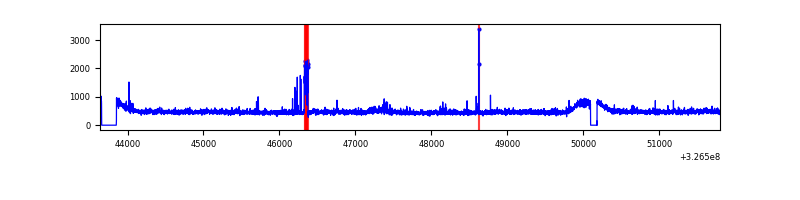 |
Top three noisy pixels from each quadrant. If the there are fewer than three noisy pixels in the level2.evt file, extra rows are filled as -1
| Pixel properties | Quadrant properties | ||||||
|---|---|---|---|---|---|---|---|
| Quadrant | DetID | PixID | Counts | Sigma | Mean | Median | Sigma |
| A | 15 | 223 | 197210 | 973.08 | 991 | 967 | 201.7 |
| A | 15 | 239 | 60737 | 296.37 | 991 | 967 | 201.7 |
| A | 13 | 254 | 11613 | 52.79 | 991 | 967 | 201.7 |
| B | 0 | 189 | 129847 | 673.89 | 982 | 956 | 191.3 |
| B | 4 | 80 | 45834 | 234.64 | 982 | 956 | 191.3 |
| B | 12 | 111 | 24494 | 123.07 | 982 | 956 | 191.3 |
| C | 14 | 238 | 152067 | 674.13 | 947 | 951 | 224.2 |
| C | 7 | 247 | 33446 | 144.96 | 947 | 951 | 224.2 |
| C | 13 | 61 | 6674 | 25.53 | 947 | 951 | 224.2 |
| D | 7 | 238 | 74215 | 311.17 | 964 | 934 | 235.5 |
| D | 8 | 195 | 66549 | 278.62 | 964 | 934 | 235.5 |
| D | 1 | 239 | 52968 | 220.95 | 964 | 934 | 235.5 |
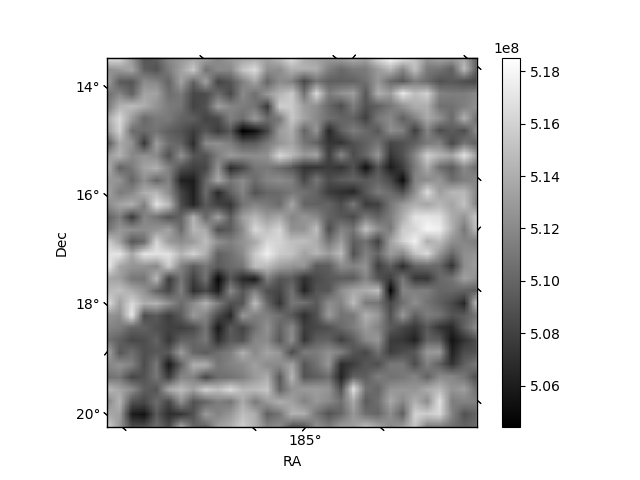
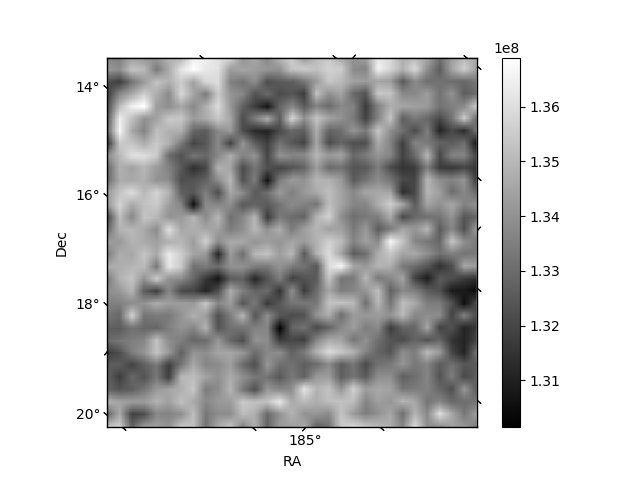
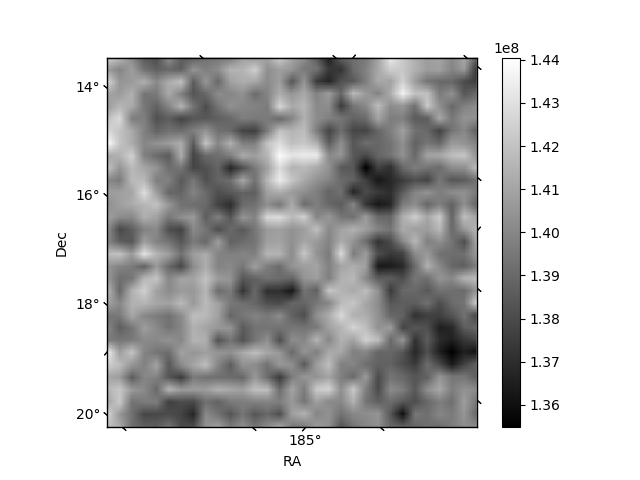
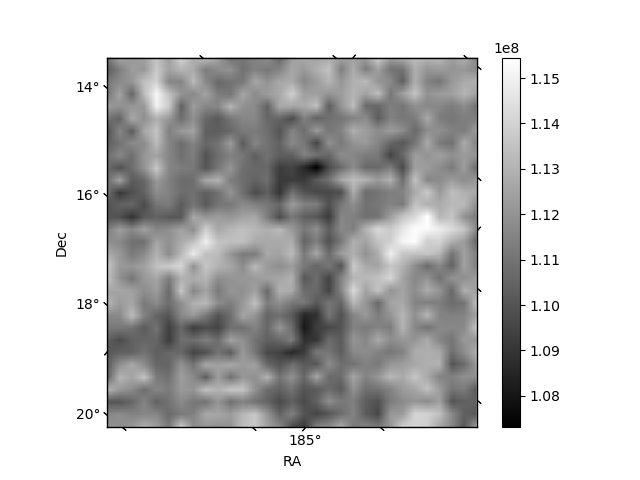
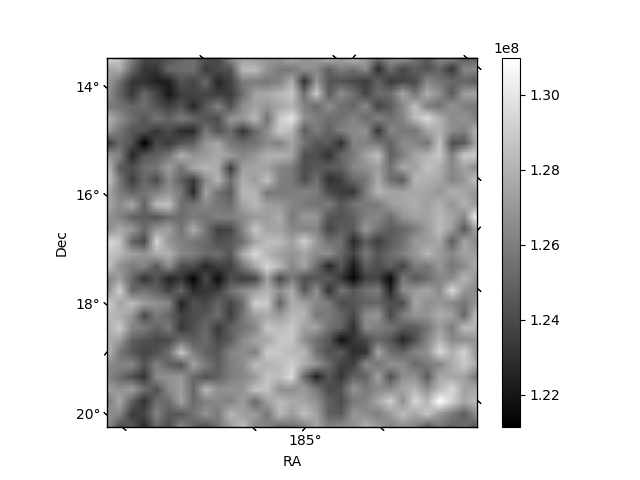
Histogram calculated using DETX and DETY for each event in the final _common_clean file
| Quadrant A | 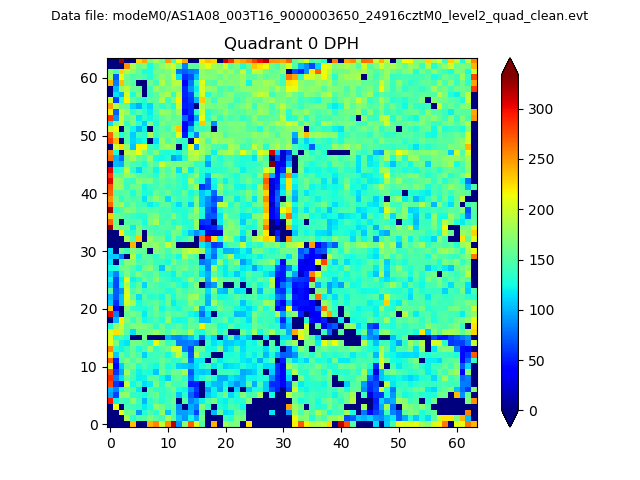 |
 |
Quadrant B |
|---|---|---|---|
| Quadrant D | 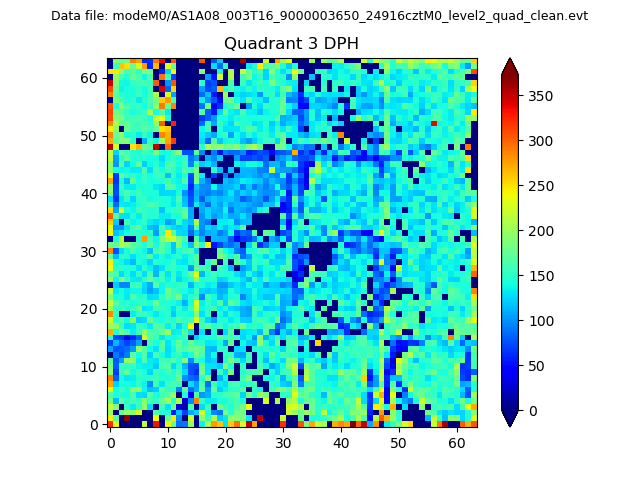 |
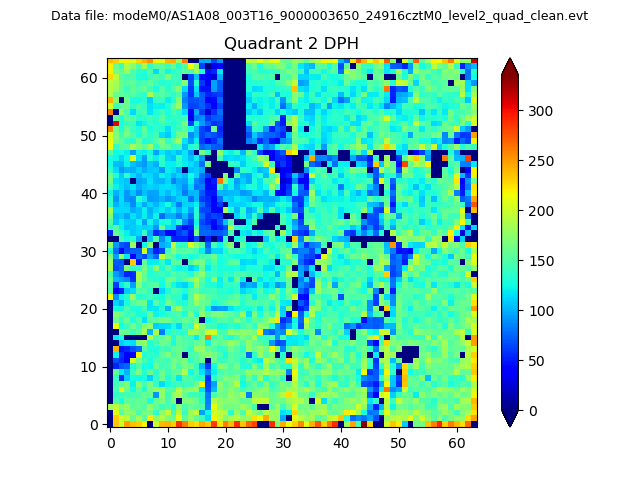 |
Quadrant C |
| Plot type | Count rate plots | Images |
|---|---|---|
| Comparison with Poisson distribution Blue bars denote a histogram of data divided into 1 sec bins. Red curve is a Poisson curve with rate = median count rate of data. |
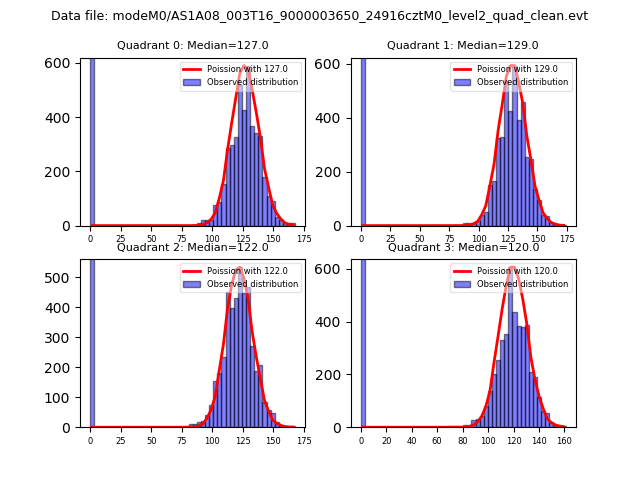 |
 |
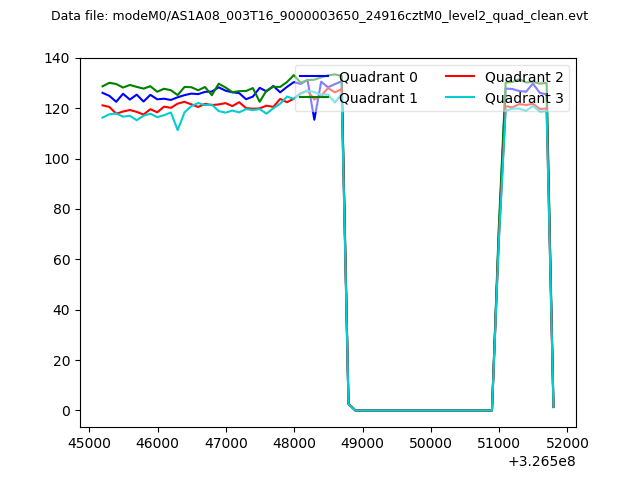
| Quadrant-wise count rates Data is divided into 100 sec bins |
 |
|
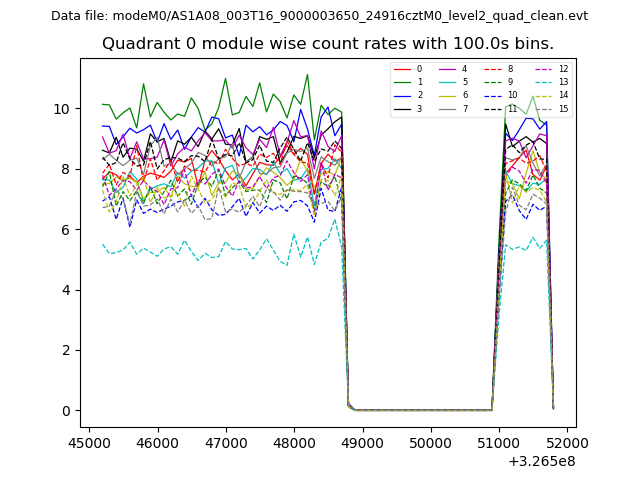
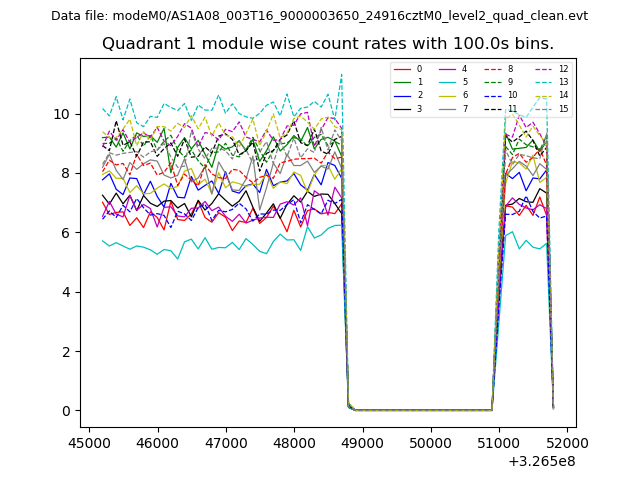
| Module-wise count rates for Quadrant A Data is divided into 100 sec bins |
 |
 |
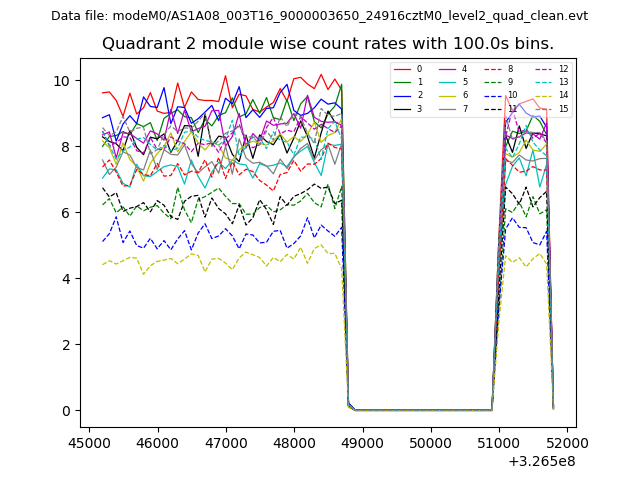
| Module-wise count rates for Quadrant B Data is divided into 100 sec bins |
 |
 |
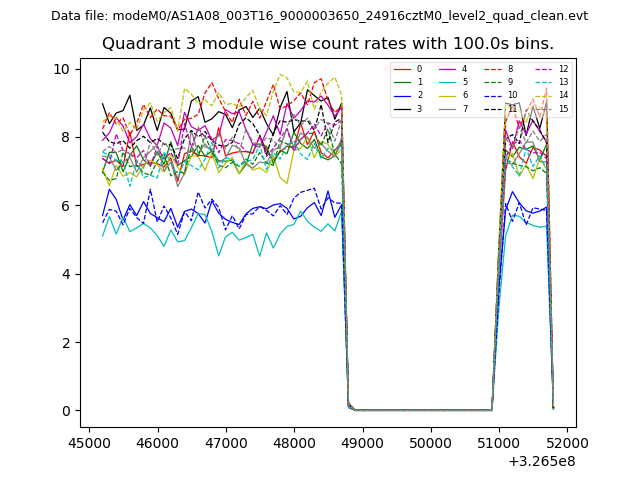
| Module-wise count rates for Quadrant C Data is divided into 100 sec bins |
 |
 |
| Module-wise count rates for Quadrant D Data is divided into 100 sec bins |
 |
 |
| Parameter | Plot |
|---|---|
| CZT HV Monitor | 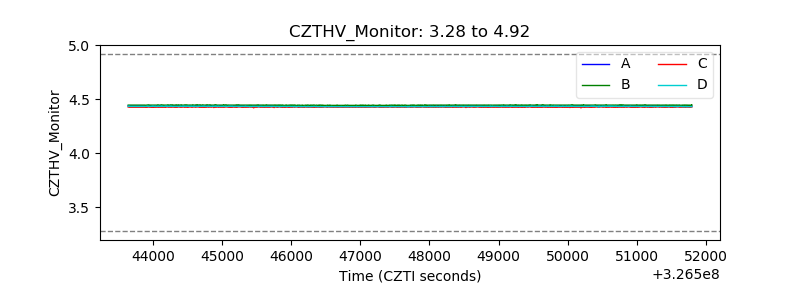 |
| D_VDD | 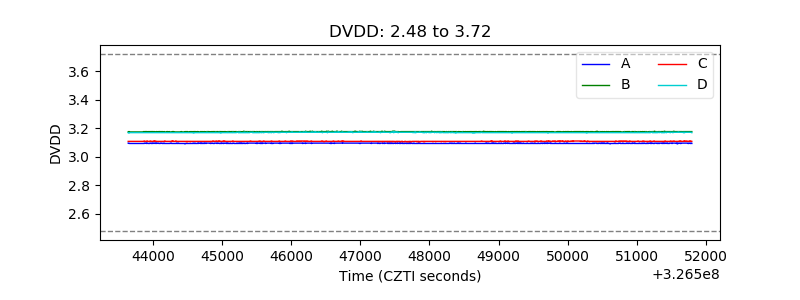 |
| Temperature 1 | 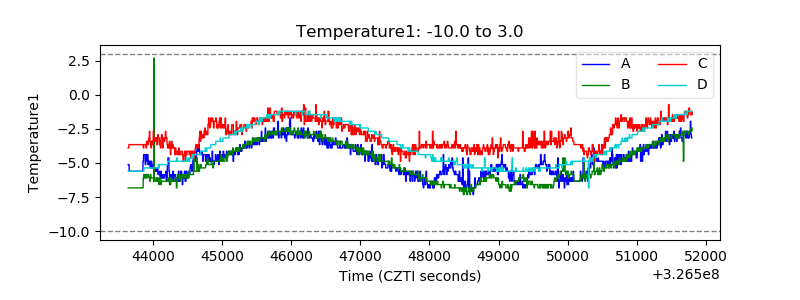 |
| Veto HV Monitor | 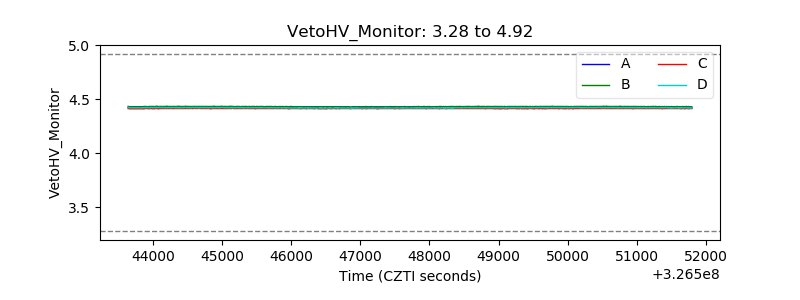 |
| Veto LLD | 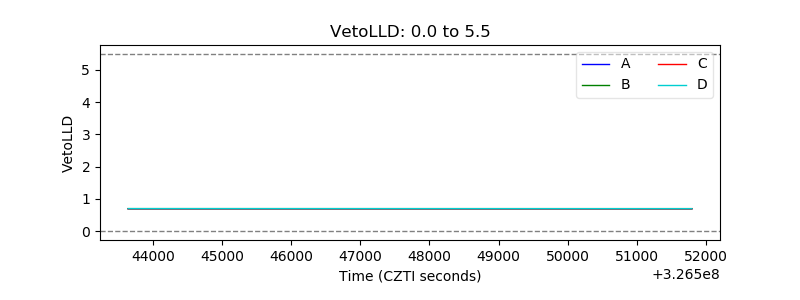 |
| Alpha Counter | 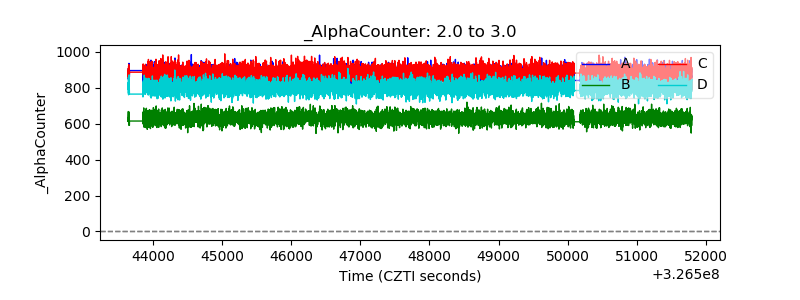 |
| _CPM_Rate | 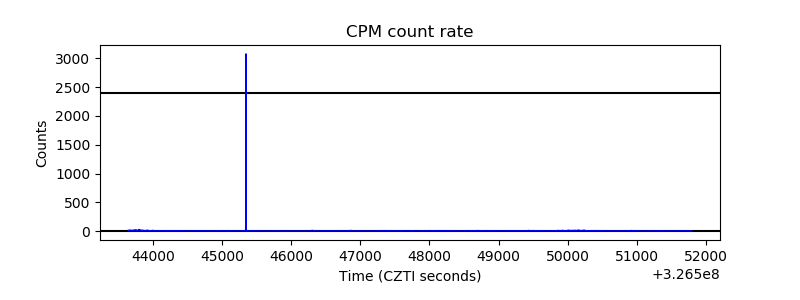 |
| CZT Counter | 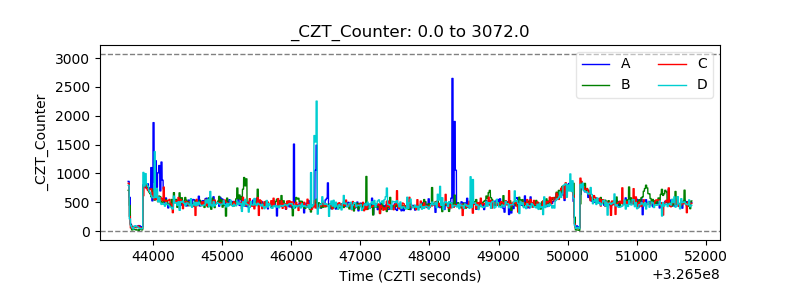 |
| +2.5 Volts monitor |  |
| +5 Volts monitor |  |
| _ROLL_ROT | 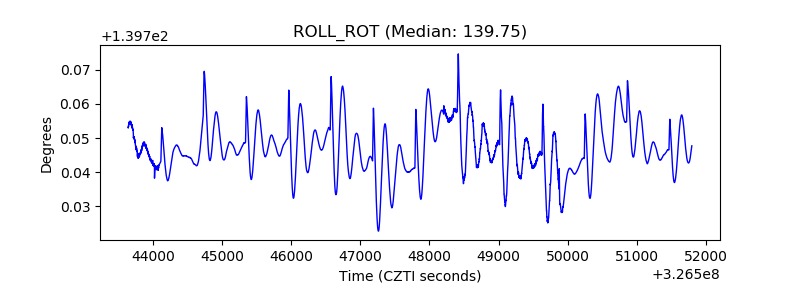 |
| _Roll_DEC | 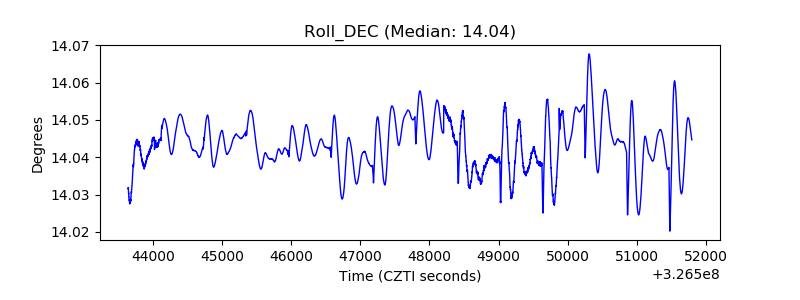 |
| _Roll_RA | 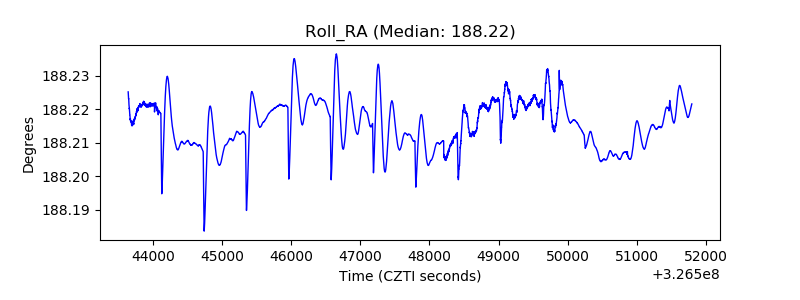 |
| Veto Counter | 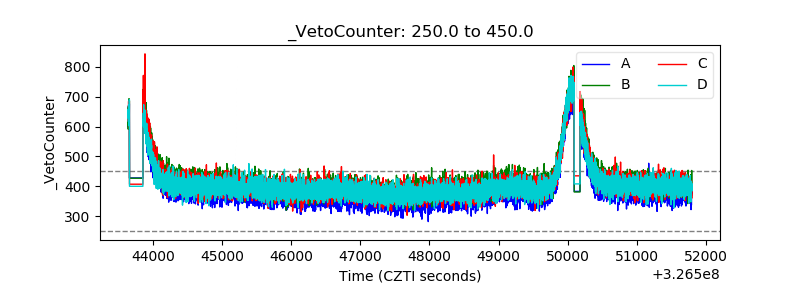 |