| Param | Original file | Final file |
|---|---|---|
| Filename | modeM0/AS1A08_003T16_9000003650_24917cztM0_level2.evt | modeM0/AS1A08_003T16_9000003650_24917cztM0_level2_quad_clean.evt |
| Size (bytes) | 218,839,680 | 55,967,040 |
| Size | 208.7 MB | 53.4 MB |
| Events in quadrant A | 1,571,488 | 370,673 |
| Events in quadrant B | 1,629,708 | 374,306 |
| Events in quadrant C | 1,586,565 | 353,805 |
| Events in quadrant D | 1,602,588 | 350,548 |
| Mode SS | |||
|---|---|---|---|
| Quadrant | BADHDUFLAG | Total packets | Discarded packets |
| A | 0 | 70 | 0 |
| B | 0 | 70 | 0 |
| C | 0 | 70 | 0 |
| D | 0 | 70 | 0 |
| Mode M0 | |||
|---|---|---|---|
| Quadrant | BADHDUFLAG | Total packets | Discarded packets |
| A | 0 | 6933 | 0 |
| B | 0 | 7146 | 0 |
| C | 0 | 6939 | 0 |
| D | 0 | 7098 | 0 |
| Quadrant | Total seconds | Saturated seconds | Saturation percentage |
|---|---|---|---|
| A | 3457 | 2 | 0.057854% |
| B | 3458 | 2 | 0.057837% |
| C | 3458 | 8 | 0.231348% |
| D | 3458 | 4 | 0.115674% |
Noise dominated data is calculated using 1-second bins in cleaned event files. If a bin has >2000 counts, and if more than 50% of those come from <1% of pixels, then it is considered to be noise-dominated and hence unusable.
| Quadrant | # 1 sec bins | Bins with >0 counts | Bins with >2000 counts | High rate bins dominated by noise | Noise dominated (total time) | Noise dominated (detector-on time) | Marked lightcurve |
|---|---|---|---|---|---|---|---|
| A | 3457 | 3457 | 0 | 0 | 0.00% | 0.00% | 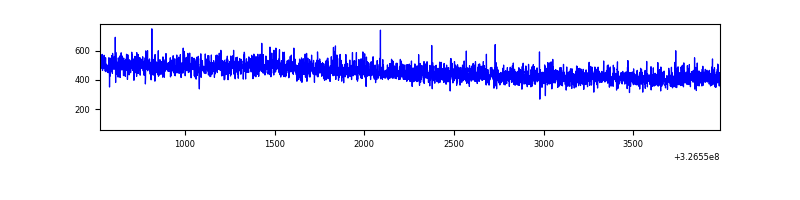 |
| B | 3458 | 3458 | 0 | 0 | 0.00% | 0.00% | 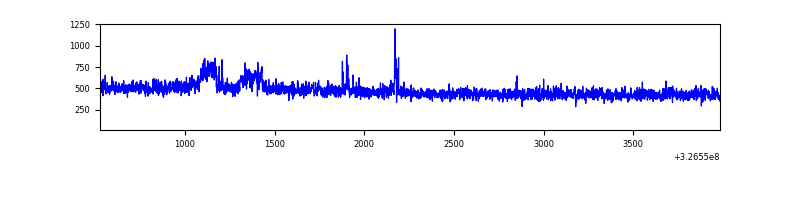 |
| C | 3458 | 3458 | 0 | 0 | 0.00% | 0.00% | 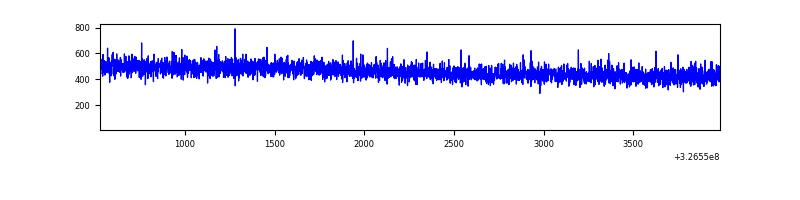 |
| D | 3458 | 3458 | 1 | 1 | 0.03% | 0.03% | 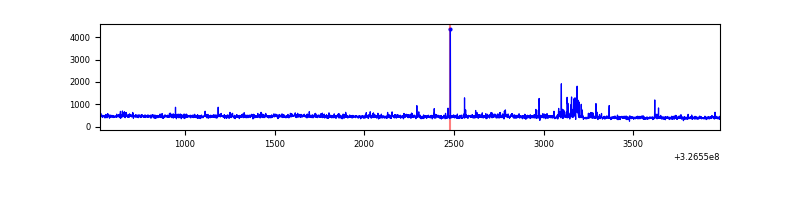 |
Top three noisy pixels from each quadrant. If the there are fewer than three noisy pixels in the level2.evt file, extra rows are filled as -1
| Pixel properties | Quadrant properties | ||||||
|---|---|---|---|---|---|---|---|
| Quadrant | DetID | PixID | Counts | Sigma | Mean | Median | Sigma |
| A | 13 | 254 | 5297 | 58.41 | 407 | 398 | 83.9 |
| A | 3 | 137 | 3830 | 40.92 | 407 | 398 | 83.9 |
| A | 0 | 226 | 3513 | 37.14 | 407 | 398 | 83.9 |
| B | 0 | 189 | 45973 | 584.05 | 400 | 391 | 78.0 |
| B | 12 | 111 | 9528 | 117.07 | 400 | 391 | 78.0 |
| B | 11 | 111 | 8501 | 103.91 | 400 | 391 | 78.0 |
| C | 14 | 238 | 62351 | 666.29 | 387 | 388 | 93.0 |
| C | 7 | 247 | 13487 | 140.85 | 387 | 388 | 93.0 |
| C | 13 | 61 | 2735 | 25.24 | 387 | 388 | 93.0 |
| D | 12 | 233 | 39499 | 404.81 | 395 | 383 | 96.6 |
| D | 1 | 52 | 30449 | 311.15 | 395 | 383 | 96.6 |
| D | 8 | 195 | 23431 | 238.53 | 395 | 383 | 96.6 |
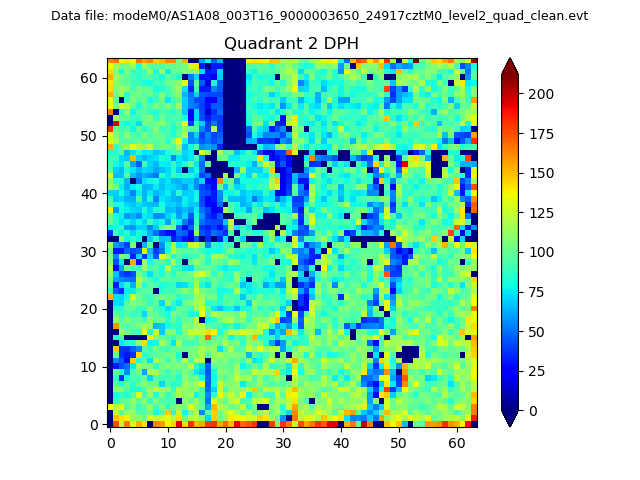
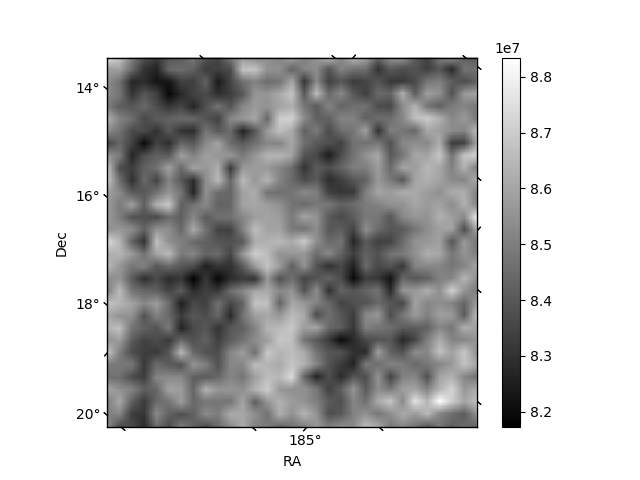
Histogram calculated using DETX and DETY for each event in the final _common_clean file
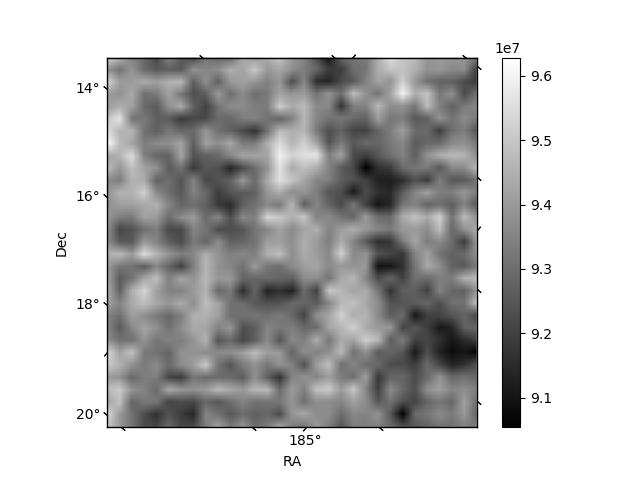
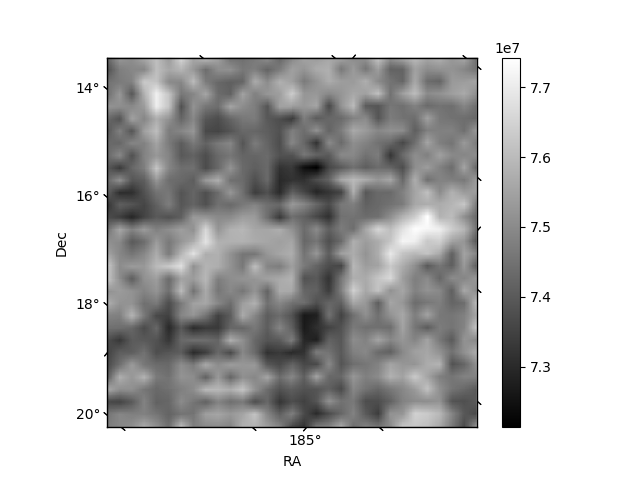
| Quadrant A | 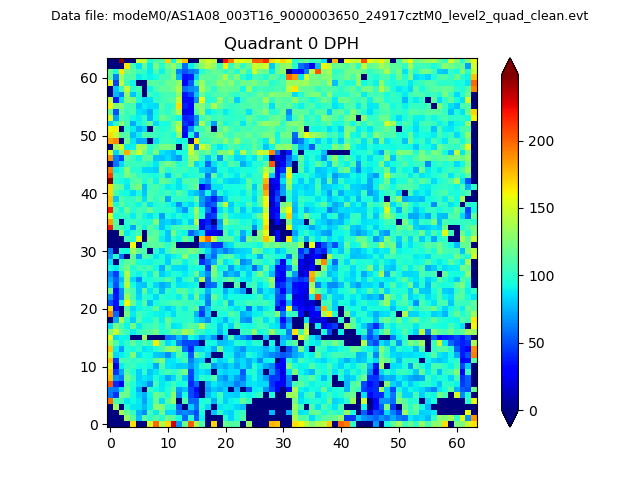 |
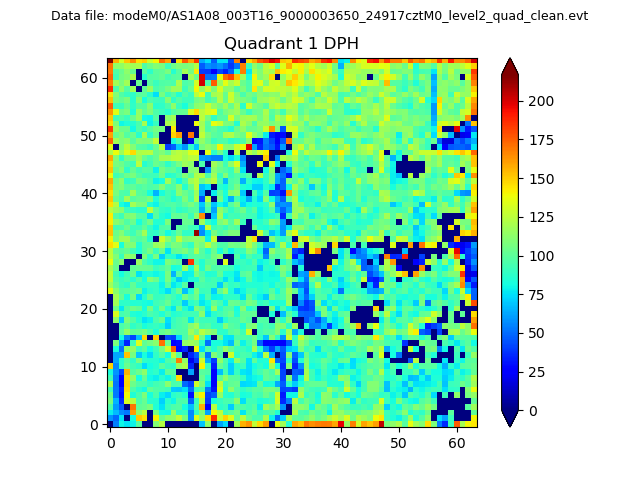 |
Quadrant B |
|---|---|---|---|
| Quadrant D | 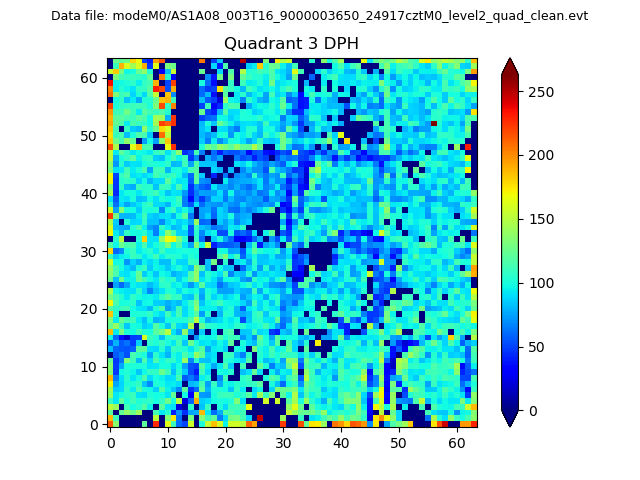 |
 |
Quadrant C |
| Plot type | Count rate plots | Images |
|---|---|---|
| Comparison with Poisson distribution Blue bars denote a histogram of data divided into 1 sec bins. Red curve is a Poisson curve with rate = median count rate of data. |
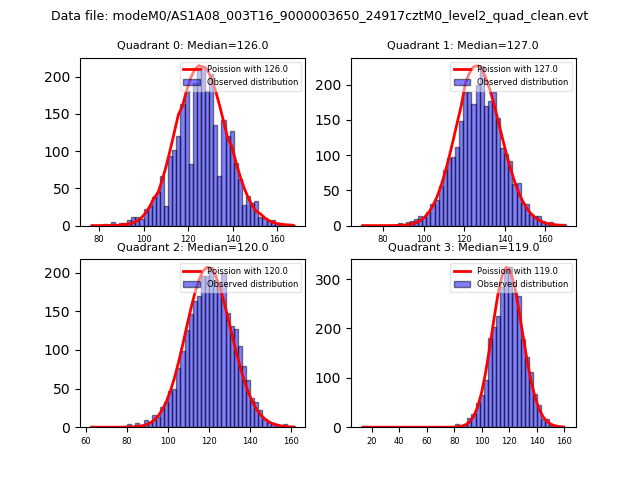 |
 |
| Quadrant-wise count rates Data is divided into 100 sec bins |
 |
|
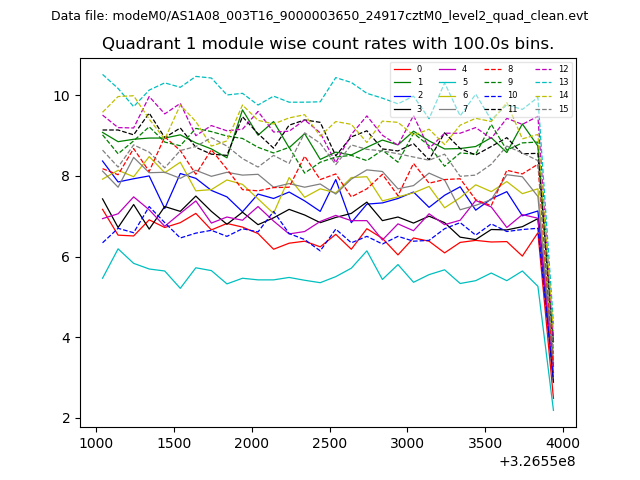
| Module-wise count rates for Quadrant A Data is divided into 100 sec bins |
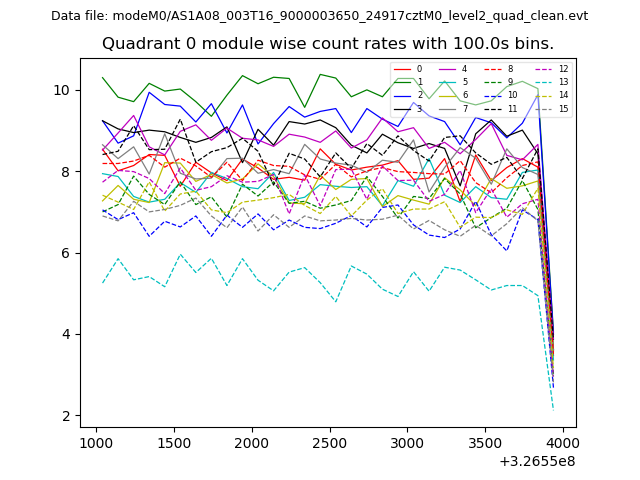 |
 |
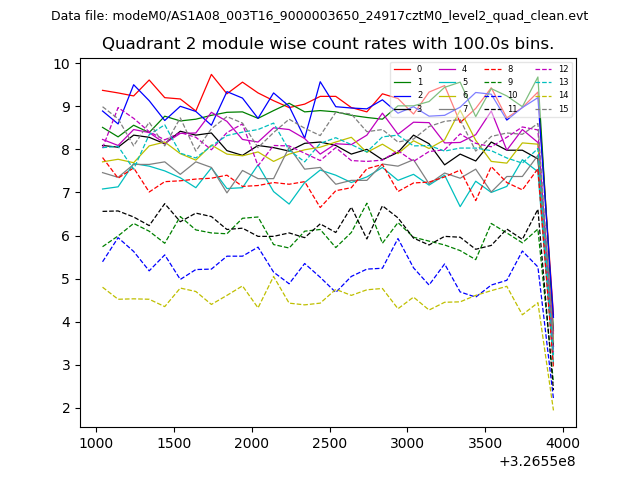
| Module-wise count rates for Quadrant B Data is divided into 100 sec bins |
 |
 |
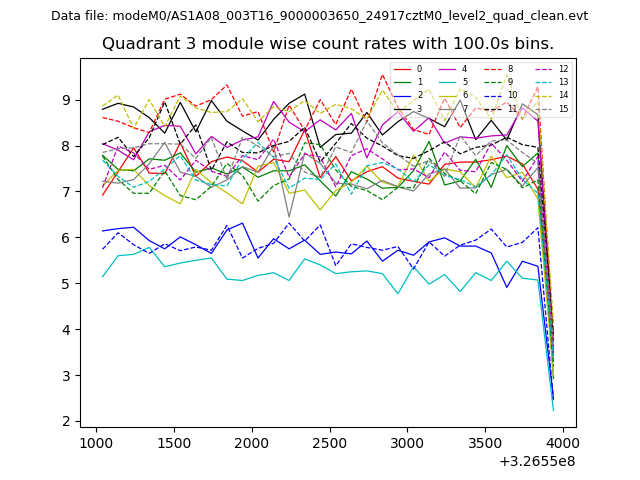
| Module-wise count rates for Quadrant C Data is divided into 100 sec bins |
 |
 |
| Module-wise count rates for Quadrant D Data is divided into 100 sec bins |
 |
 |
| Parameter | Plot |
|---|---|
| CZT HV Monitor | 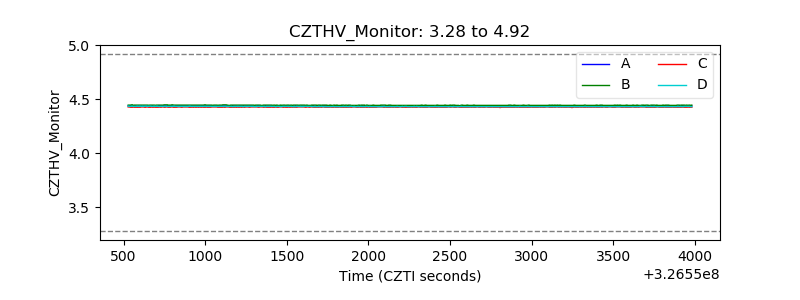 |
| D_VDD | 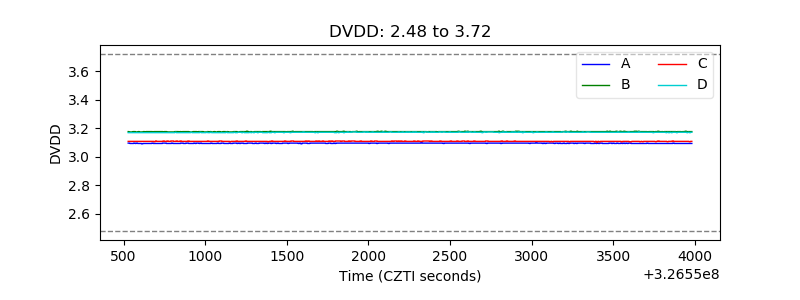 |
| Temperature 1 | 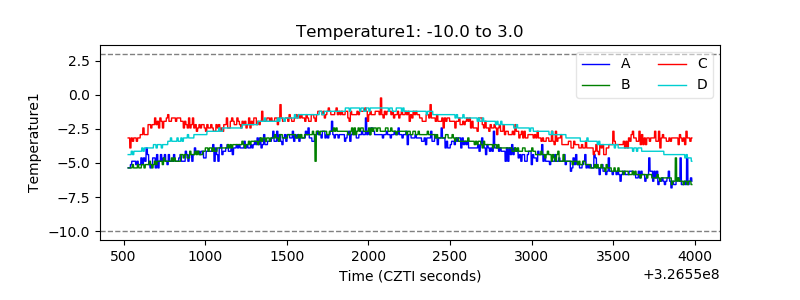 |
| Veto HV Monitor | 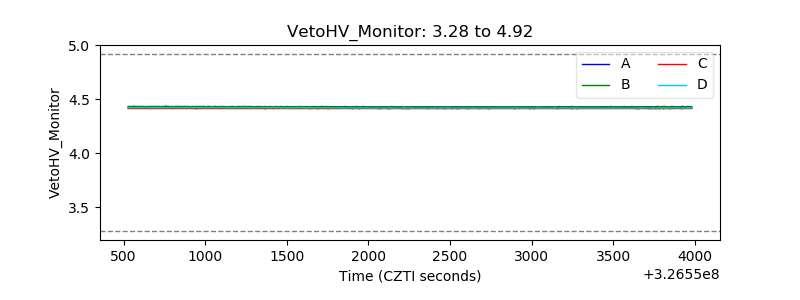 |
| Veto LLD | 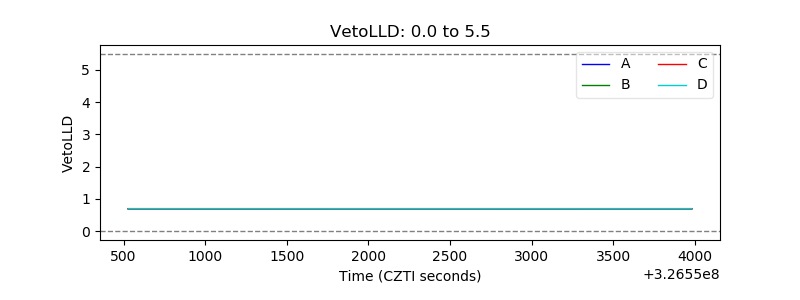 |
| Alpha Counter | 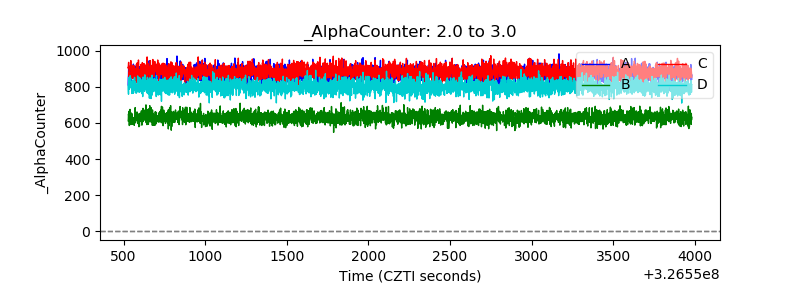 |
| _CPM_Rate | 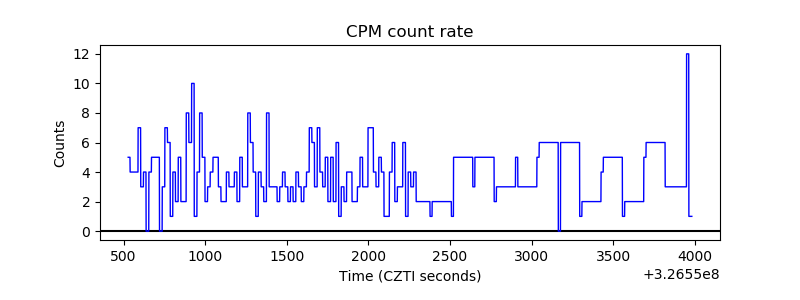 |
| CZT Counter | 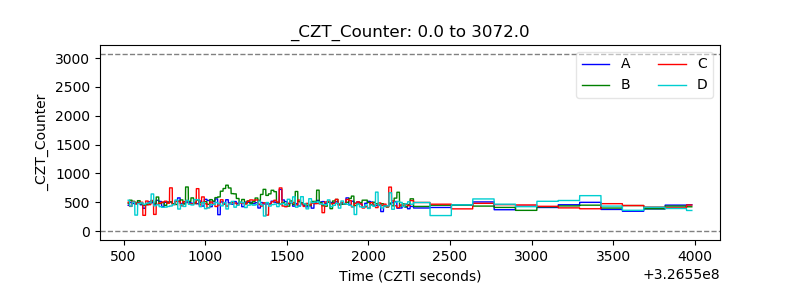 |
| +2.5 Volts monitor |  |
| +5 Volts monitor |  |
| _ROLL_ROT | 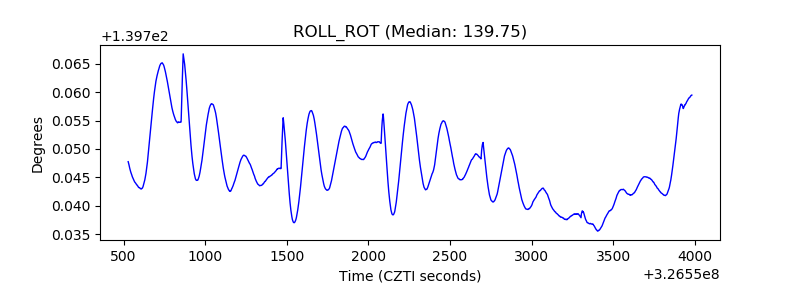 |
| _Roll_DEC | 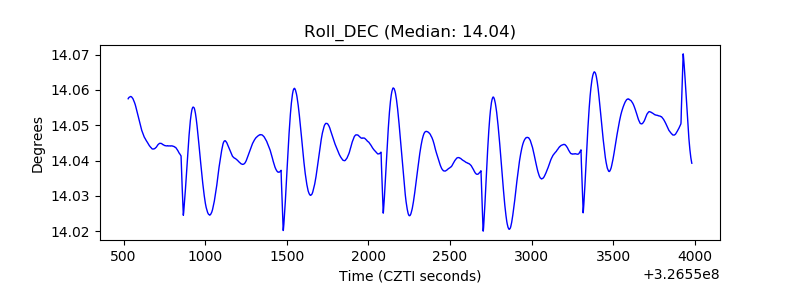 |
| _Roll_RA | 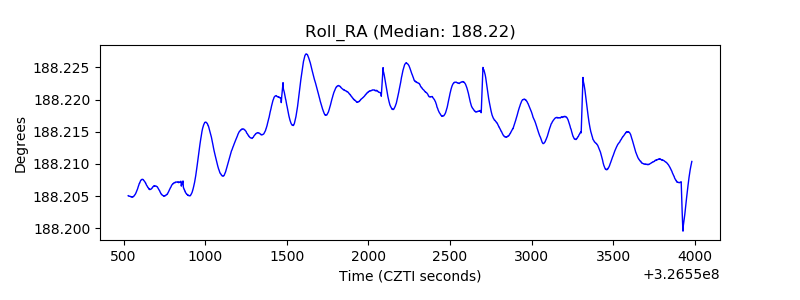 |
| Veto Counter | 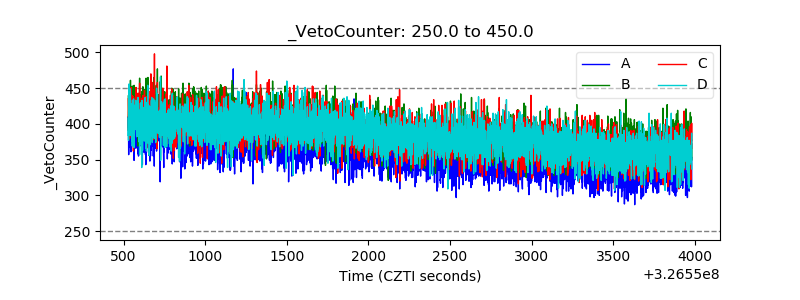 |