| Param | Original file | Final file |
|---|---|---|
| Filename | modeM0/AS1T03_205T01_9000003652_24919cztM0_level2.evt | modeM0/AS1T03_205T01_9000003652_24919cztM0_level2_quad_clean.evt |
| Size (bytes) | 837,596,160 | 236,571,840 |
| Size | 798.8 MB | 225.6 MB |
| Events in quadrant A | 6,282,952 | 1,600,447 |
| Events in quadrant B | 6,060,391 | 1,618,153 |
| Events in quadrant C | 5,888,698 | 1,542,827 |
| Events in quadrant D | 6,280,835 | 1,533,255 |
| Mode SS | |||
|---|---|---|---|
| Quadrant | BADHDUFLAG | Total packets | Discarded packets |
| A | 0 | 256 | 0 |
| B | 0 | 256 | 0 |
| C | 0 | 256 | 0 |
| D | 0 | 256 | 0 |
| Mode M9 | |||
|---|---|---|---|
| Quadrant | BADHDUFLAG | Total packets | Discarded packets |
| A | 0 | 14 | 0 |
| B | 0 | 14 | 0 |
| C | 0 | 14 | 0 |
| D | 0 | 14 | 0 |
| Mode M0 | |||
|---|---|---|---|
| Quadrant | BADHDUFLAG | Total packets | Discarded packets |
| A | 0 | 27017 | 2 |
| B | 0 | 26177 | 2 |
| C | 0 | 25798 | 2 |
| D | 0 | 27180 | 7 |
| Quadrant | Total seconds | Saturated seconds | Saturation percentage |
|---|---|---|---|
| A | 12604 | 138 | 1.094891% |
| B | 12605 | 114 | 0.904403% |
| C | 12605 | 142 | 1.126537% |
| D | 12604 | 99 | 0.785465% |
Noise dominated data is calculated using 1-second bins in cleaned event files. If a bin has >2000 counts, and if more than 50% of those come from <1% of pixels, then it is considered to be noise-dominated and hence unusable.
| Quadrant | # 1 sec bins | Bins with >0 counts | Bins with >2000 counts | High rate bins dominated by noise | Noise dominated (total time) | Noise dominated (detector-on time) | Marked lightcurve |
|---|---|---|---|---|---|---|---|
| A | 13969 | 12606 | 25 | 25 | 0.18% | 0.20% | 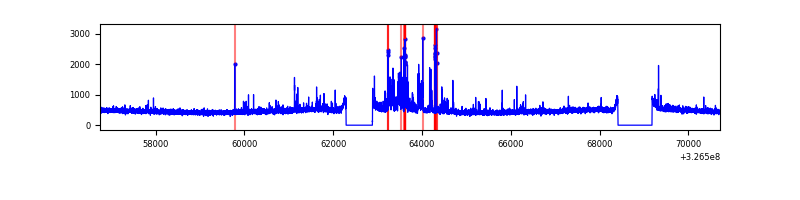 |
| B | 13970 | 12607 | 6 | 6 | 0.04% | 0.05% | 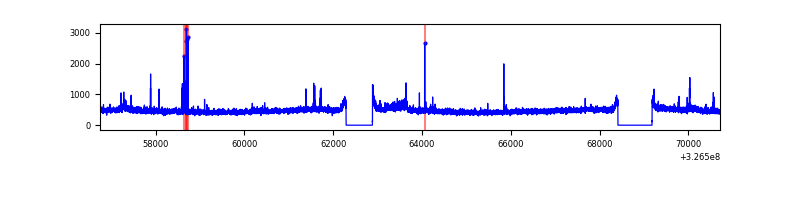 |
| C | 13970 | 12607 | 5 | 5 | 0.04% | 0.04% | 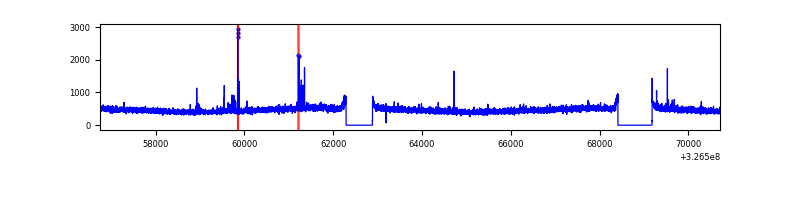 |
| D | 13969 | 12606 | 32 | 32 | 0.23% | 0.25% | 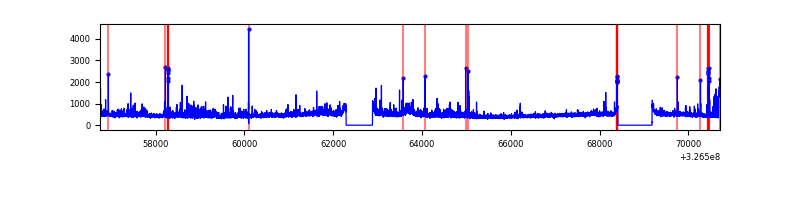 |
Top three noisy pixels from each quadrant. If the there are fewer than three noisy pixels in the level2.evt file, extra rows are filled as -1
| Pixel properties | Quadrant properties | ||||||
|---|---|---|---|---|---|---|---|
| Quadrant | DetID | PixID | Counts | Sigma | Mean | Median | Sigma |
| A | 15 | 223 | 396878 | 1333.96 | 1493 | 1460 | 296.4 |
| A | 15 | 239 | 102467 | 340.75 | 1493 | 1460 | 296.4 |
| A | 13 | 254 | 19024 | 59.25 | 1493 | 1460 | 296.4 |
| B | 0 | 189 | 131595 | 462.9 | 1481 | 1445 | 281.2 |
| B | 0 | 229 | 35058 | 119.55 | 1481 | 1445 | 281.2 |
| B | 12 | 111 | 34701 | 118.28 | 1481 | 1445 | 281.2 |
| C | 14 | 238 | 226859 | 683.75 | 1424 | 1433 | 329.7 |
| C | 2 | 16 | 76112 | 226.51 | 1424 | 1433 | 329.7 |
| C | 7 | 247 | 37064 | 108.07 | 1424 | 1433 | 329.7 |
| D | 1 | 52 | 243542 | 693.39 | 1447 | 1404 | 349.2 |
| D | 2 | 244 | 238664 | 679.42 | 1447 | 1404 | 349.2 |
| D | 8 | 195 | 235397 | 670.06 | 1447 | 1404 | 349.2 |
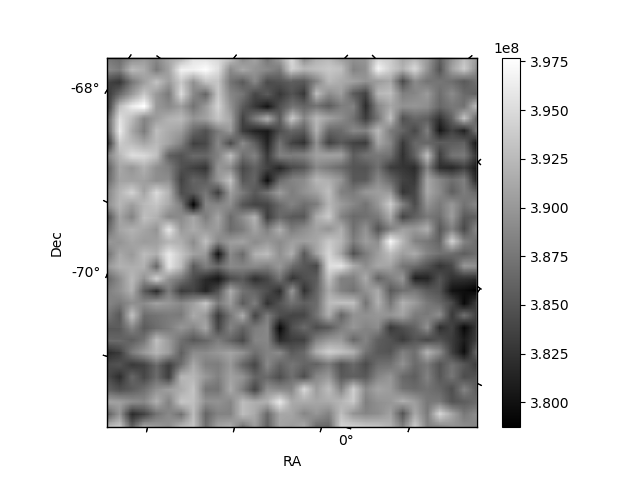
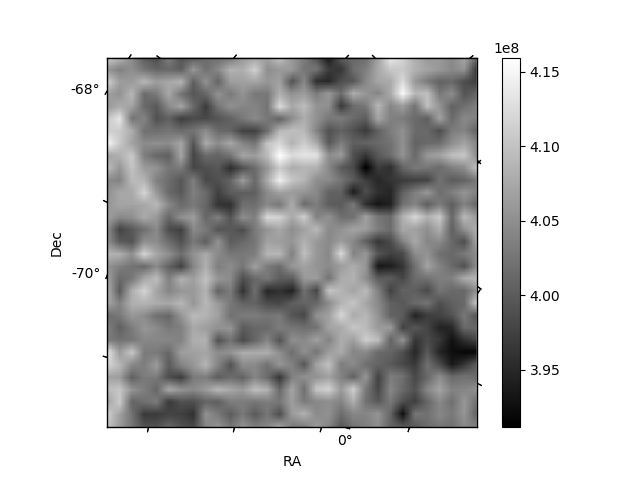
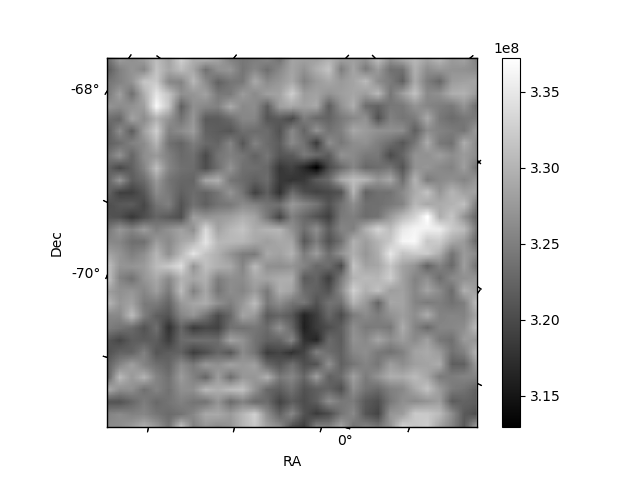
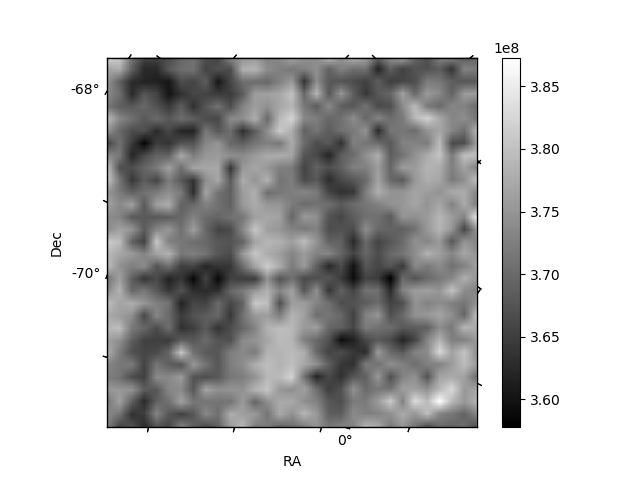
Histogram calculated using DETX and DETY for each event in the final _common_clean file
| Quadrant A | 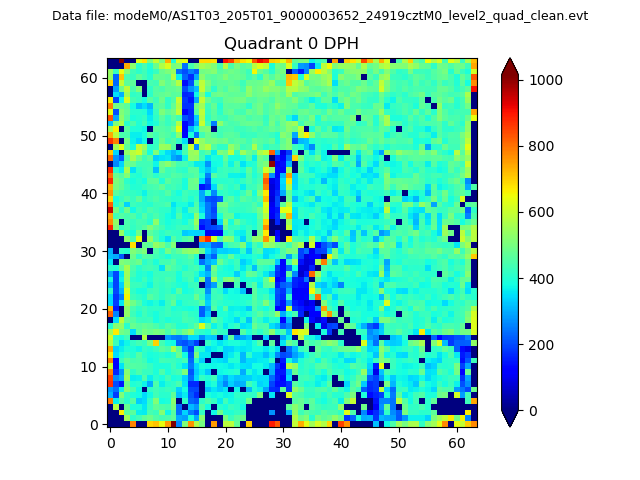 |
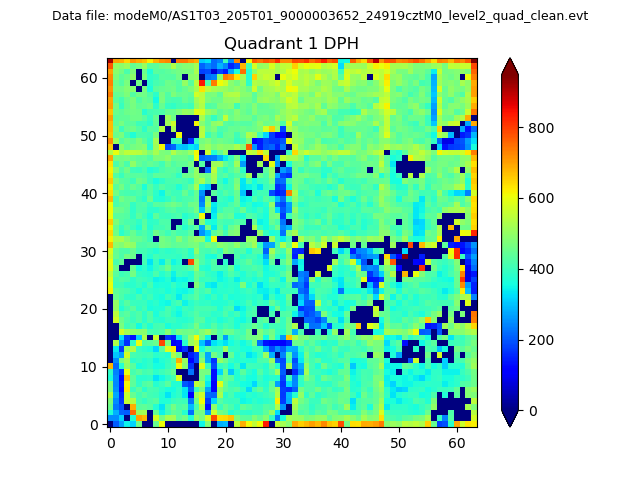 |
Quadrant B |
|---|---|---|---|
| Quadrant D |  |
 |
Quadrant C |
| Plot type | Count rate plots | Images |
|---|---|---|
| Comparison with Poisson distribution Blue bars denote a histogram of data divided into 1 sec bins. Red curve is a Poisson curve with rate = median count rate of data. |
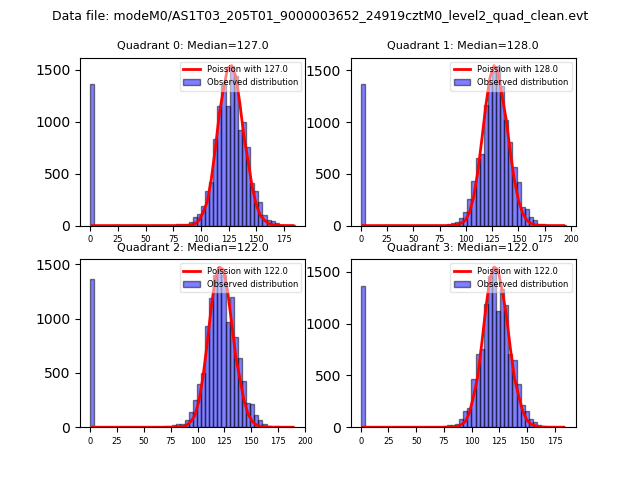 |
 |
| Quadrant-wise count rates Data is divided into 100 sec bins |
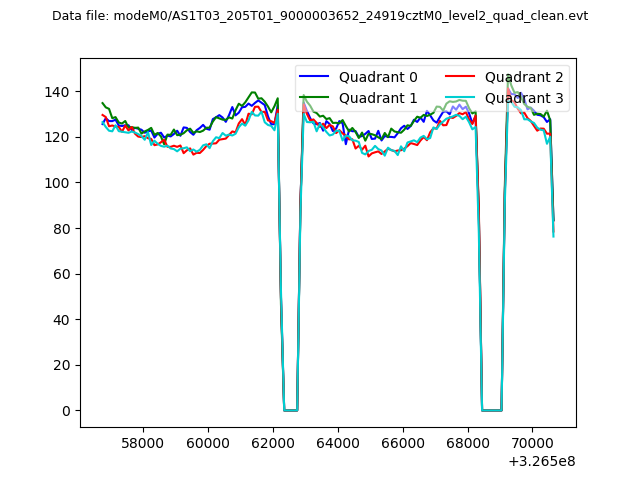 |
|
| Module-wise count rates for Quadrant A Data is divided into 100 sec bins |
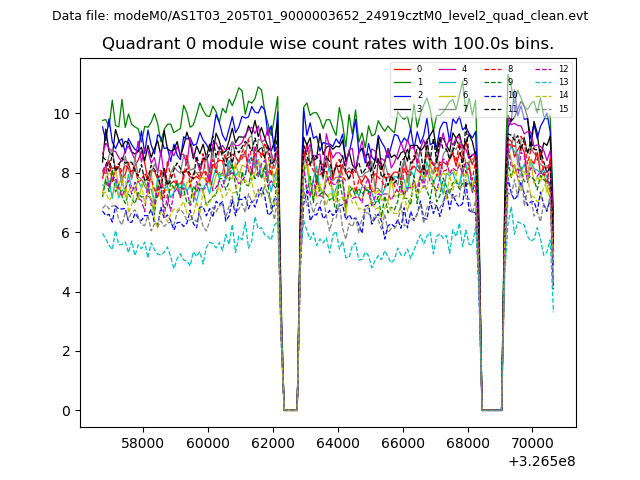 |
 |
| Module-wise count rates for Quadrant B Data is divided into 100 sec bins |
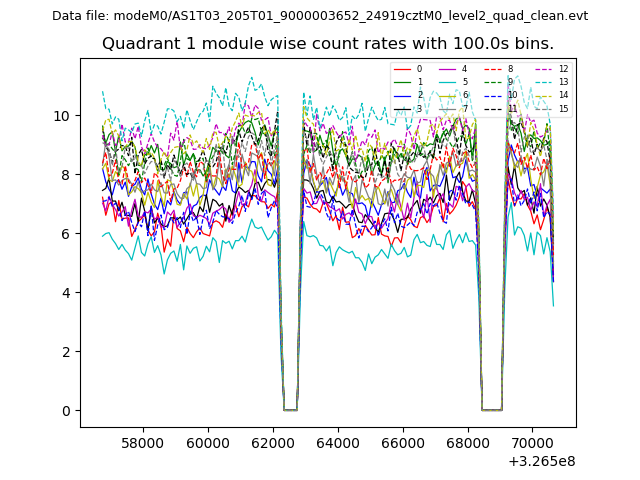 |
 |
| Module-wise count rates for Quadrant C Data is divided into 100 sec bins |
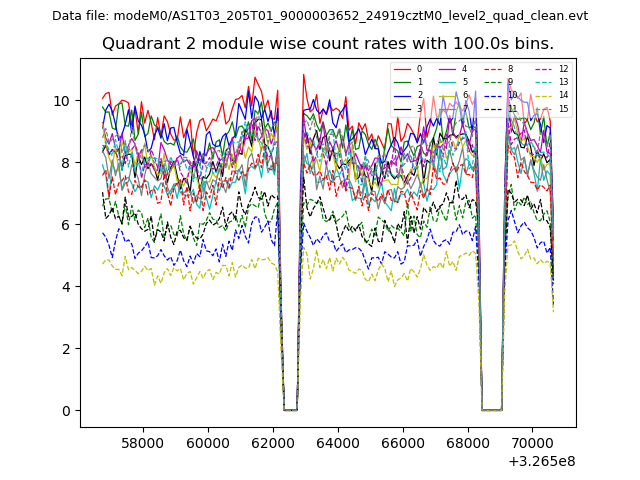 |
 |
| Module-wise count rates for Quadrant D Data is divided into 100 sec bins |
 |
 |
| Parameter | Plot |
|---|---|
| CZT HV Monitor | 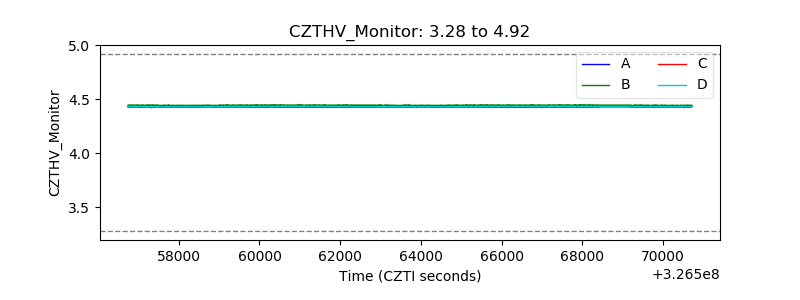 |
| D_VDD | 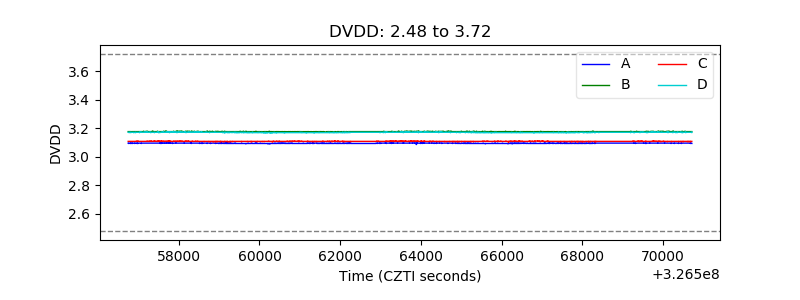 |
| Temperature 1 | 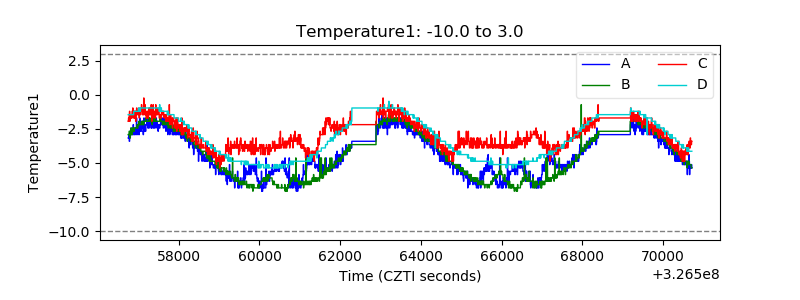 |
| Veto HV Monitor | 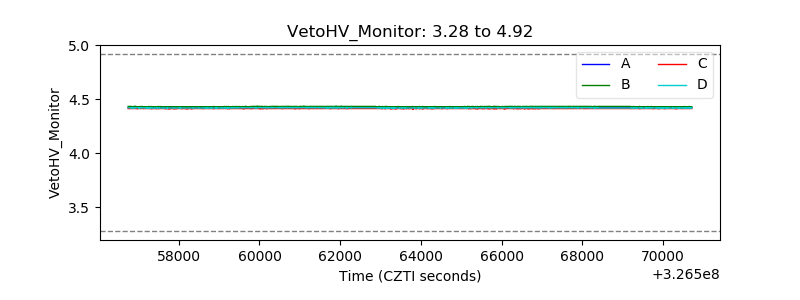 |
| Veto LLD | 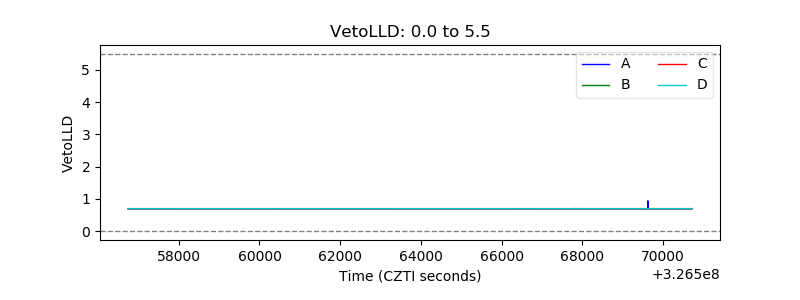 |
| Alpha Counter | 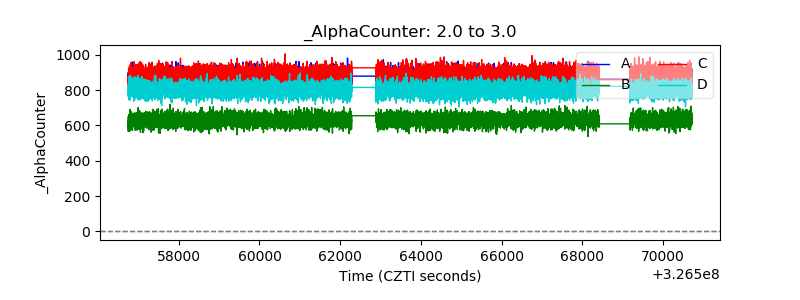 |
| _CPM_Rate | 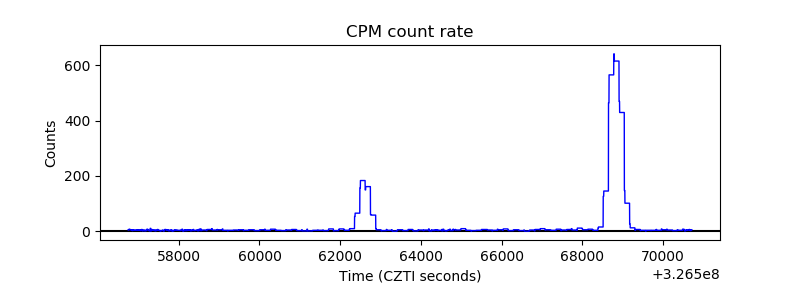 |
| CZT Counter |  |
| +2.5 Volts monitor | 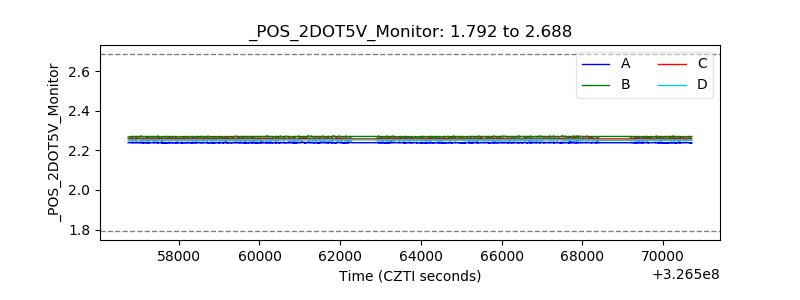 |
| +5 Volts monitor | 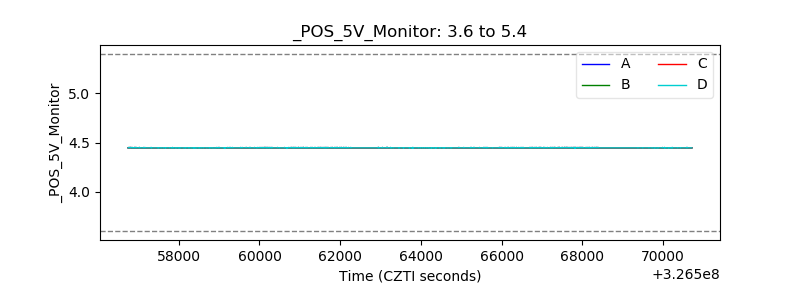 |
| _ROLL_ROT | 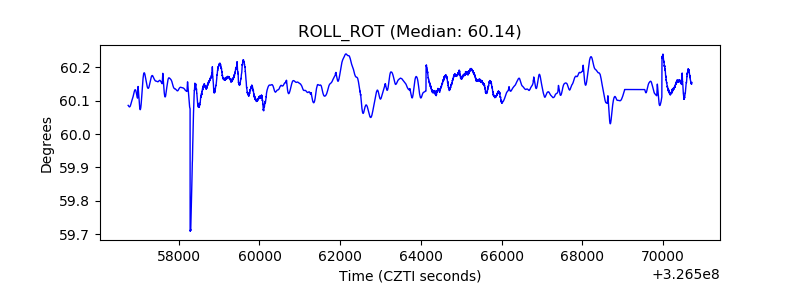 |
| _Roll_DEC | 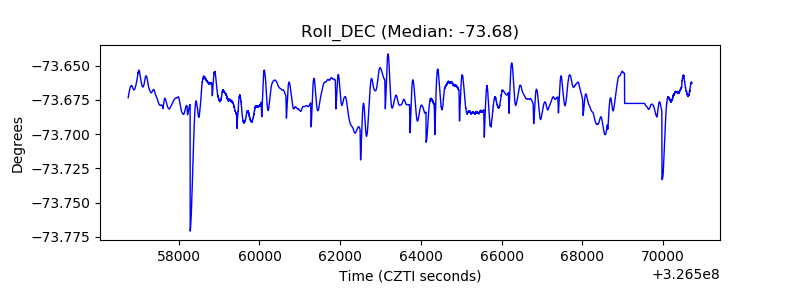 |
| _Roll_RA | 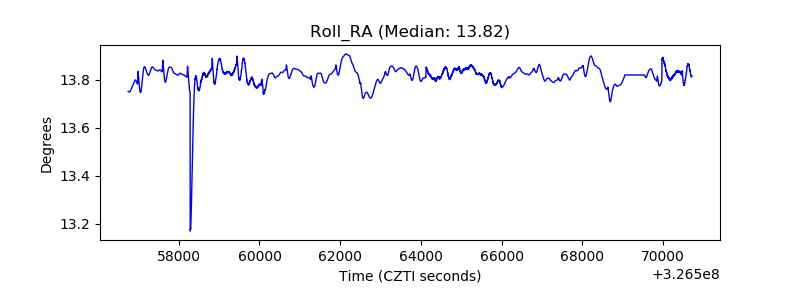 |
| Veto Counter | 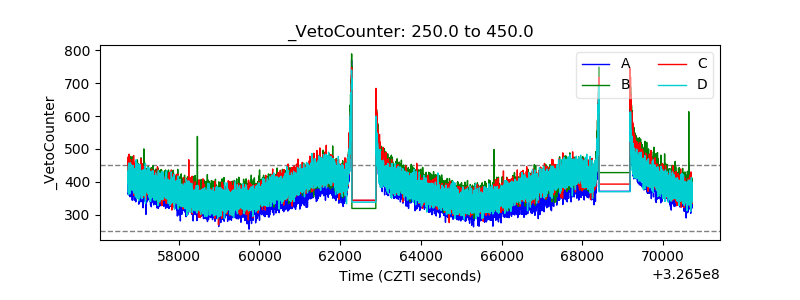 |