| Param | Original file | Final file |
|---|---|---|
| Filename | modeM0/AS1T03_205T01_9000003652_24921cztM0_level2.evt | modeM0/AS1T03_205T01_9000003652_24921cztM0_level2_quad_clean.evt |
| Size (bytes) | 445,858,560 | 132,333,120 |
| Size | 425.2 MB | 126.2 MB |
| Events in quadrant A | 3,143,652 | 908,799 |
| Events in quadrant B | 3,237,798 | 924,959 |
| Events in quadrant C | 3,264,144 | 865,821 |
| Events in quadrant D | 3,411,980 | 851,946 |
| Mode SS | |||
|---|---|---|---|
| Quadrant | BADHDUFLAG | Total packets | Discarded packets |
| A | 0 | 134 | 0 |
| B | 0 | 134 | 0 |
| C | 0 | 134 | 0 |
| D | 0 | 134 | 0 |
| Mode M9 | |||
|---|---|---|---|
| Quadrant | BADHDUFLAG | Total packets | Discarded packets |
| A | 0 | 21 | 0 |
| B | 0 | 21 | 0 |
| C | 0 | 21 | 0 |
| D | 0 | 21 | 0 |
| Mode M0 | |||
|---|---|---|---|
| Quadrant | BADHDUFLAG | Total packets | Discarded packets |
| A | 0 | 13591 | 2 |
| B | 0 | 13841 | 2 |
| C | 0 | 13869 | 2 |
| D | 0 | 14688 | 2 |
| Quadrant | Total seconds | Saturated seconds | Saturation percentage |
|---|---|---|---|
| A | 6554 | 36 | 0.549283% |
| B | 6554 | 63 | 0.961245% |
| C | 6554 | 103 | 1.571559% |
| D | 6555 | 96 | 1.464531% |
Noise dominated data is calculated using 1-second bins in cleaned event files. If a bin has >2000 counts, and if more than 50% of those come from <1% of pixels, then it is considered to be noise-dominated and hence unusable.
| Quadrant | # 1 sec bins | Bins with >0 counts | Bins with >2000 counts | High rate bins dominated by noise | Noise dominated (total time) | Noise dominated (detector-on time) | Marked lightcurve |
|---|---|---|---|---|---|---|---|
| A | 8619 | 6556 | 0 | 0 | 0.00% | 0.00% | 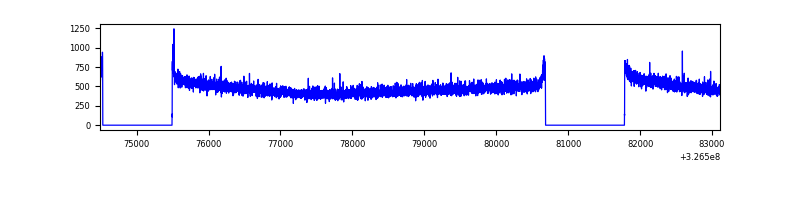 |
| B | 8619 | 6556 | 1 | 1 | 0.01% | 0.02% | 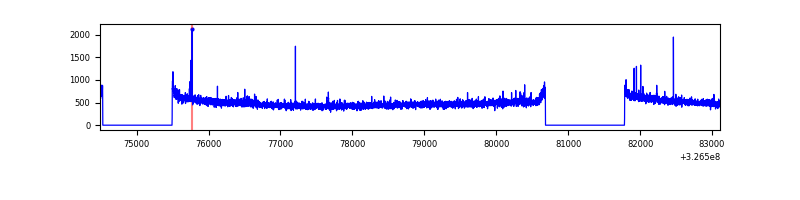 |
| C | 8619 | 6556 | 9 | 9 | 0.10% | 0.14% | 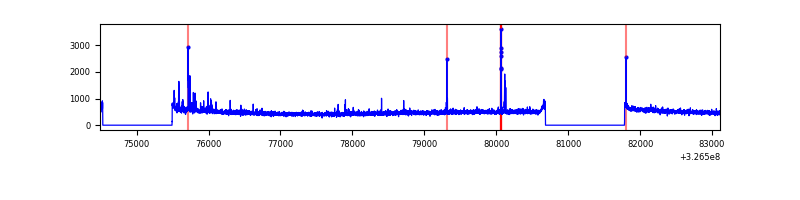 |
| D | 8620 | 6557 | 68 | 68 | 0.79% | 1.04% | 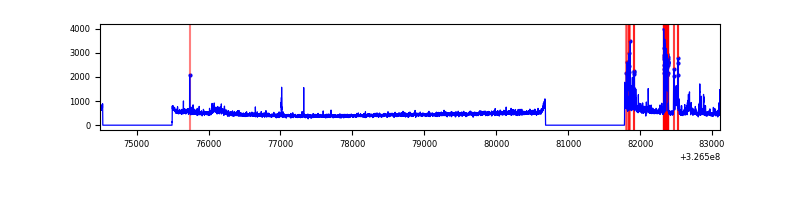 |
Top three noisy pixels from each quadrant. If the there are fewer than three noisy pixels in the level2.evt file, extra rows are filled as -1
| Pixel properties | Quadrant properties | ||||||
|---|---|---|---|---|---|---|---|
| Quadrant | DetID | PixID | Counts | Sigma | Mean | Median | Sigma |
| A | 13 | 254 | 10776 | 61.53 | 814 | 797 | 162.2 |
| A | 3 | 137 | 7472 | 41.16 | 814 | 797 | 162.2 |
| A | 0 | 226 | 6873 | 37.47 | 814 | 797 | 162.2 |
| B | 0 | 189 | 21704 | 138.06 | 811 | 793 | 151.5 |
| B | 12 | 111 | 18398 | 116.24 | 811 | 793 | 151.5 |
| B | 11 | 111 | 16492 | 103.65 | 811 | 793 | 151.5 |
| C | 14 | 238 | 126665 | 703.84 | 772 | 778 | 178.9 |
| C | 2 | 16 | 113993 | 632.99 | 772 | 778 | 178.9 |
| C | 7 | 247 | 8456 | 42.93 | 772 | 778 | 178.9 |
| D | 1 | 52 | 377926 | 2023.17 | 779 | 759 | 186.4 |
| D | 8 | 195 | 48775 | 257.56 | 779 | 759 | 186.4 |
| D | 2 | 234 | 27473 | 143.3 | 779 | 759 | 186.4 |
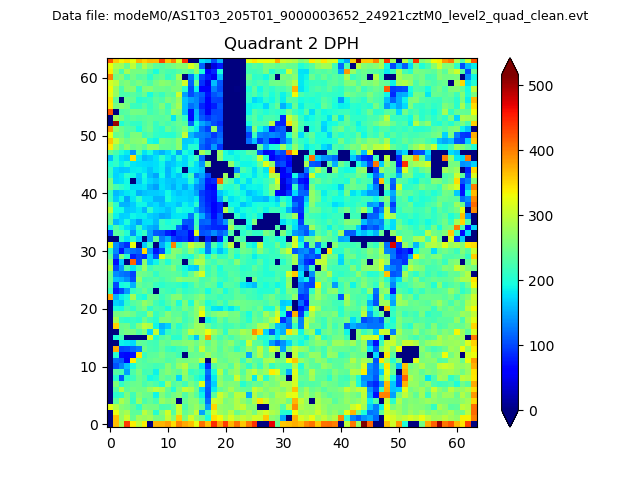
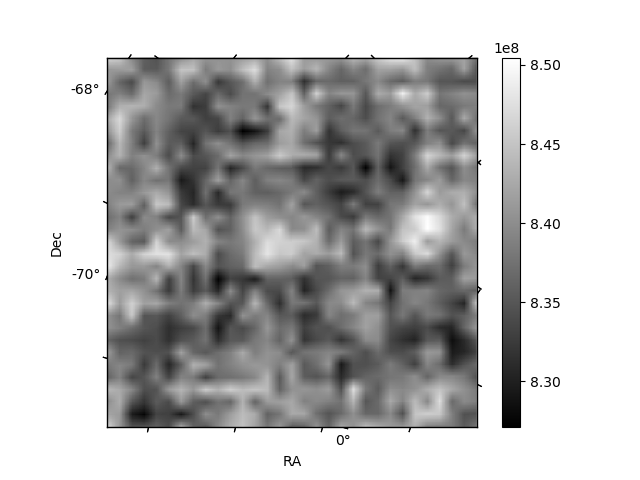
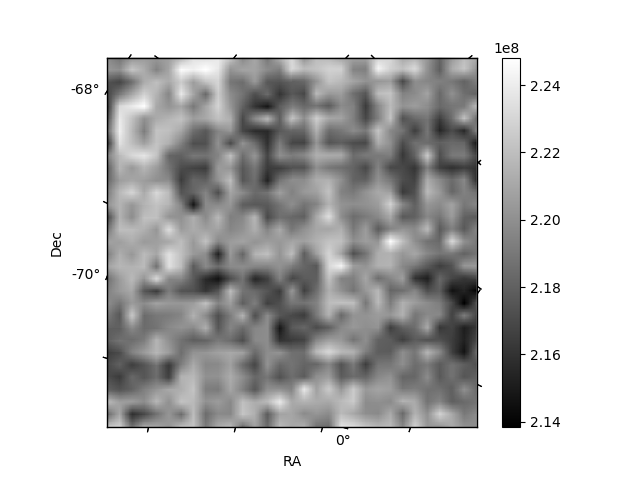
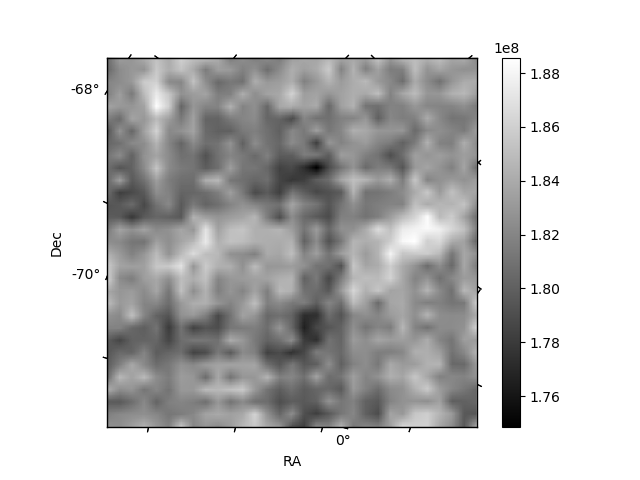
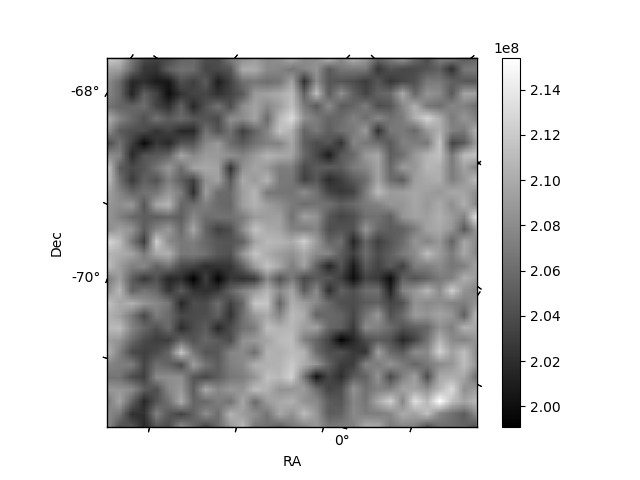
Histogram calculated using DETX and DETY for each event in the final _common_clean file
| Quadrant A | 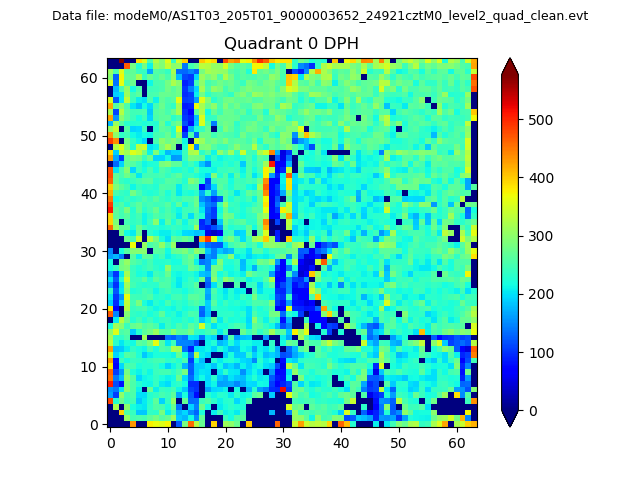 |
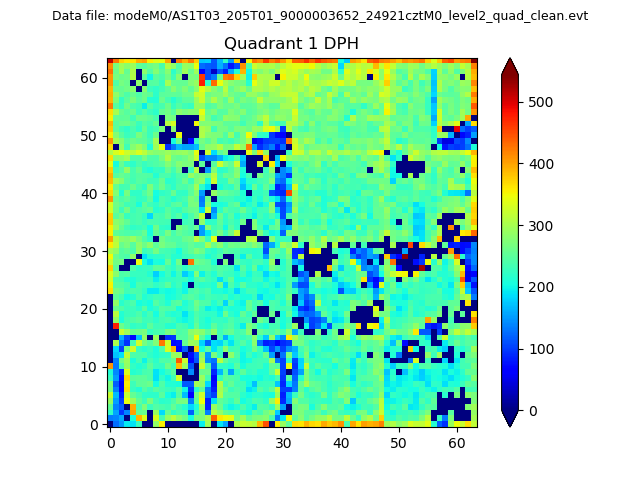 |
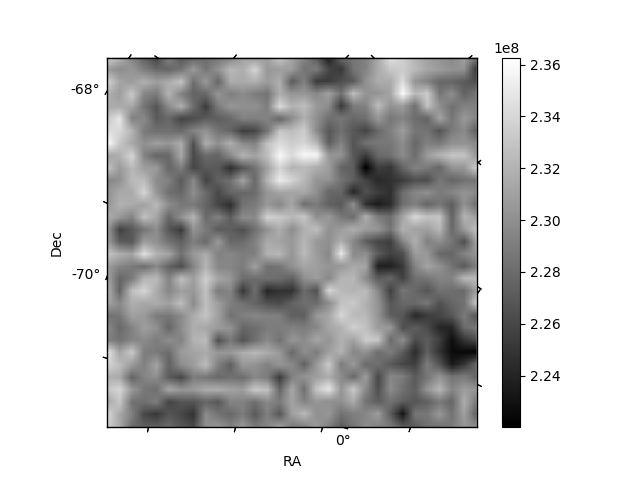
Quadrant B |
|---|---|---|---|
| Quadrant D | 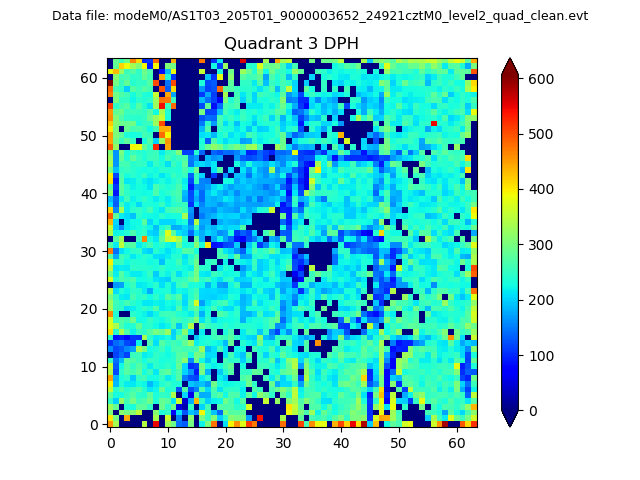 |
 |
Quadrant C |
| Plot type | Count rate plots | Images |
|---|---|---|
| Comparison with Poisson distribution Blue bars denote a histogram of data divided into 1 sec bins. Red curve is a Poisson curve with rate = median count rate of data. |
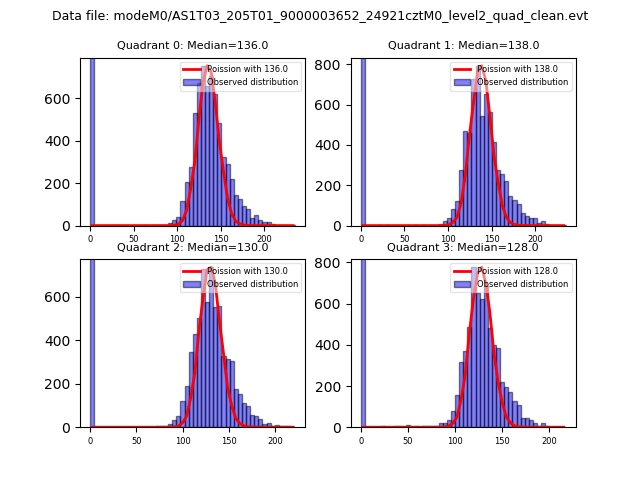 |
 |
| Quadrant-wise count rates Data is divided into 100 sec bins |
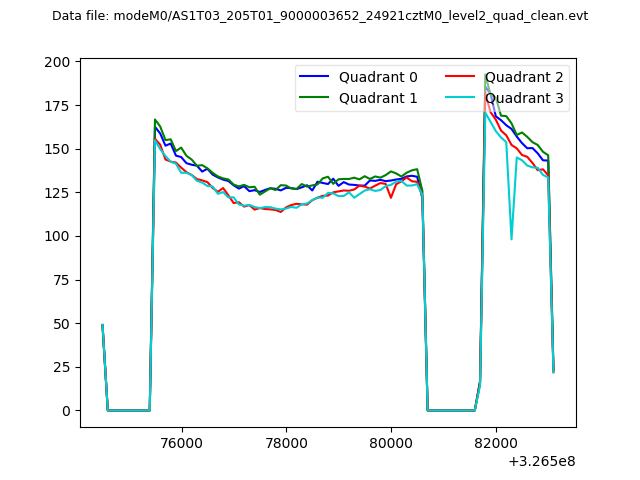 |
|
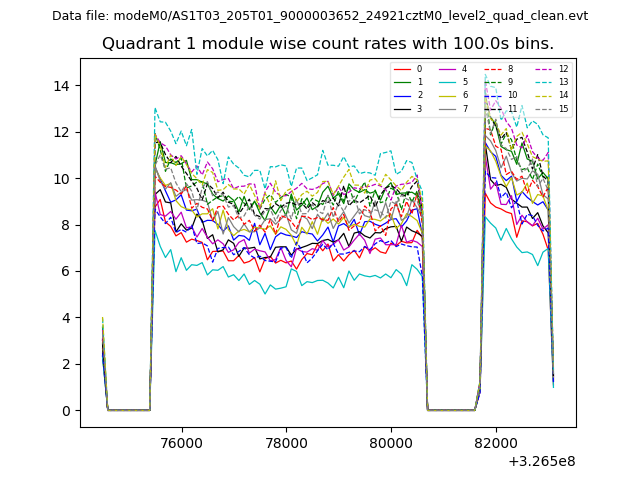
| Module-wise count rates for Quadrant A Data is divided into 100 sec bins |
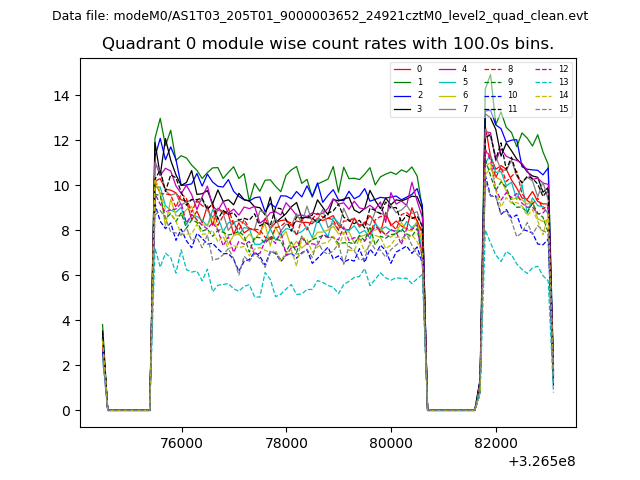 |
 |
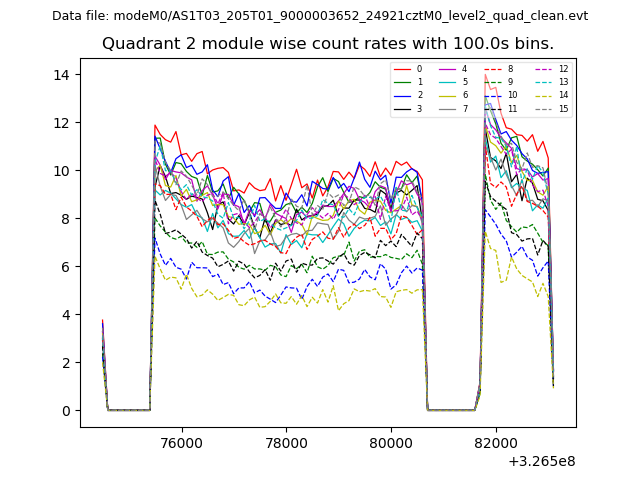
| Module-wise count rates for Quadrant B Data is divided into 100 sec bins |
 |
 |
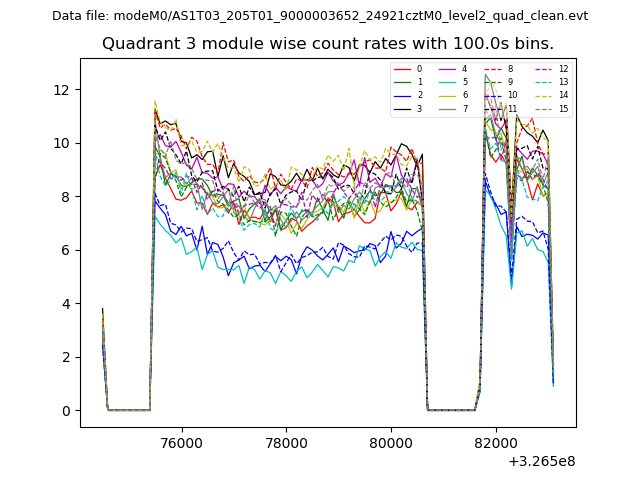
| Module-wise count rates for Quadrant C Data is divided into 100 sec bins |
 |
 |
| Module-wise count rates for Quadrant D Data is divided into 100 sec bins |
 |
 |
| Parameter | Plot |
|---|---|
| CZT HV Monitor | 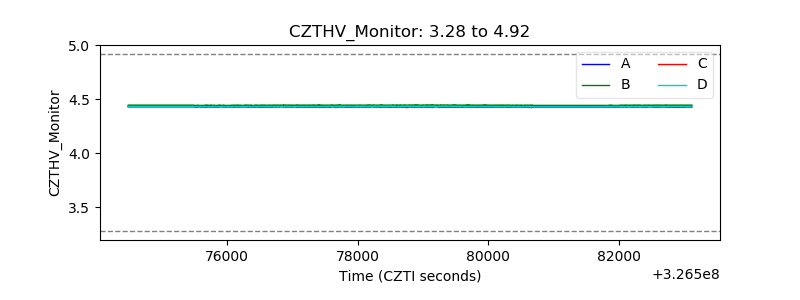 |
| D_VDD | 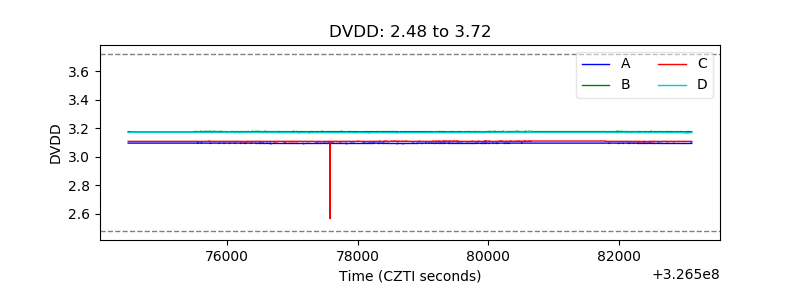 |
| Temperature 1 | 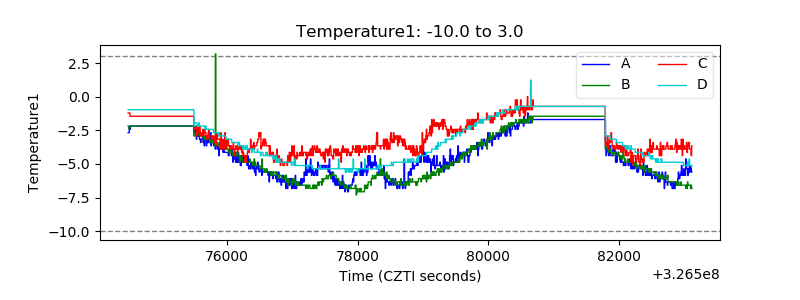 |
| Veto HV Monitor | 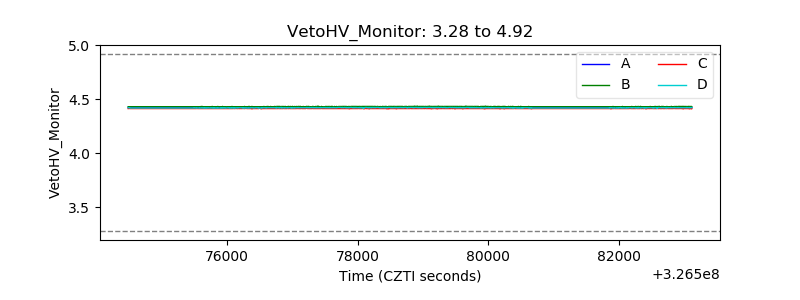 |
| Veto LLD | 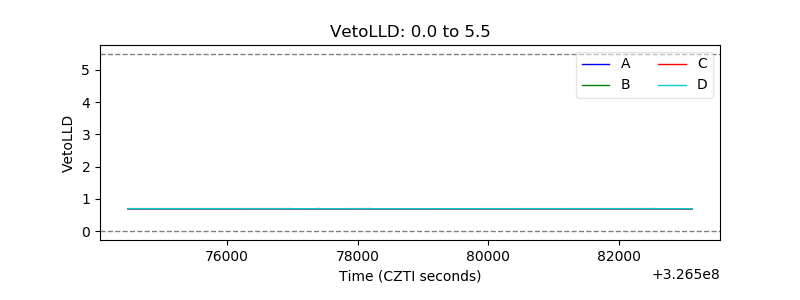 |
| Alpha Counter |  |
| _CPM_Rate | 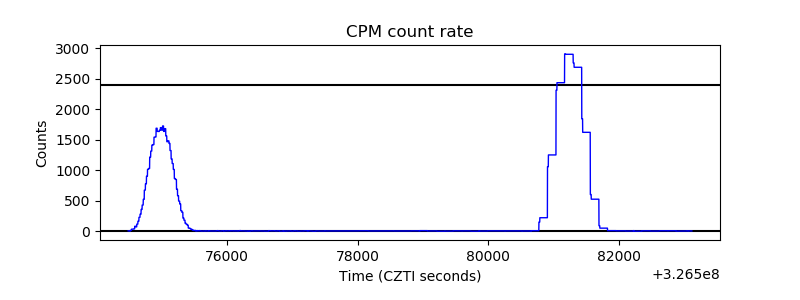 |
| CZT Counter | 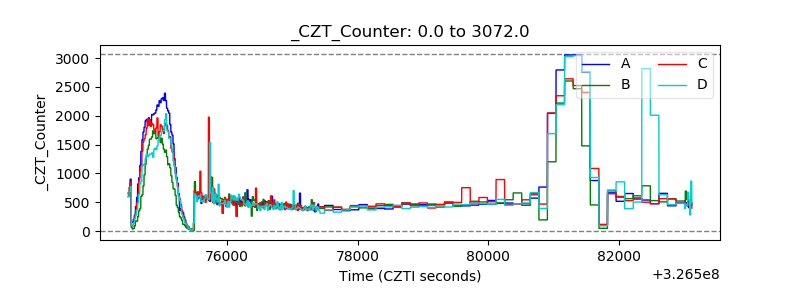 |
| +2.5 Volts monitor |  |
| +5 Volts monitor |  |
| _ROLL_ROT | 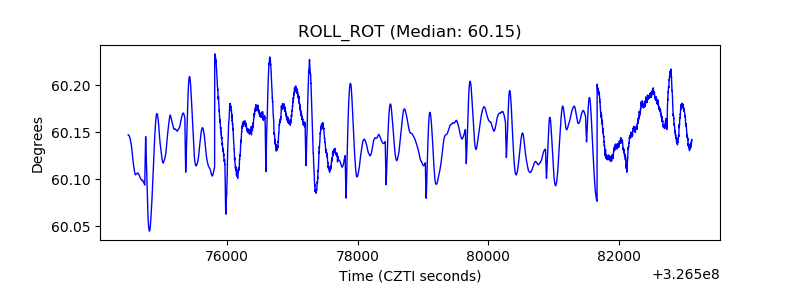 |
| _Roll_DEC | 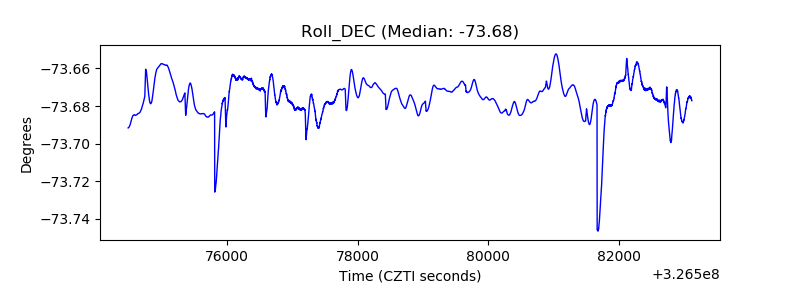 |
| _Roll_RA | 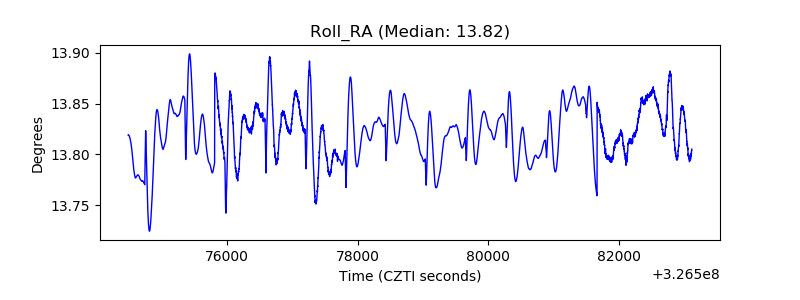 |
| Veto Counter | 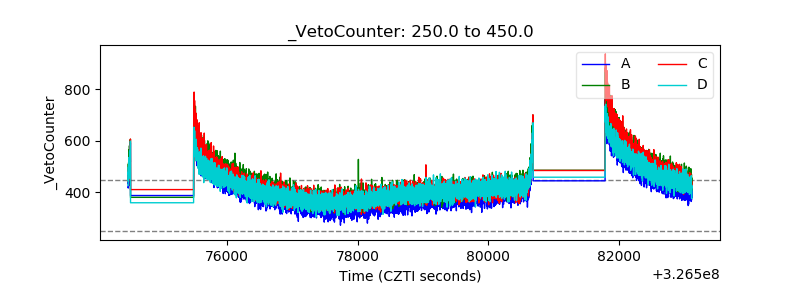 |