| Param | Original file | Final file |
|---|---|---|
| Filename | modeM0/AS1T03_205T01_9000003652_24923cztM0_level2.evt | modeM0/AS1T03_205T01_9000003652_24923cztM0_level2_quad_clean.evt |
| Size (bytes) | 484,744,320 | 137,574,720 |
| Size | 462.3 MB | 131.2 MB |
| Events in quadrant A | 3,203,475 | 950,949 |
| Events in quadrant B | 3,318,794 | 970,535 |
| Events in quadrant C | 3,252,045 | 914,916 |
| Events in quadrant D | 4,469,444 | 881,825 |
| Mode SS | |||
|---|---|---|---|
| Quadrant | BADHDUFLAG | Total packets | Discarded packets |
| A | 0 | 134 | 0 |
| B | 0 | 134 | 0 |
| C | 0 | 134 | 0 |
| D | 0 | 134 | 0 |
| Mode M9 | |||
|---|---|---|---|
| Quadrant | BADHDUFLAG | Total packets | Discarded packets |
| A | 0 | 23 | 0 |
| B | 0 | 23 | 0 |
| C | 0 | 23 | 0 |
| D | 0 | 23 | 0 |
| Mode M0 | |||
|---|---|---|---|
| Quadrant | BADHDUFLAG | Total packets | Discarded packets |
| A | 0 | 13618 | 2 |
| B | 0 | 13957 | 2 |
| C | 0 | 13659 | 2 |
| D | 0 | 17488 | 2 |
| Quadrant | Total seconds | Saturated seconds | Saturation percentage |
|---|---|---|---|
| A | 6429 | 36 | 0.559963% |
| B | 6429 | 71 | 1.104371% |
| C | 6429 | 69 | 1.073262% |
| D | 6429 | 251 | 3.904184% |
Noise dominated data is calculated using 1-second bins in cleaned event files. If a bin has >2000 counts, and if more than 50% of those come from <1% of pixels, then it is considered to be noise-dominated and hence unusable.
| Quadrant | # 1 sec bins | Bins with >0 counts | Bins with >2000 counts | High rate bins dominated by noise | Noise dominated (total time) | Noise dominated (detector-on time) | Marked lightcurve |
|---|---|---|---|---|---|---|---|
| A | 8769 | 6431 | 0 | 0 | 0.00% | 0.00% | 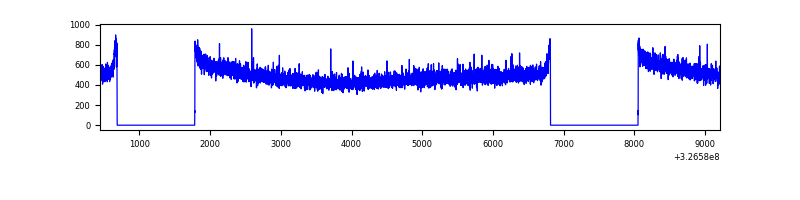 |
| B | 8769 | 6431 | 0 | 0 | 0.00% | 0.00% | 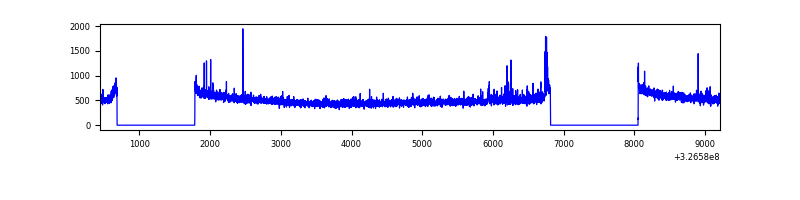 |
| C | 8769 | 6431 | 1 | 1 | 0.01% | 0.02% | 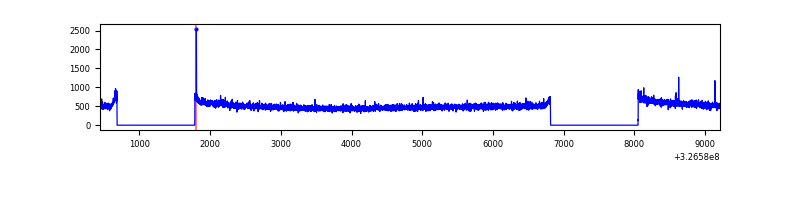 |
| D | 8769 | 6431 | 197 | 197 | 2.25% | 3.06% | 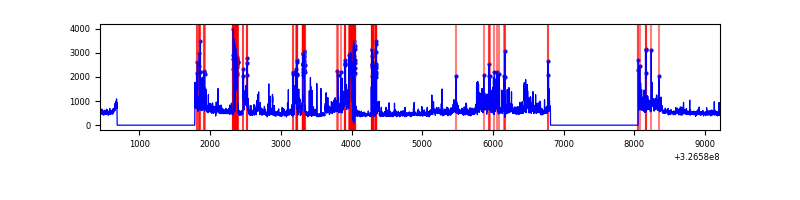 |
Top three noisy pixels from each quadrant. If the there are fewer than three noisy pixels in the level2.evt file, extra rows are filled as -1
| Pixel properties | Quadrant properties | ||||||
|---|---|---|---|---|---|---|---|
| Quadrant | DetID | PixID | Counts | Sigma | Mean | Median | Sigma |
| A | 13 | 254 | 10692 | 60.01 | 830 | 815 | 164.6 |
| A | 3 | 137 | 7355 | 39.73 | 830 | 815 | 164.6 |
| A | 0 | 226 | 7143 | 38.45 | 830 | 815 | 164.6 |
| B | 15 | 33 | 28914 | 185.33 | 828 | 809 | 151.6 |
| B | 12 | 111 | 18135 | 114.25 | 828 | 809 | 151.6 |
| B | 11 | 111 | 16533 | 103.69 | 828 | 809 | 151.6 |
| C | 14 | 238 | 131210 | 718.5 | 794 | 799 | 181.5 |
| C | 2 | 16 | 11752 | 60.35 | 794 | 799 | 181.5 |
| C | 0 | 10 | 8402 | 41.89 | 794 | 799 | 181.5 |
| D | 1 | 52 | 1283698 | 6807.29 | 792 | 771 | 188.5 |
| D | 8 | 195 | 88287 | 464.37 | 792 | 771 | 188.5 |
| D | 2 | 244 | 52606 | 275.04 | 792 | 771 | 188.5 |
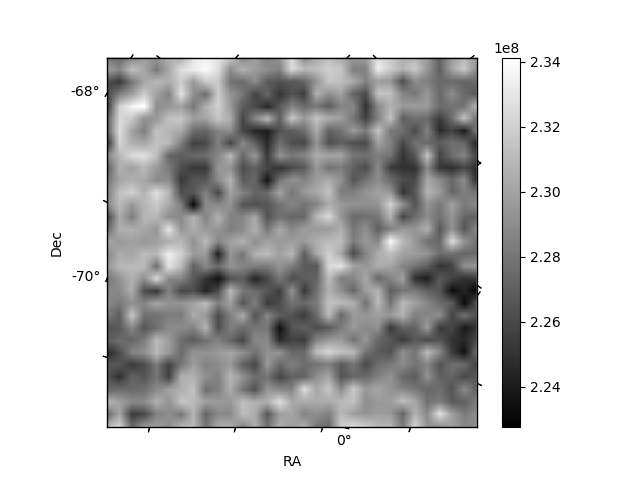
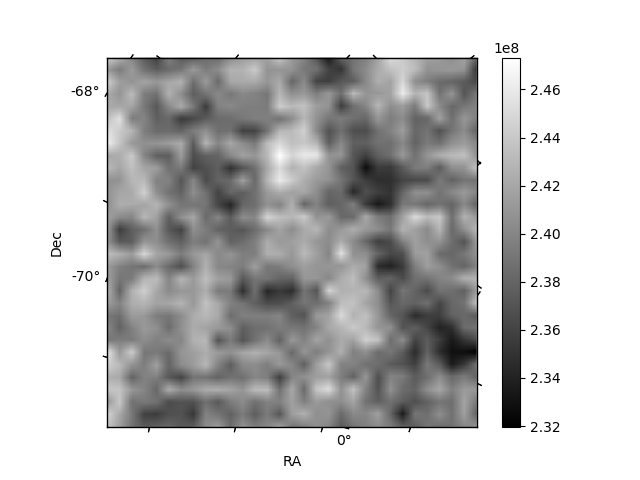
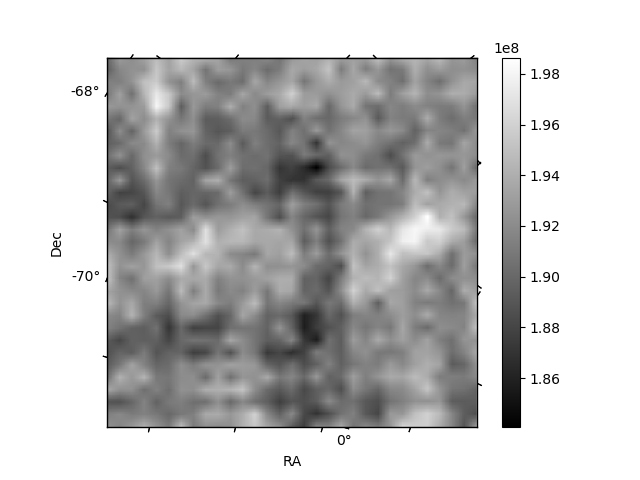
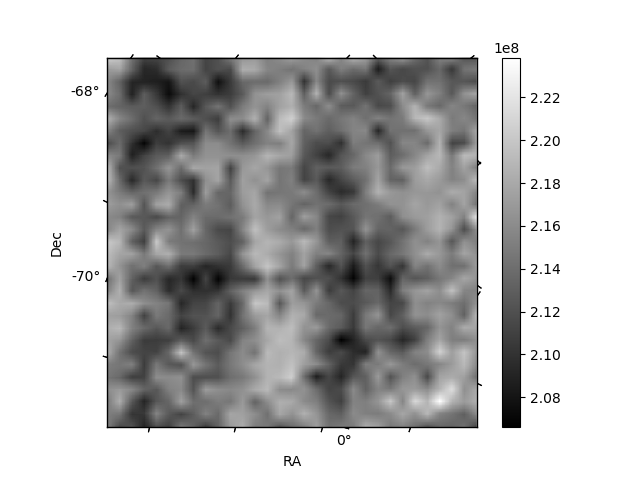
Histogram calculated using DETX and DETY for each event in the final _common_clean file
| Quadrant A | 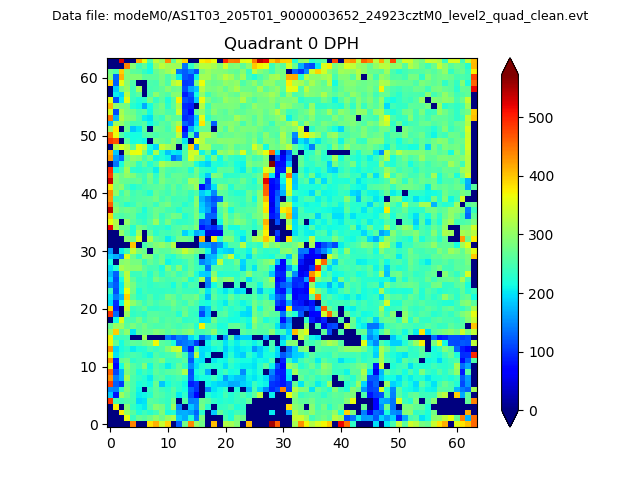 |
 |
Quadrant B |
|---|---|---|---|
| Quadrant D | 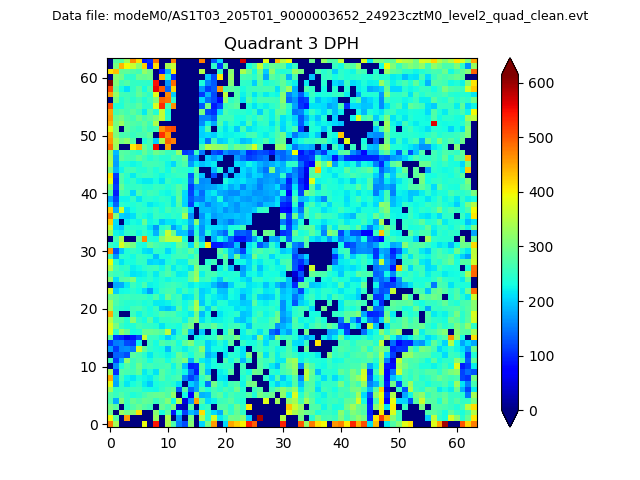 |
 |
Quadrant C |
| Plot type | Count rate plots | Images |
|---|---|---|
| Comparison with Poisson distribution Blue bars denote a histogram of data divided into 1 sec bins. Red curve is a Poisson curve with rate = median count rate of data. |
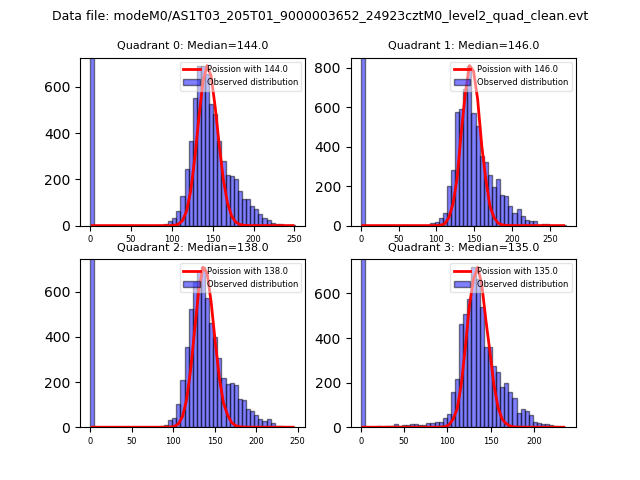 |
 |
| Quadrant-wise count rates Data is divided into 100 sec bins |
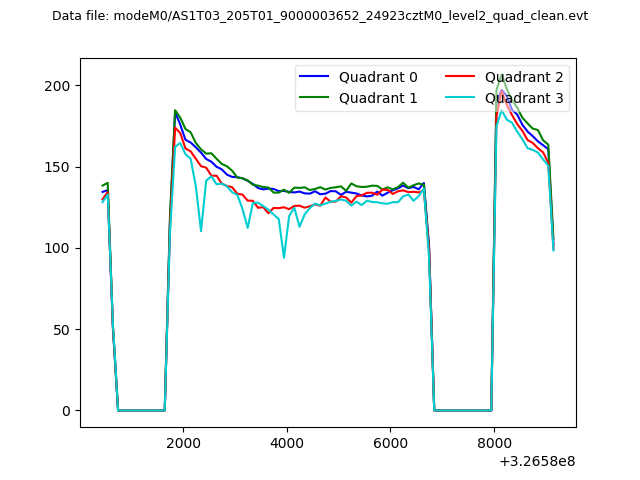 |
|
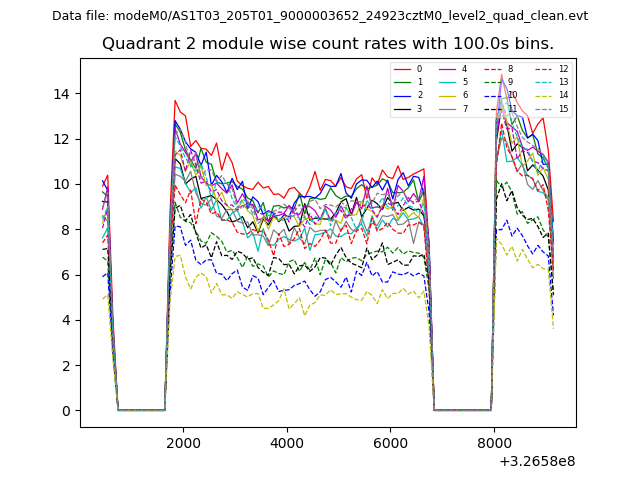
| Module-wise count rates for Quadrant A Data is divided into 100 sec bins |
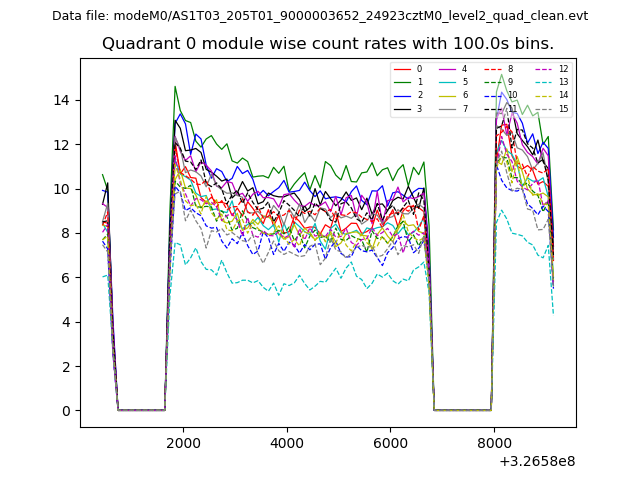 |
 |
| Module-wise count rates for Quadrant B Data is divided into 100 sec bins |
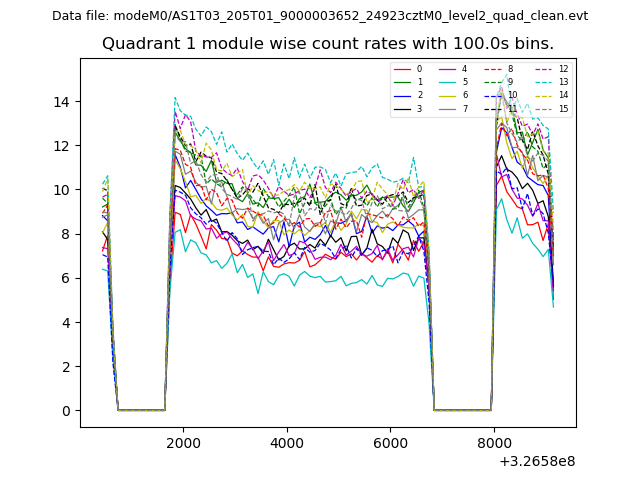 |
 |
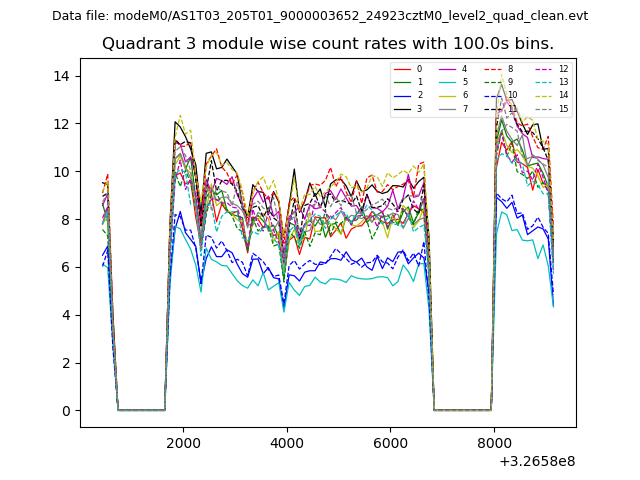
| Module-wise count rates for Quadrant C Data is divided into 100 sec bins |
 |
 |
| Module-wise count rates for Quadrant D Data is divided into 100 sec bins |
 |
 |
| Parameter | Plot |
|---|---|
| CZT HV Monitor |  |
| D_VDD | 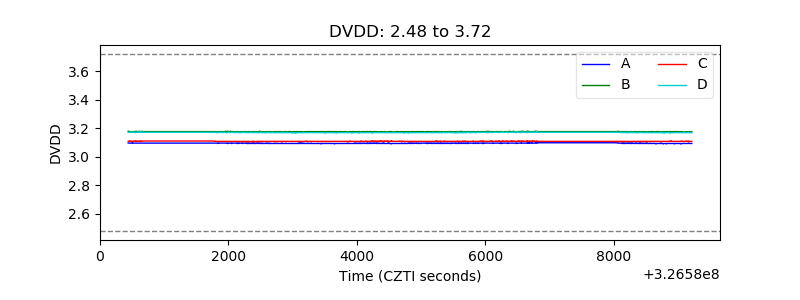 |
| Temperature 1 | 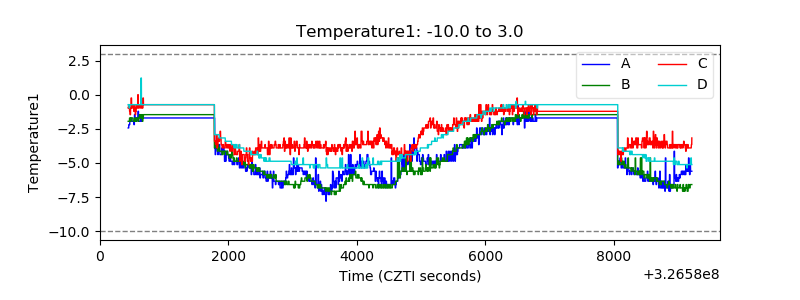 |
| Veto HV Monitor | 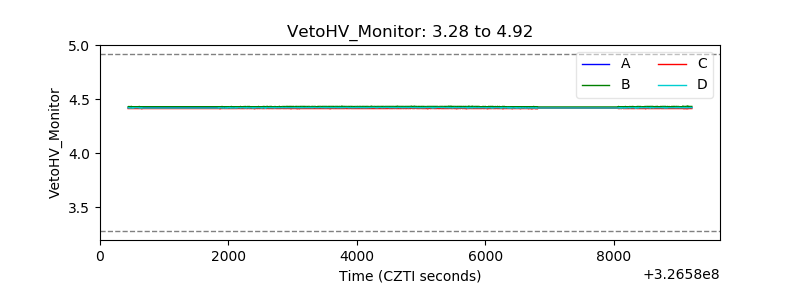 |
| Veto LLD | 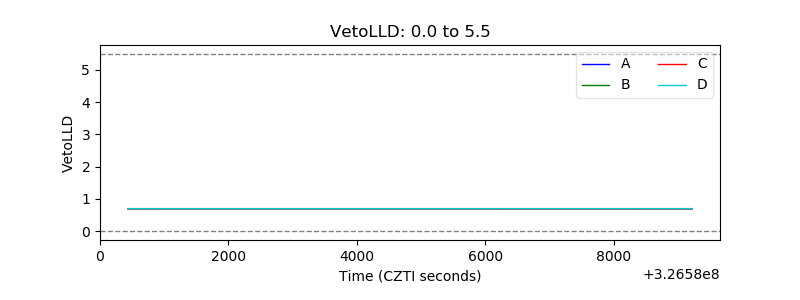 |
| Alpha Counter |  |
| _CPM_Rate | 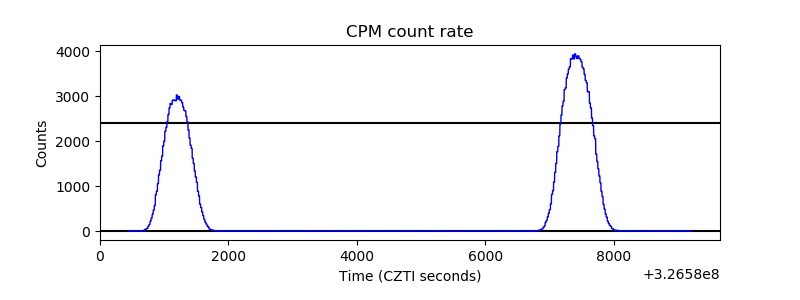 |
| CZT Counter | 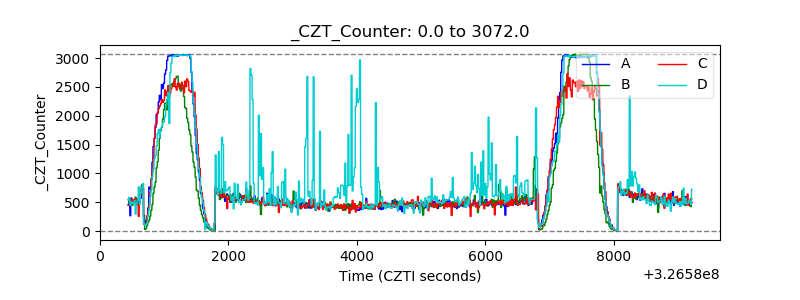 |
| +2.5 Volts monitor |  |
| +5 Volts monitor | 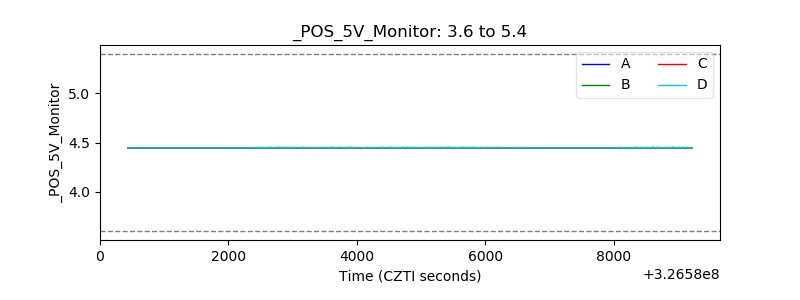 |
| _ROLL_ROT | 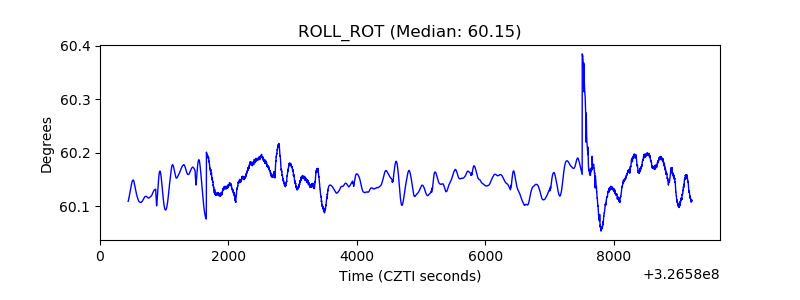 |
| _Roll_DEC | 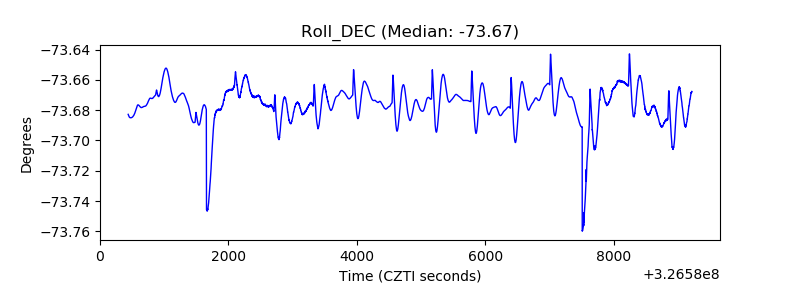 |
| _Roll_RA | 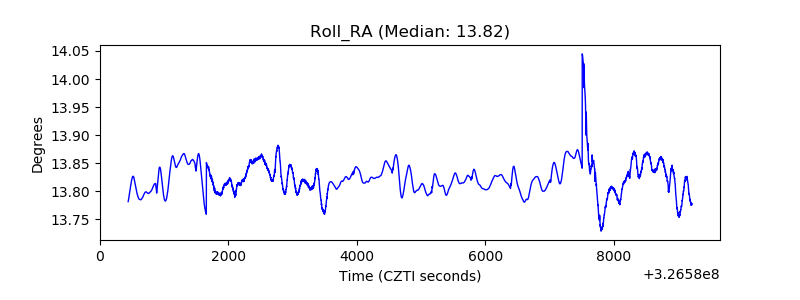 |
| Veto Counter | 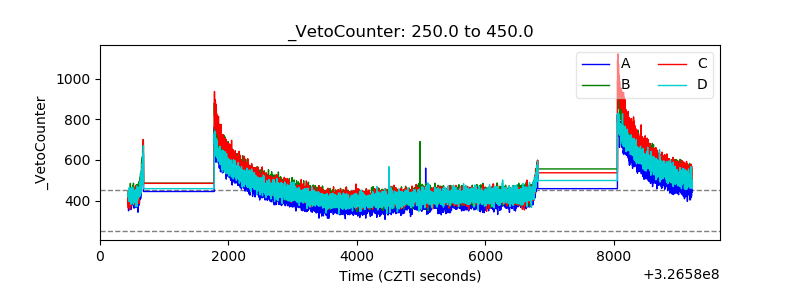 |