| Param | Original file | Final file |
|---|---|---|
| Filename | modeM0/AS1T03_205T01_9000003652_24925cztM0_level2.evt | modeM0/AS1T03_205T01_9000003652_24925cztM0_level2_quad_clean.evt |
| Size (bytes) | 498,600,000 | 144,224,640 |
| Size | 475.5 MB | 137.5 MB |
| Events in quadrant A | 3,220,328 | 996,945 |
| Events in quadrant B | 3,376,515 | 1,025,990 |
| Events in quadrant C | 3,968,736 | 973,864 |
| Events in quadrant D | 4,117,727 | 942,703 |
| Mode SS | |||
|---|---|---|---|
| Quadrant | BADHDUFLAG | Total packets | Discarded packets |
| A | 0 | 124 | 0 |
| B | 0 | 124 | 0 |
| C | 0 | 124 | 0 |
| D | 0 | 124 | 0 |
| Mode M9 | |||
|---|---|---|---|
| Quadrant | BADHDUFLAG | Total packets | Discarded packets |
| A | 0 | 18 | 0 |
| B | 0 | 19 | 0 |
| C | 0 | 19 | 0 |
| D | 0 | 19 | 0 |
| Mode M0 | |||
|---|---|---|---|
| Quadrant | BADHDUFLAG | Total packets | Discarded packets |
| A | 0 | 13236 | 2 |
| B | 0 | 13832 | 2 |
| C | 0 | 15662 | 2 |
| D | 0 | 16306 | 2 |
| Quadrant | Total seconds | Saturated seconds | Saturation percentage |
|---|---|---|---|
| A | 6149 | 13 | 0.211416% |
| B | 6149 | 44 | 0.715564% |
| C | 6149 | 157 | 2.553261% |
| D | 6149 | 173 | 2.813466% |
Noise dominated data is calculated using 1-second bins in cleaned event files. If a bin has >2000 counts, and if more than 50% of those come from <1% of pixels, then it is considered to be noise-dominated and hence unusable.
| Quadrant | # 1 sec bins | Bins with >0 counts | Bins with >2000 counts | High rate bins dominated by noise | Noise dominated (total time) | Noise dominated (detector-on time) | Marked lightcurve |
|---|---|---|---|---|---|---|---|
| A | 7529 | 6150 | 0 | 0 | 0.00% | 0.00% | 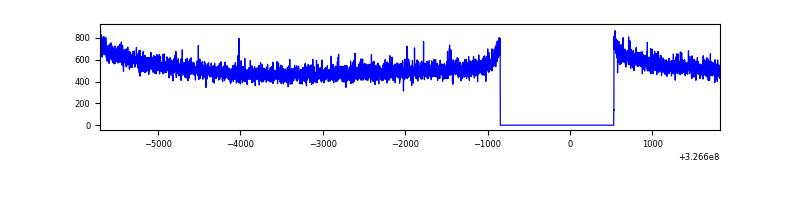 |
| B | 7529 | 6150 | 7 | 7 | 0.09% | 0.11% | 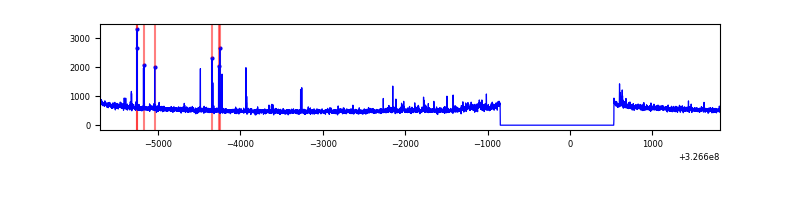 |
| C | 7529 | 6150 | 12 | 12 | 0.16% | 0.20% | 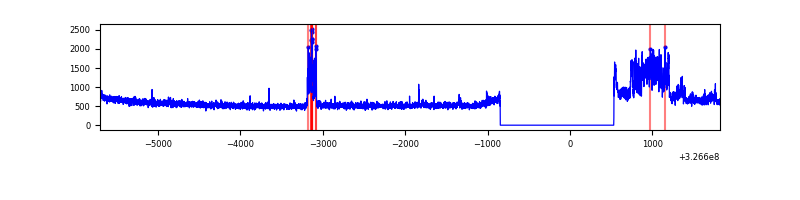 |
| D | 7529 | 6150 | 85 | 85 | 1.13% | 1.38% | 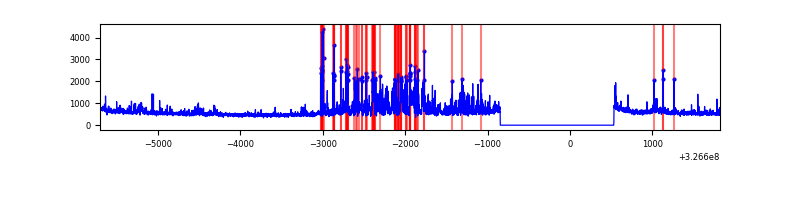 |
Top three noisy pixels from each quadrant. If the there are fewer than three noisy pixels in the level2.evt file, extra rows are filled as -1
| Pixel properties | Quadrant properties | ||||||
|---|---|---|---|---|---|---|---|
| Quadrant | DetID | PixID | Counts | Sigma | Mean | Median | Sigma |
| A | 13 | 254 | 9256 | 51.72 | 834 | 822 | 163.1 |
| A | 0 | 226 | 7188 | 39.04 | 834 | 822 | 163.1 |
| A | 3 | 137 | 6643 | 35.69 | 834 | 822 | 163.1 |
| B | 4 | 216 | 25699 | 166.04 | 837 | 820 | 149.8 |
| B | 4 | 80 | 23421 | 150.84 | 837 | 820 | 149.8 |
| B | 10 | 251 | 22591 | 145.3 | 837 | 820 | 149.8 |
| C | 7 | 247 | 637828 | 3414.32 | 818 | 824 | 186.6 |
| C | 14 | 238 | 134516 | 716.58 | 818 | 824 | 186.6 |
| C | 13 | 61 | 5692 | 26.09 | 818 | 824 | 186.6 |
| D | 1 | 52 | 889333 | 4575.15 | 816 | 795 | 194.2 |
| D | 8 | 195 | 75283 | 383.54 | 816 | 795 | 194.2 |
| D | 1 | 239 | 48977 | 248.09 | 816 | 795 | 194.2 |
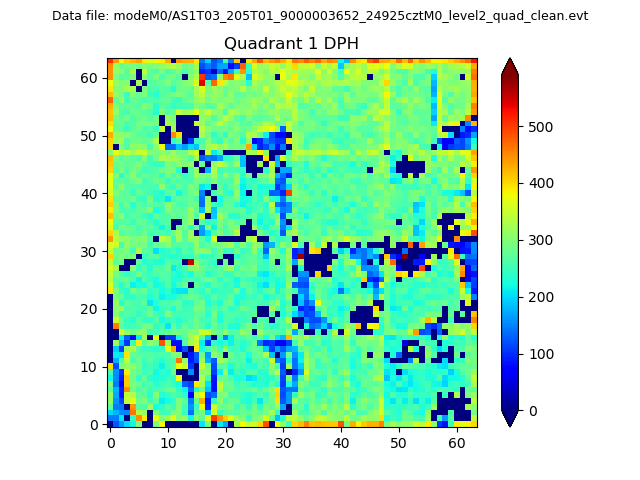
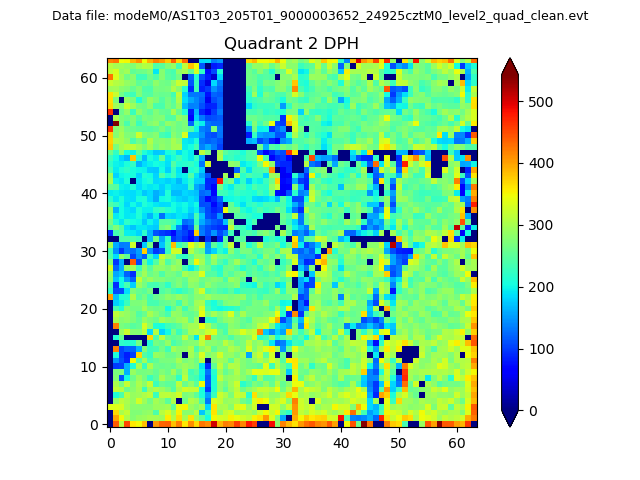
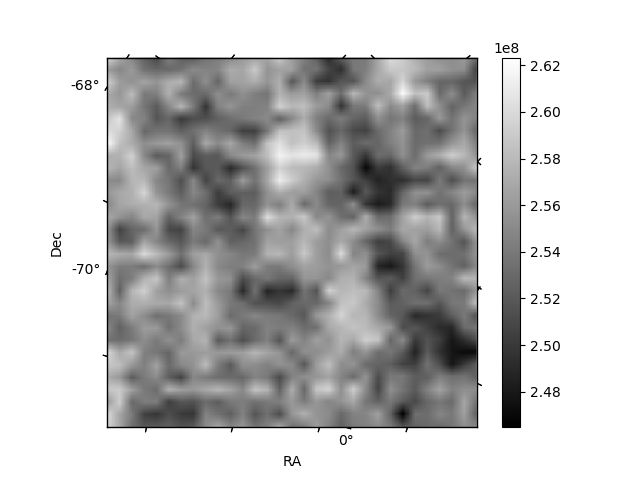
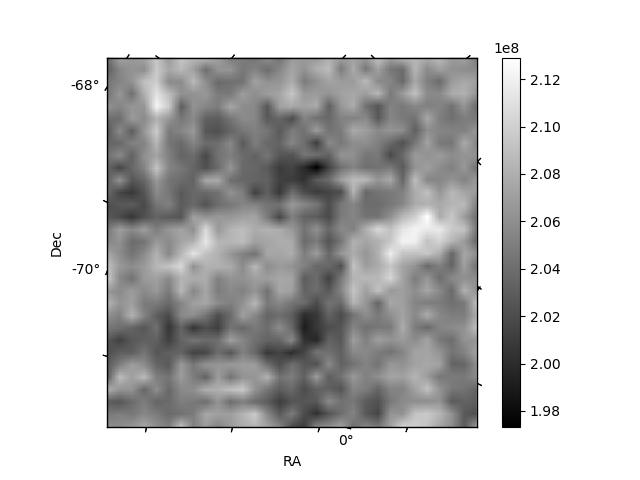
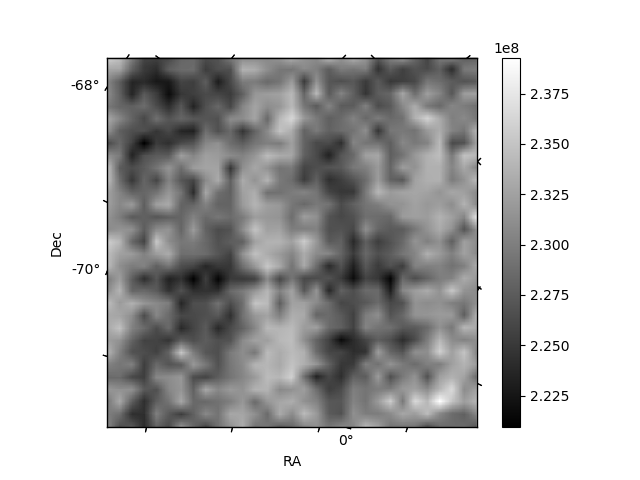
Histogram calculated using DETX and DETY for each event in the final _common_clean file
| Quadrant A |  |
 |
Quadrant B |
|---|---|---|---|
| Quadrant D | 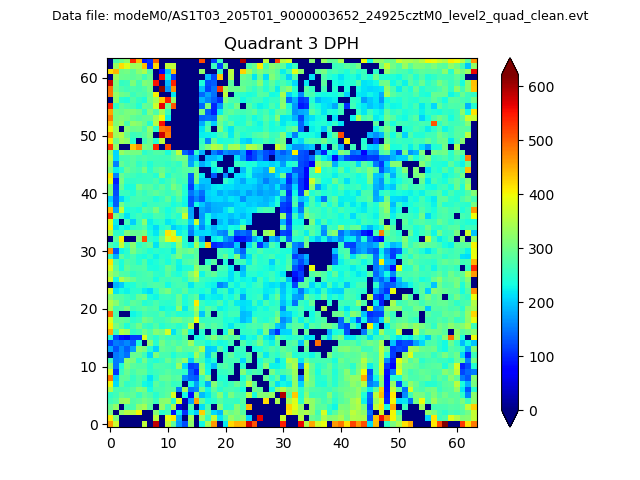 |
 |
Quadrant C |
| Plot type | Count rate plots | Images |
|---|---|---|
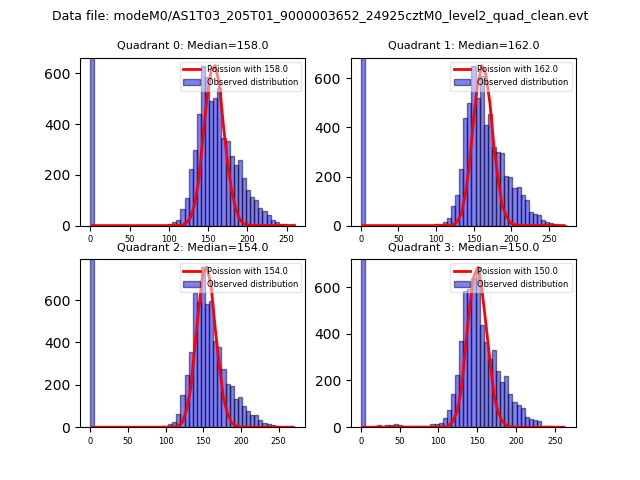
| Comparison with Poisson distribution Blue bars denote a histogram of data divided into 1 sec bins. Red curve is a Poisson curve with rate = median count rate of data. |
 |
 |
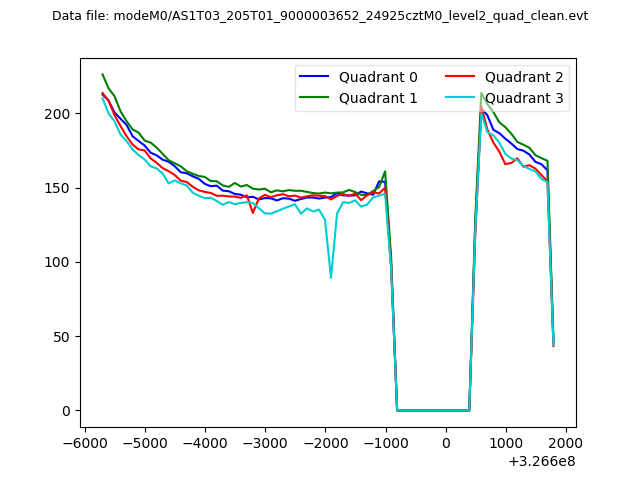
| Quadrant-wise count rates Data is divided into 100 sec bins |
 |
|
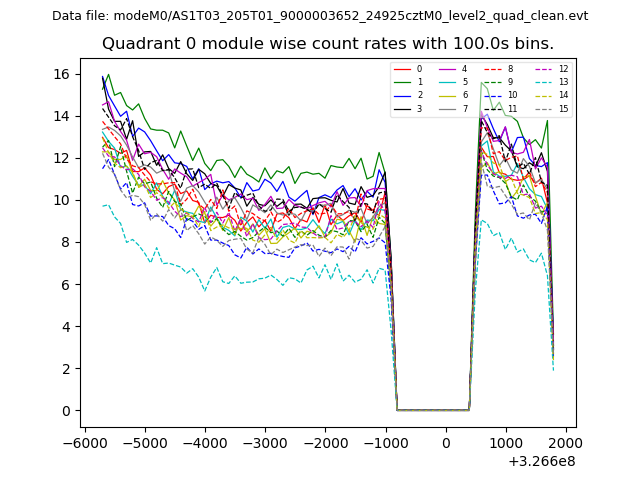
| Module-wise count rates for Quadrant A Data is divided into 100 sec bins |
 |
 |
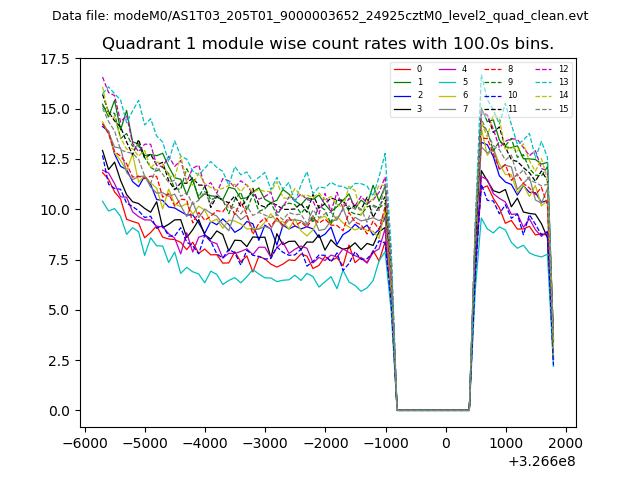
| Module-wise count rates for Quadrant B Data is divided into 100 sec bins |
 |
 |
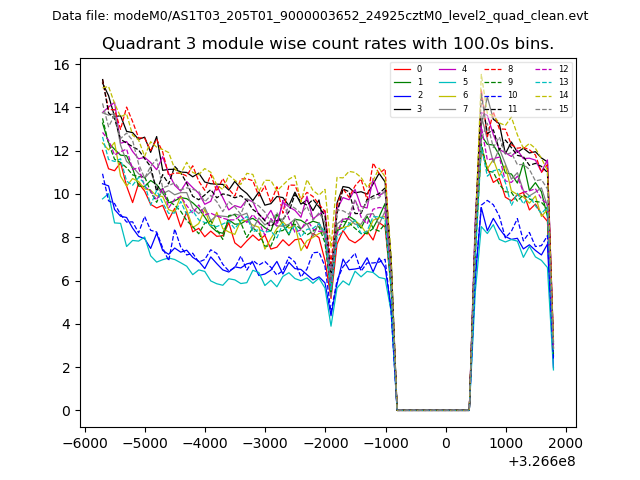
| Module-wise count rates for Quadrant C Data is divided into 100 sec bins |
 |
 |
| Module-wise count rates for Quadrant D Data is divided into 100 sec bins |
 |
 |
| Parameter | Plot |
|---|---|
| CZT HV Monitor |  |
| D_VDD | 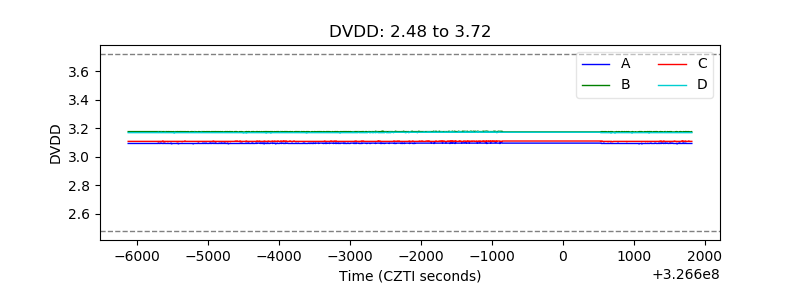 |
| Temperature 1 | 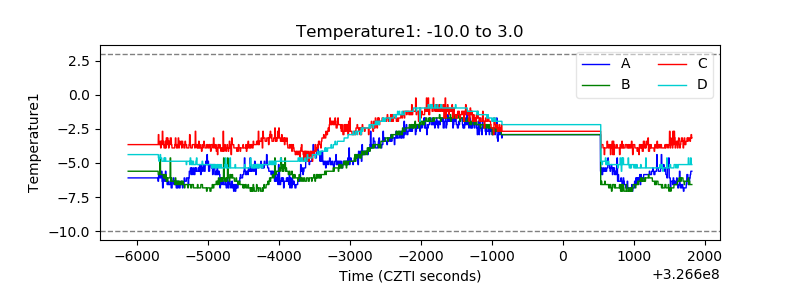 |
| Veto HV Monitor | 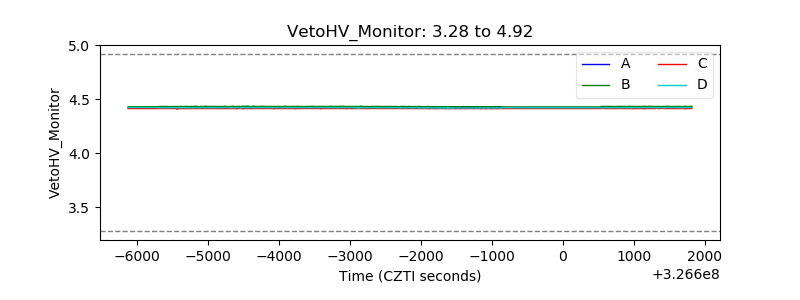 |
| Veto LLD | 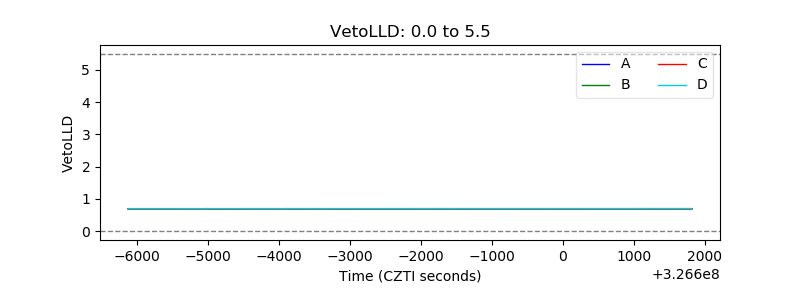 |
| Alpha Counter | 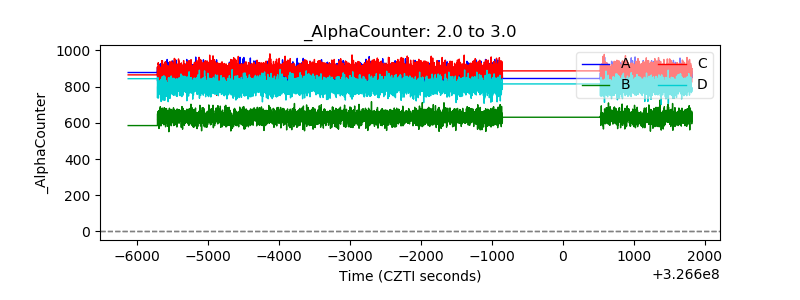 |
| _CPM_Rate | 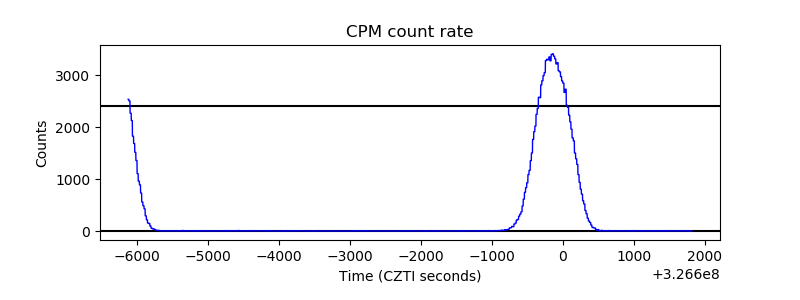 |
| CZT Counter | 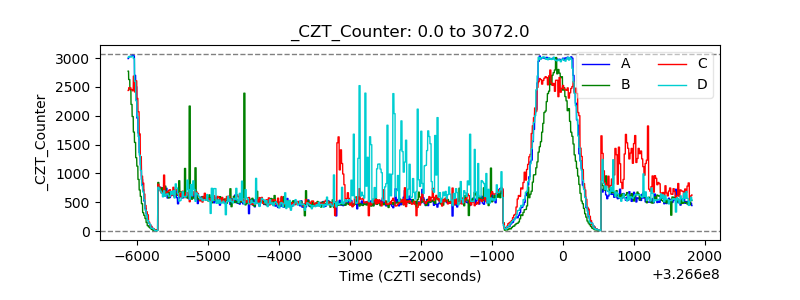 |
| +2.5 Volts monitor |  |
| +5 Volts monitor |  |
| _ROLL_ROT | 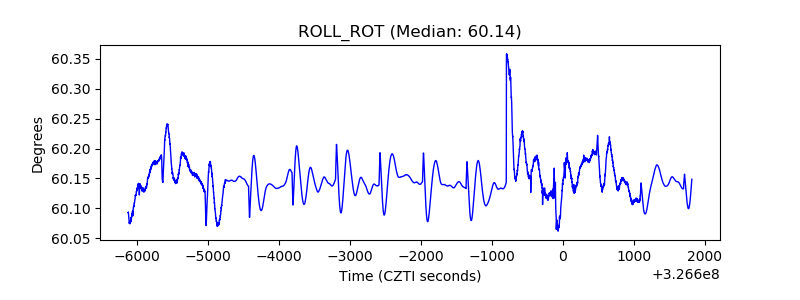 |
| _Roll_DEC | 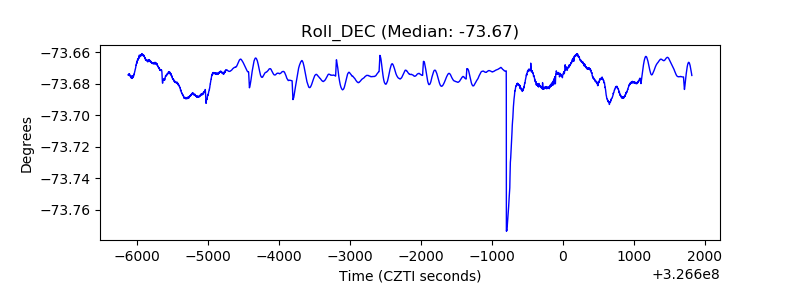 |
| _Roll_RA | 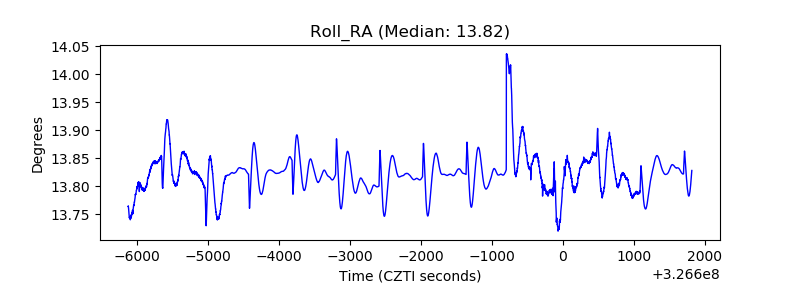 |
| Veto Counter | 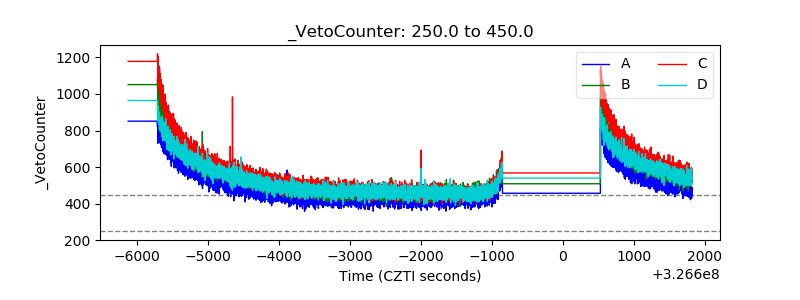 |