| Param | Original file | Final file |
|---|---|---|
| Filename | modeM0/AS1T03_205T01_9000003652_24926cztM0_level2.evt | modeM0/AS1T03_205T01_9000003652_24926cztM0_level2_quad_clean.evt |
| Size (bytes) | 502,352,640 | 141,503,040 |
| Size | 479.1 MB | 134.9 MB |
| Events in quadrant A | 3,161,969 | 974,514 |
| Events in quadrant B | 3,343,353 | 998,354 |
| Events in quadrant C | 4,639,127 | 946,888 |
| Events in quadrant D | 3,652,687 | 937,235 |
| Mode SS | |||
|---|---|---|---|
| Quadrant | BADHDUFLAG | Total packets | Discarded packets |
| A | 0 | 126 | 0 |
| B | 0 | 126 | 0 |
| C | 0 | 126 | 0 |
| D | 0 | 126 | 0 |
| Mode M9 | |||
|---|---|---|---|
| Quadrant | BADHDUFLAG | Total packets | Discarded packets |
| A | 0 | 22 | 0 |
| B | 0 | 23 | 0 |
| C | 0 | 23 | 0 |
| D | 0 | 23 | 0 |
| Mode M0 | |||
|---|---|---|---|
| Quadrant | BADHDUFLAG | Total packets | Discarded packets |
| A | 0 | 12995 | 2 |
| B | 0 | 13577 | 2 |
| C | 0 | 17658 | 2 |
| D | 0 | 14695 | 2 |
| Quadrant | Total seconds | Saturated seconds | Saturation percentage |
|---|---|---|---|
| A | 6143 | 20 | 0.325574% |
| B | 6143 | 44 | 0.716262% |
| C | 6143 | 273 | 4.444083% |
| D | 6142 | 27 | 0.439596% |
Noise dominated data is calculated using 1-second bins in cleaned event files. If a bin has >2000 counts, and if more than 50% of those come from <1% of pixels, then it is considered to be noise-dominated and hence unusable.
| Quadrant | # 1 sec bins | Bins with >0 counts | Bins with >2000 counts | High rate bins dominated by noise | Noise dominated (total time) | Noise dominated (detector-on time) | Marked lightcurve |
|---|---|---|---|---|---|---|---|
| A | 7508 | 6144 | 0 | 0 | 0.00% | 0.00% | 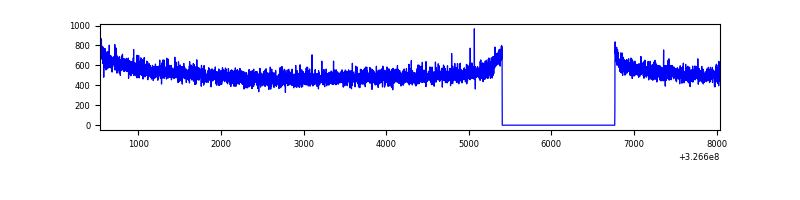 |
| B | 7508 | 6144 | 1 | 1 | 0.01% | 0.02% | 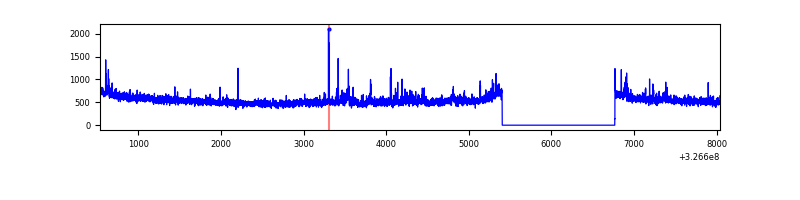 |
| C | 7508 | 6144 | 7 | 7 | 0.09% | 0.11% | 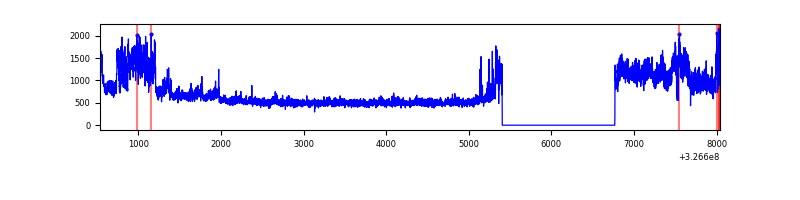 |
| D | 7507 | 6143 | 13 | 13 | 0.17% | 0.21% | 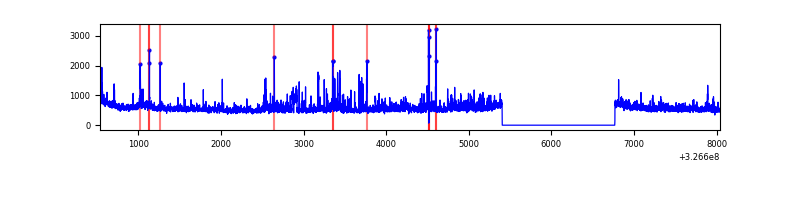 |
Top three noisy pixels from each quadrant. If the there are fewer than three noisy pixels in the level2.evt file, extra rows are filled as -1
| Pixel properties | Quadrant properties | ||||||
|---|---|---|---|---|---|---|---|
| Quadrant | DetID | PixID | Counts | Sigma | Mean | Median | Sigma |
| A | 13 | 254 | 9700 | 55.18 | 819 | 807 | 161.2 |
| A | 0 | 226 | 6965 | 38.21 | 819 | 807 | 161.2 |
| A | 3 | 137 | 6769 | 36.99 | 819 | 807 | 161.2 |
| B | 0 | 230 | 61322 | 405.16 | 819 | 801 | 149.4 |
| B | 15 | 33 | 19621 | 125.99 | 819 | 801 | 149.4 |
| B | 0 | 190 | 17272 | 110.27 | 819 | 801 | 149.4 |
| C | 7 | 247 | 1377982 | 7557.37 | 800 | 806 | 182.2 |
| C | 14 | 238 | 131045 | 714.7 | 800 | 806 | 182.2 |
| C | 13 | 61 | 5487 | 25.69 | 800 | 806 | 182.2 |
| D | 1 | 52 | 315541 | 1631.29 | 813 | 792 | 192.9 |
| D | 8 | 195 | 176064 | 908.4 | 813 | 792 | 192.9 |
| D | 1 | 239 | 47216 | 240.61 | 813 | 792 | 192.9 |
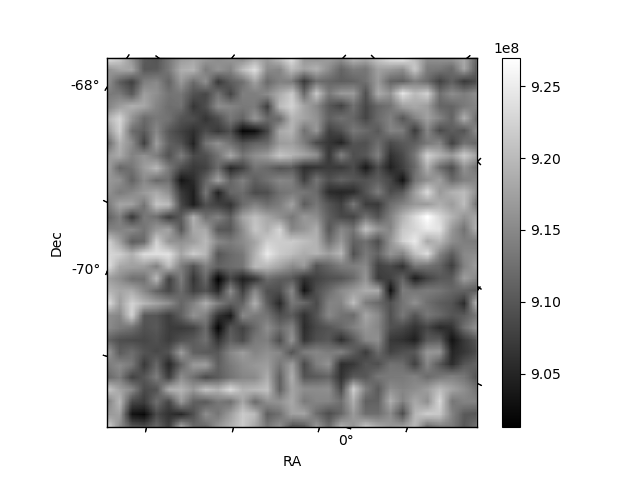
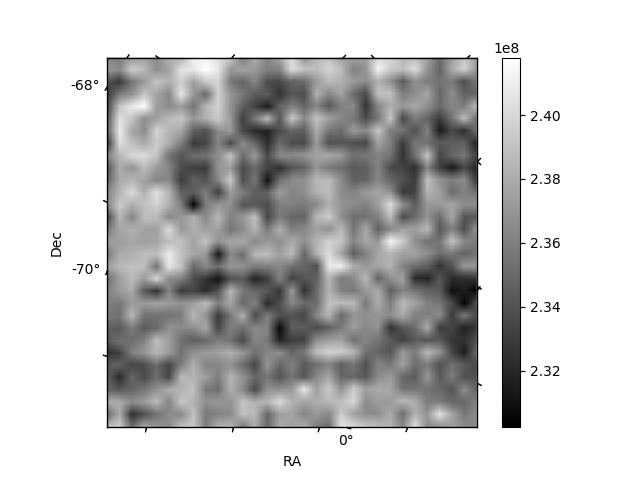
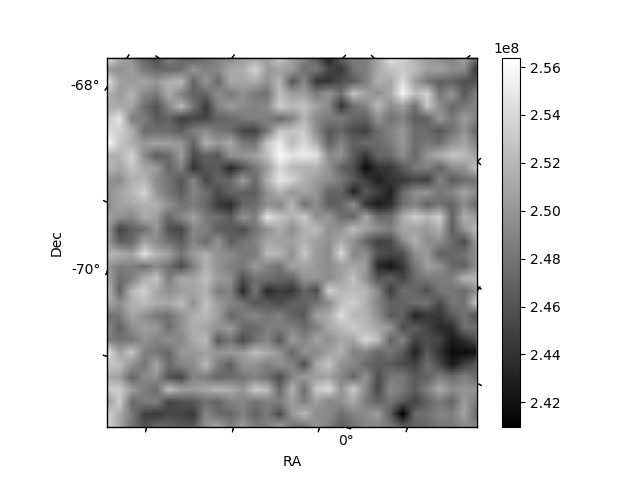
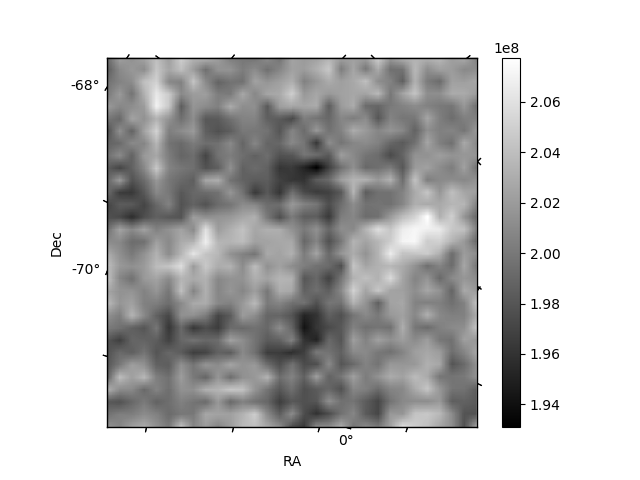
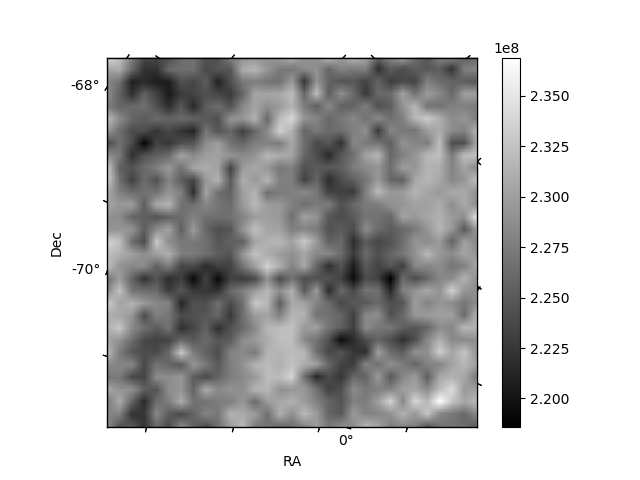
Histogram calculated using DETX and DETY for each event in the final _common_clean file
| Quadrant A | 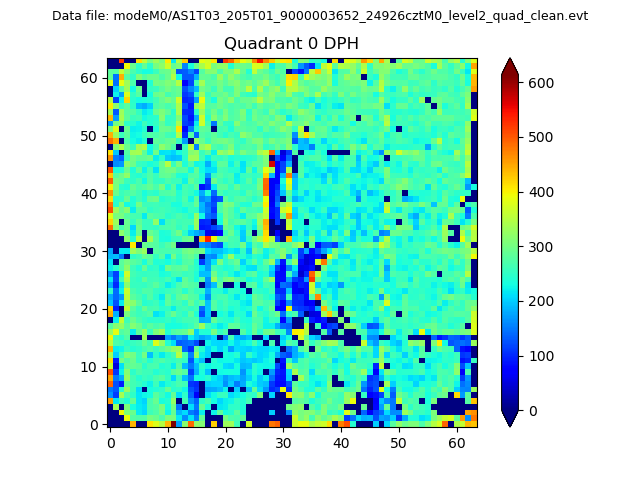 |
 |
Quadrant B |
|---|---|---|---|
| Quadrant D | 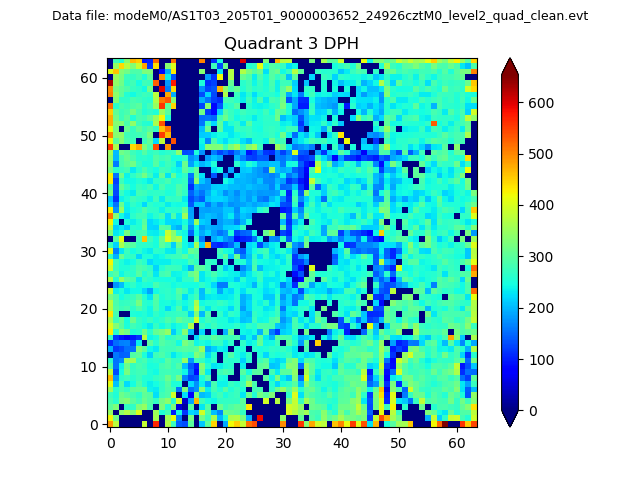 |
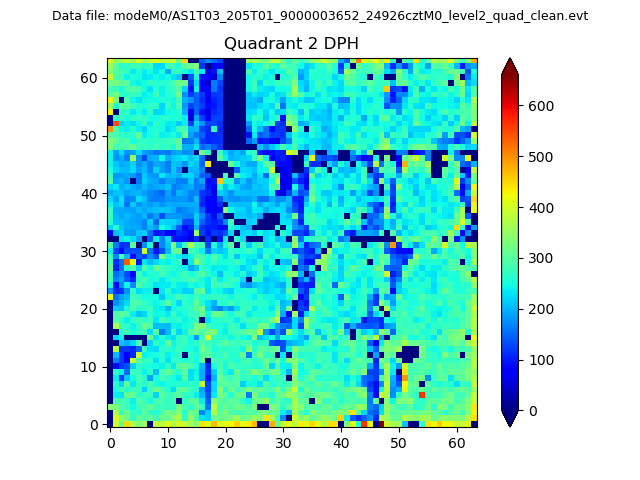 |
Quadrant C |
| Plot type | Count rate plots | Images |
|---|---|---|
| Comparison with Poisson distribution Blue bars denote a histogram of data divided into 1 sec bins. Red curve is a Poisson curve with rate = median count rate of data. |
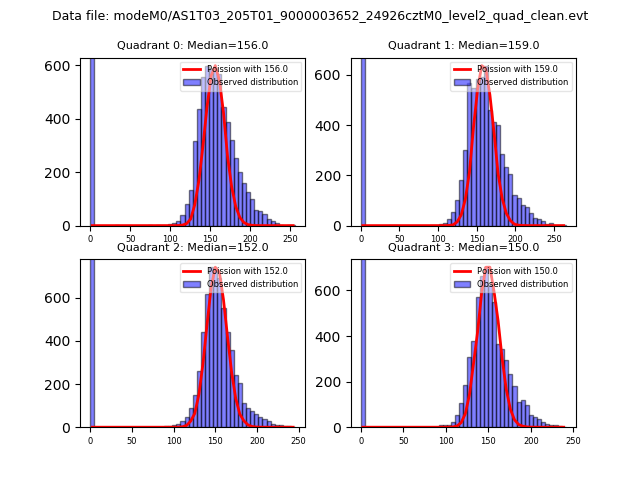 |
 |
| Quadrant-wise count rates Data is divided into 100 sec bins |
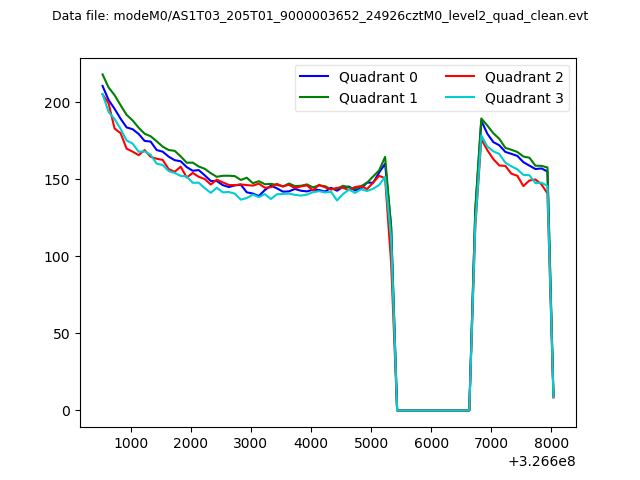 |
|
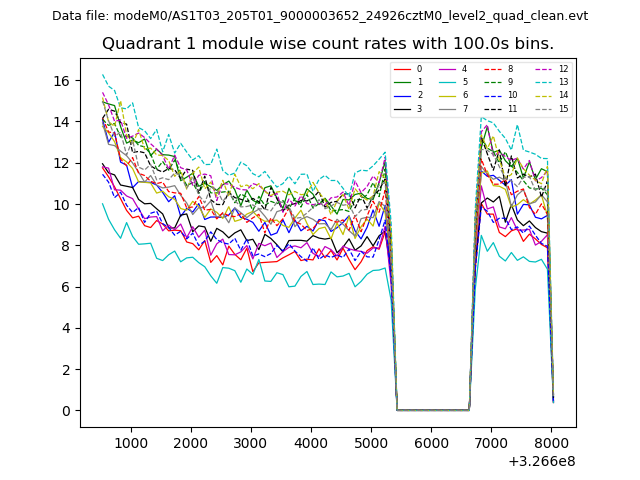
| Module-wise count rates for Quadrant A Data is divided into 100 sec bins |
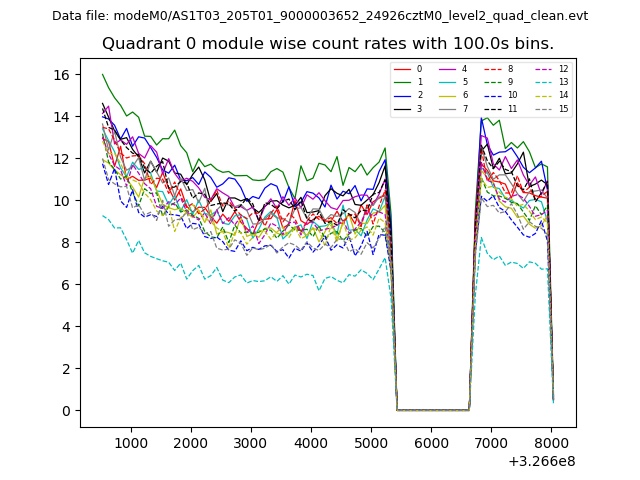 |
 |
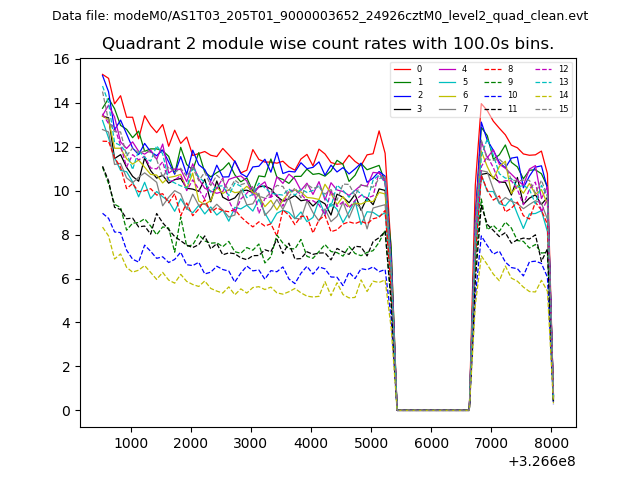
| Module-wise count rates for Quadrant B Data is divided into 100 sec bins |
 |
 |
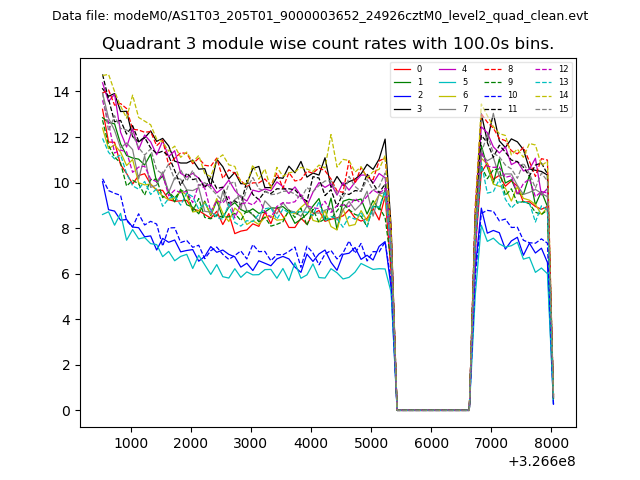
| Module-wise count rates for Quadrant C Data is divided into 100 sec bins |
 |
 |
| Module-wise count rates for Quadrant D Data is divided into 100 sec bins |
 |
 |
| Parameter | Plot |
|---|---|
| CZT HV Monitor | 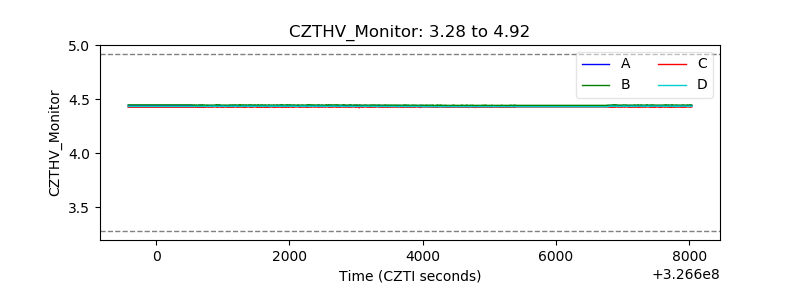 |
| D_VDD | 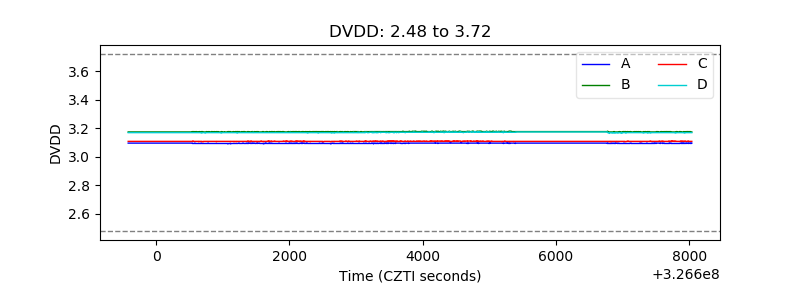 |
| Temperature 1 | 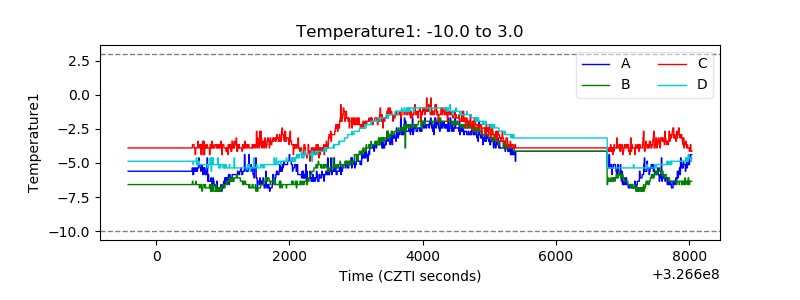 |
| Veto HV Monitor |  |
| Veto LLD | 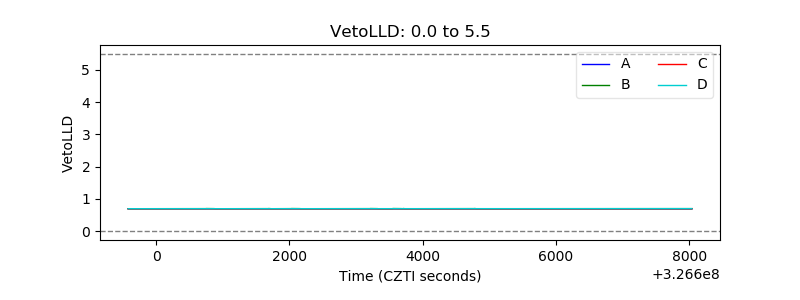 |
| Alpha Counter |  |
| _CPM_Rate | 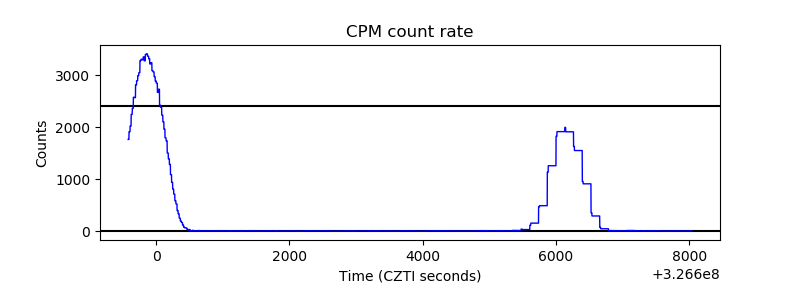 |
| CZT Counter | 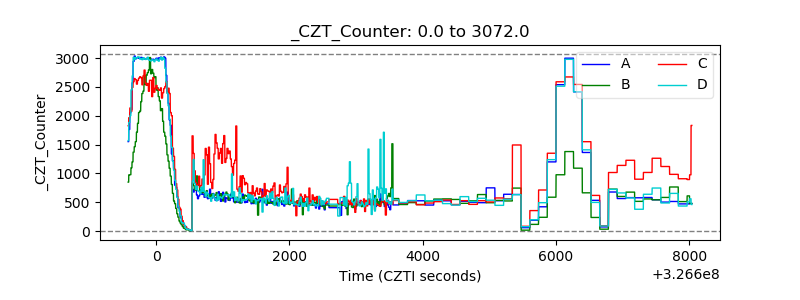 |
| +2.5 Volts monitor |  |
| +5 Volts monitor |  |
| _ROLL_ROT | 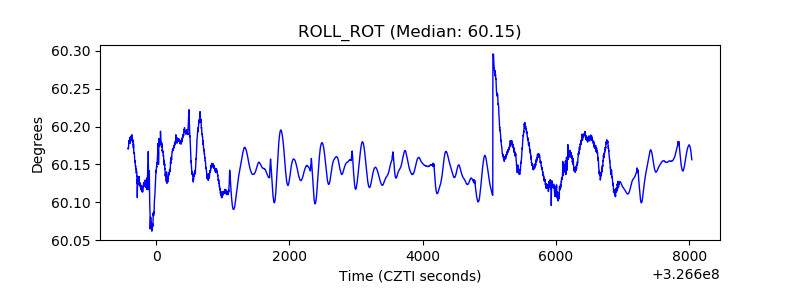 |
| _Roll_DEC | 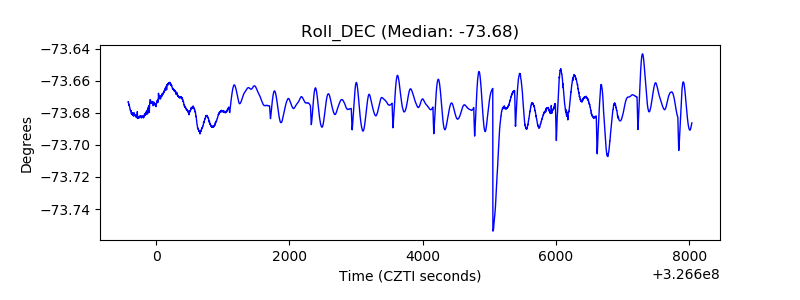 |
| _Roll_RA |  |
| Veto Counter | 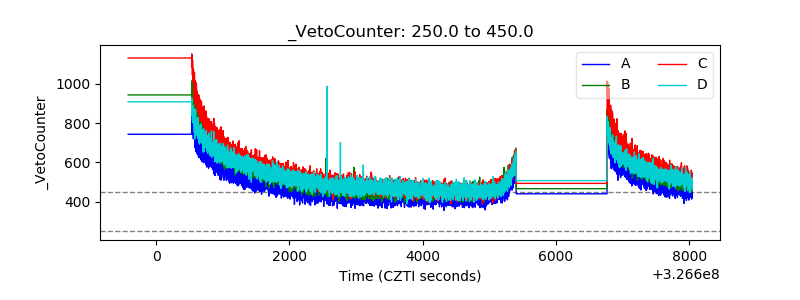 |