| Param | Original file | Final file |
|---|---|---|
| Filename | modeM0/AS1T03_205T01_9000003652_24927cztM0_level2.evt | modeM0/AS1T03_205T01_9000003652_24927cztM0_level2_quad_clean.evt |
| Size (bytes) | 515,439,360 | 143,559,360 |
| Size | 491.6 MB | 136.9 MB |
| Events in quadrant A | 3,304,447 | 986,092 |
| Events in quadrant B | 3,448,489 | 999,464 |
| Events in quadrant C | 4,588,692 | 955,448 |
| Events in quadrant D | 3,819,862 | 946,172 |
| Mode SS | |||
|---|---|---|---|
| Quadrant | BADHDUFLAG | Total packets | Discarded packets |
| A | 0 | 138 | 0 |
| B | 0 | 138 | 0 |
| C | 0 | 138 | 0 |
| D | 0 | 138 | 0 |
| Mode M9 | |||
|---|---|---|---|
| Quadrant | BADHDUFLAG | Total packets | Discarded packets |
| A | 0 | 25 | 0 |
| B | 0 | 25 | 0 |
| C | 0 | 25 | 0 |
| D | 0 | 25 | 0 |
| Mode M0 | |||
|---|---|---|---|
| Quadrant | BADHDUFLAG | Total packets | Discarded packets |
| A | 0 | 13772 | 2 |
| B | 0 | 14226 | 2 |
| C | 0 | 17759 | 2 |
| D | 0 | 15508 | 2 |
| Quadrant | Total seconds | Saturated seconds | Saturation percentage |
|---|---|---|---|
| A | 6609 | 42 | 0.635497% |
| B | 6610 | 83 | 1.255673% |
| C | 6610 | 278 | 4.205749% |
| D | 6610 | 89 | 1.346445% |
Noise dominated data is calculated using 1-second bins in cleaned event files. If a bin has >2000 counts, and if more than 50% of those come from <1% of pixels, then it is considered to be noise-dominated and hence unusable.
| Quadrant | # 1 sec bins | Bins with >0 counts | Bins with >2000 counts | High rate bins dominated by noise | Noise dominated (total time) | Noise dominated (detector-on time) | Marked lightcurve |
|---|---|---|---|---|---|---|---|
| A | 9159 | 6612 | 0 | 0 | 0.00% | 0.00% | 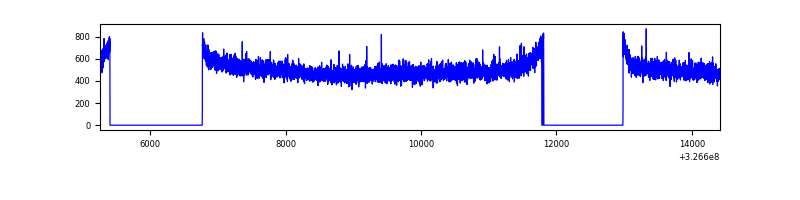 |
| B | 9160 | 6613 | 1 | 1 | 0.01% | 0.02% | 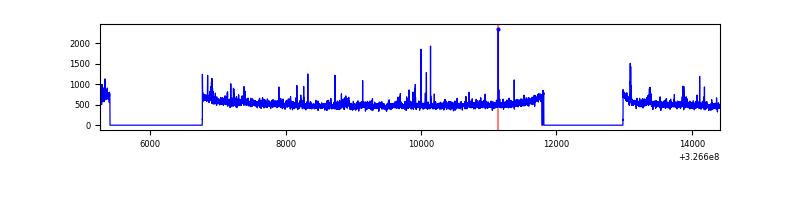 |
| C | 9160 | 6613 | 7 | 7 | 0.08% | 0.11% | 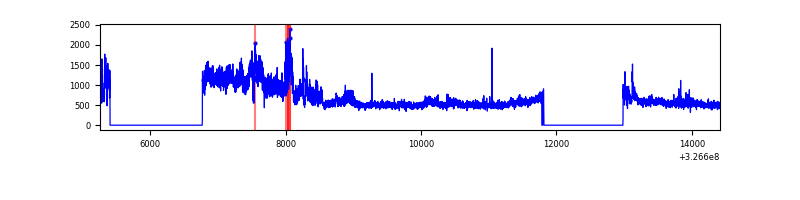 |
| D | 9160 | 6613 | 30 | 30 | 0.33% | 0.45% | 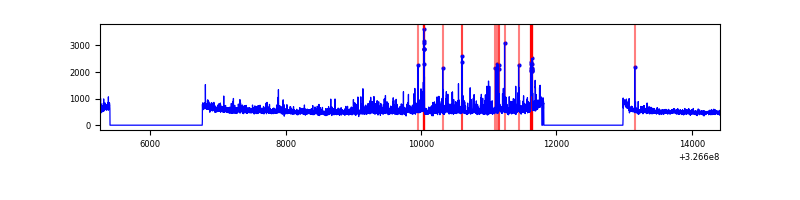 |
Top three noisy pixels from each quadrant. If the there are fewer than three noisy pixels in the level2.evt file, extra rows are filled as -1
| Pixel properties | Quadrant properties | ||||||
|---|---|---|---|---|---|---|---|
| Quadrant | DetID | PixID | Counts | Sigma | Mean | Median | Sigma |
| A | 13 | 254 | 10606 | 57.8 | 855 | 841 | 169.0 |
| A | 0 | 226 | 7376 | 38.68 | 855 | 841 | 169.0 |
| A | 3 | 137 | 7182 | 37.53 | 855 | 841 | 169.0 |
| B | 4 | 216 | 30395 | 188.77 | 849 | 829 | 156.6 |
| B | 0 | 230 | 20722 | 127.01 | 849 | 829 | 156.6 |
| B | 0 | 189 | 19724 | 120.64 | 849 | 829 | 156.6 |
| C | 7 | 247 | 1180012 | 6163.67 | 832 | 835 | 191.3 |
| C | 14 | 238 | 135990 | 706.47 | 832 | 835 | 191.3 |
| C | 2 | 16 | 23282 | 117.33 | 832 | 835 | 191.3 |
| D | 8 | 195 | 408527 | 2015.12 | 845 | 823 | 202.3 |
| D | 1 | 52 | 174328 | 857.57 | 845 | 823 | 202.3 |
| D | 2 | 153 | 34234 | 165.14 | 845 | 823 | 202.3 |
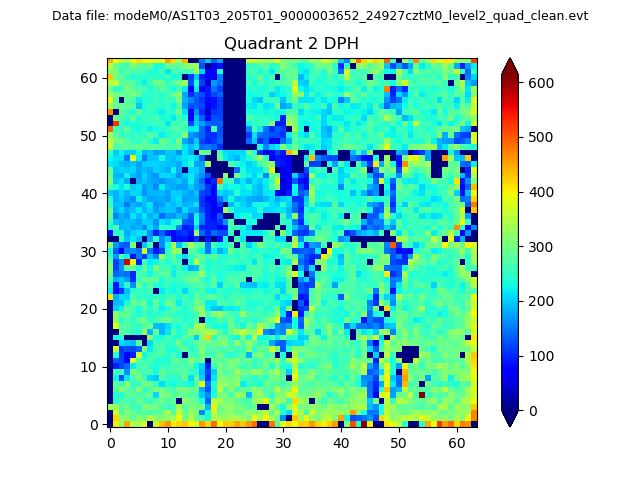
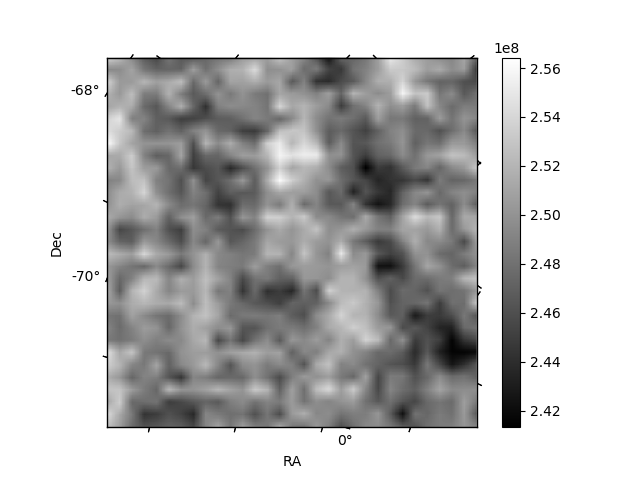
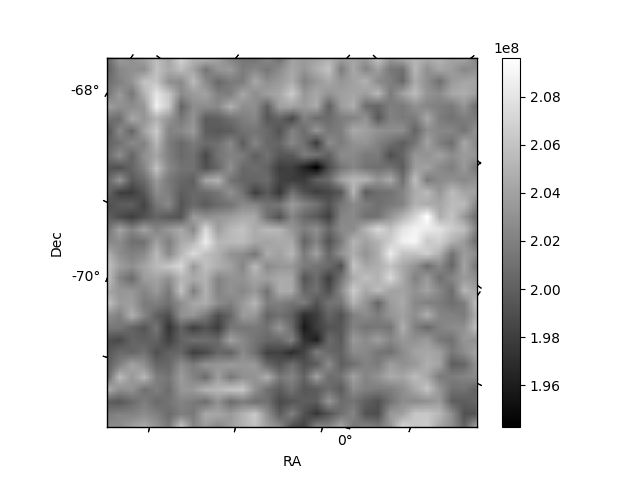
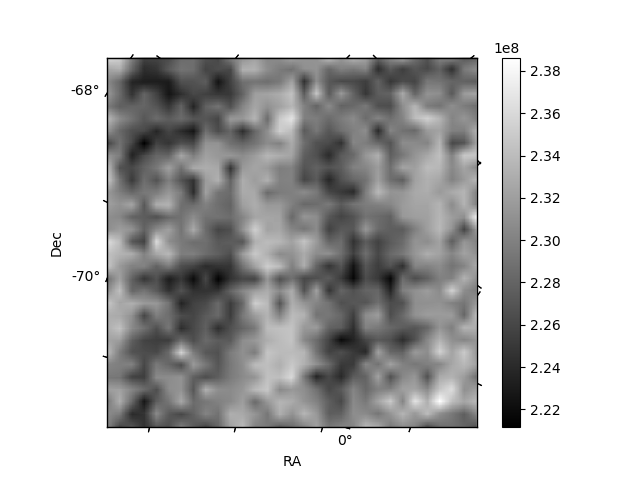
Histogram calculated using DETX and DETY for each event in the final _common_clean file
| Quadrant A | 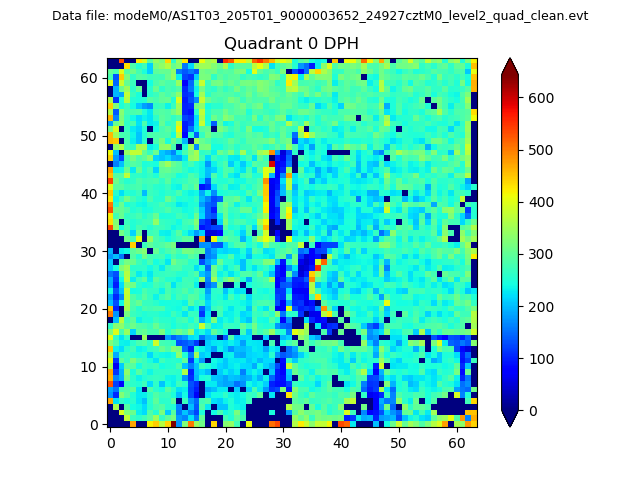 |
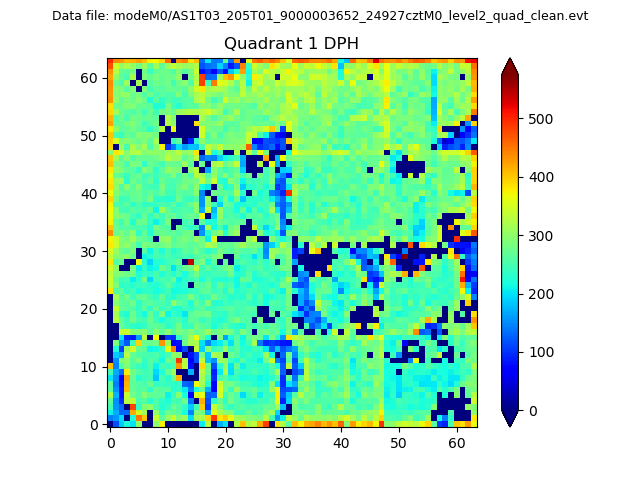 |
Quadrant B |
|---|---|---|---|
| Quadrant D | 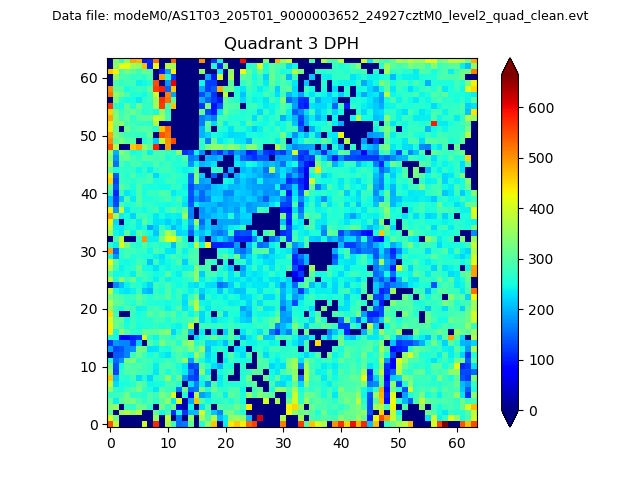 |
 |
Quadrant C |
| Plot type | Count rate plots | Images |
|---|---|---|
| Comparison with Poisson distribution Blue bars denote a histogram of data divided into 1 sec bins. Red curve is a Poisson curve with rate = median count rate of data. |
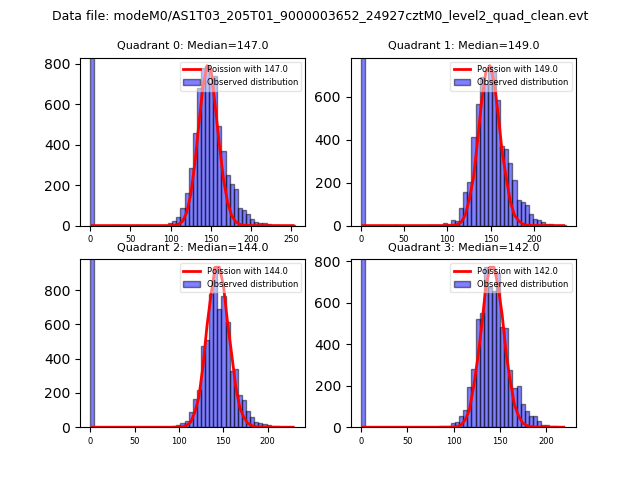 |
 |
| Quadrant-wise count rates Data is divided into 100 sec bins |
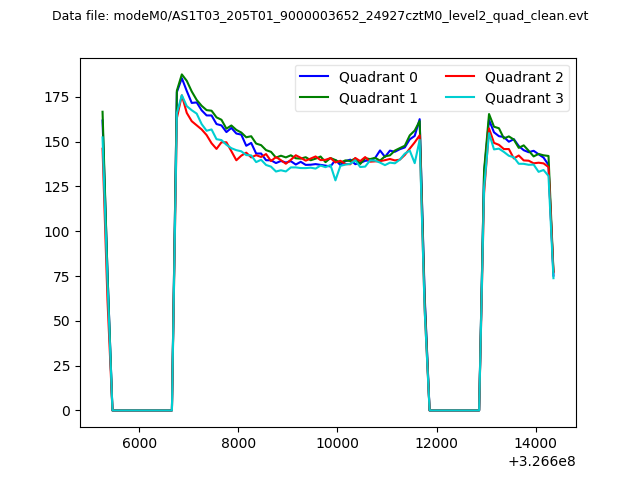 |
|
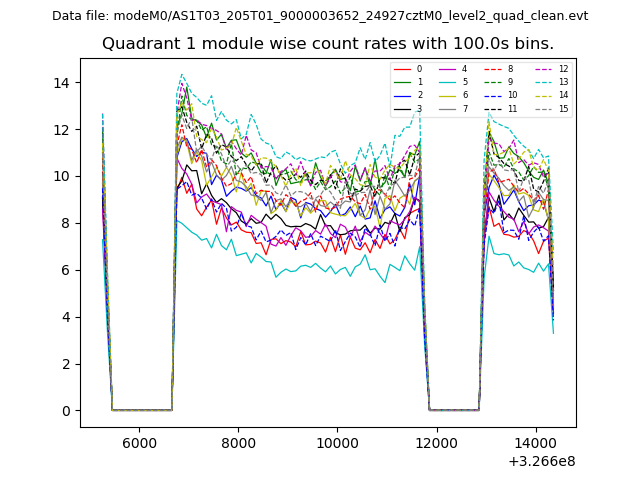
| Module-wise count rates for Quadrant A Data is divided into 100 sec bins |
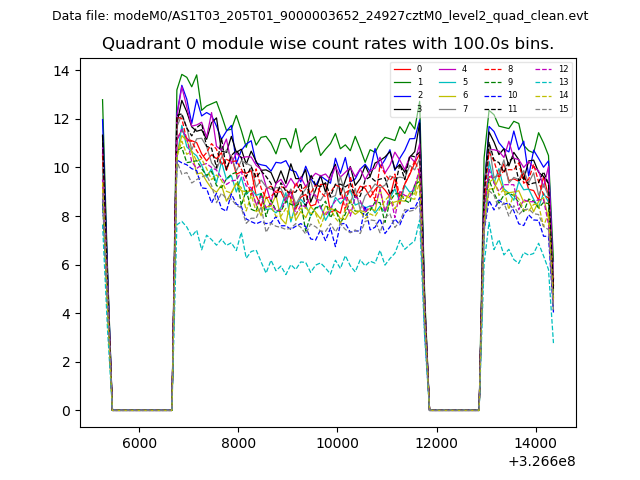 |
 |
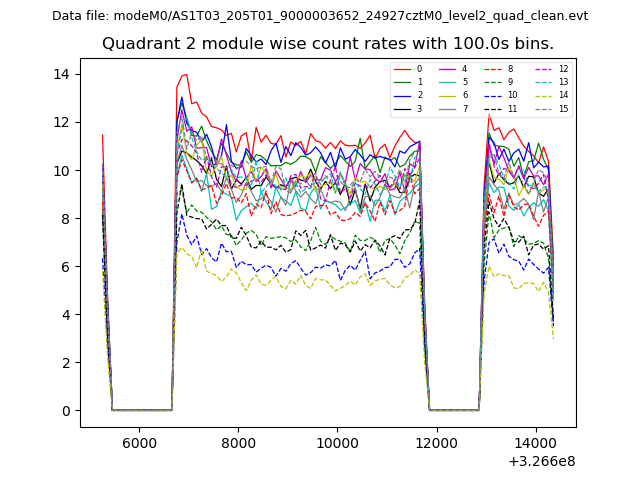
| Module-wise count rates for Quadrant B Data is divided into 100 sec bins |
 |
 |
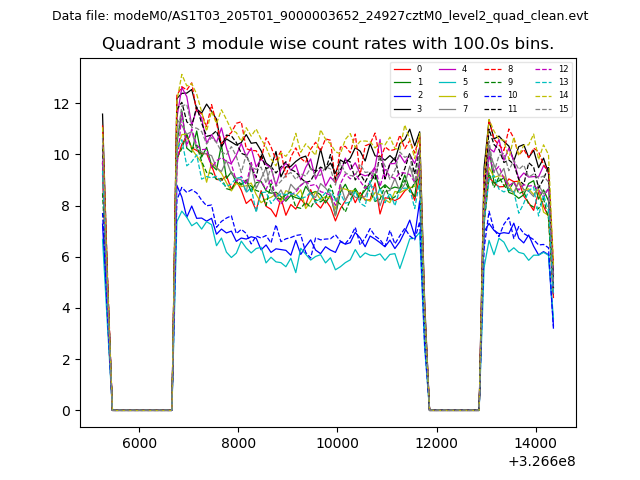
| Module-wise count rates for Quadrant C Data is divided into 100 sec bins |
 |
 |
| Module-wise count rates for Quadrant D Data is divided into 100 sec bins |
 |
 |
| Parameter | Plot |
|---|---|
| CZT HV Monitor | 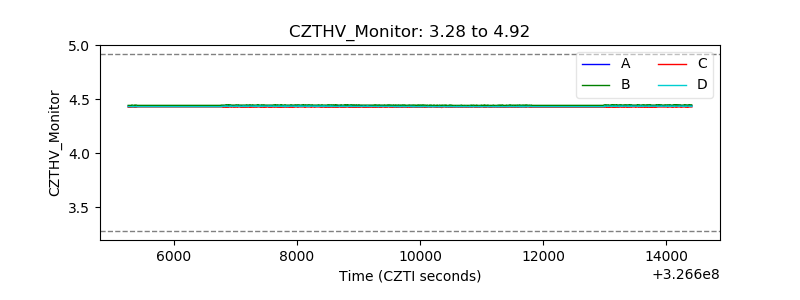 |
| D_VDD | 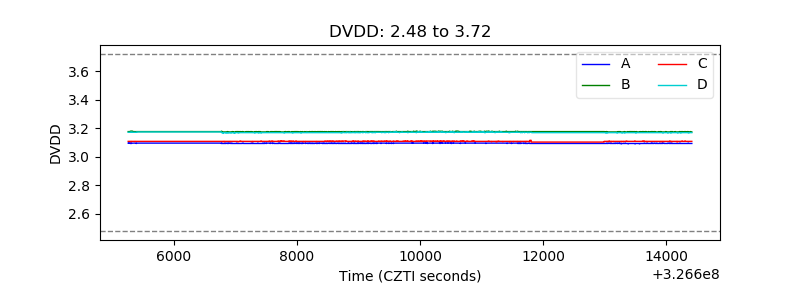 |
| Temperature 1 | 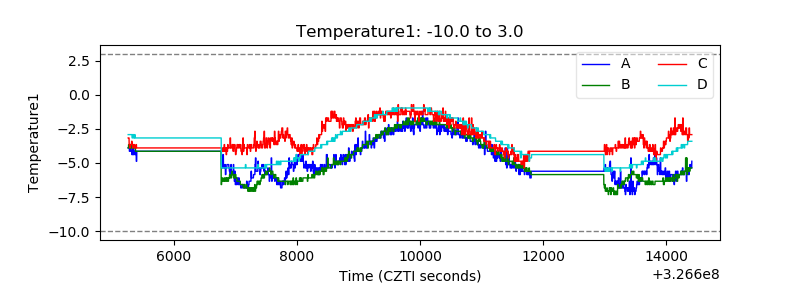 |
| Veto HV Monitor | 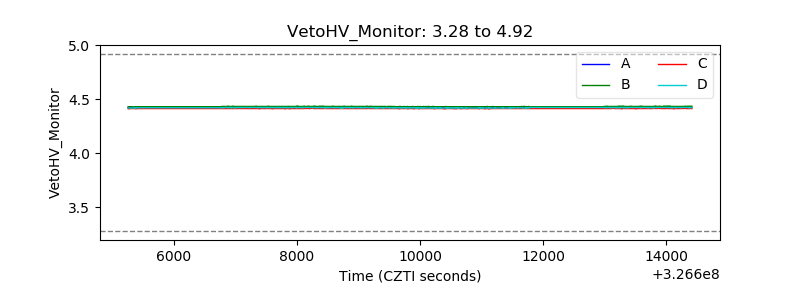 |
| Veto LLD | 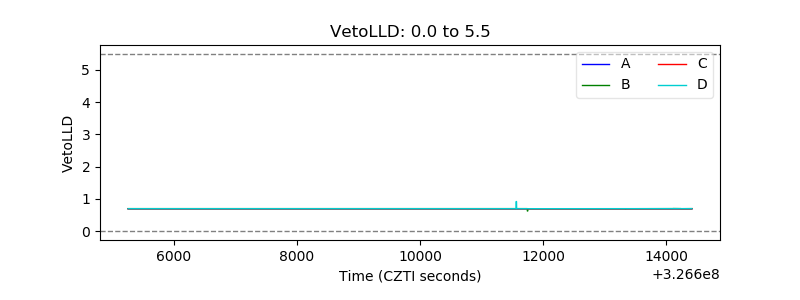 |
| Alpha Counter |  |
| _CPM_Rate | 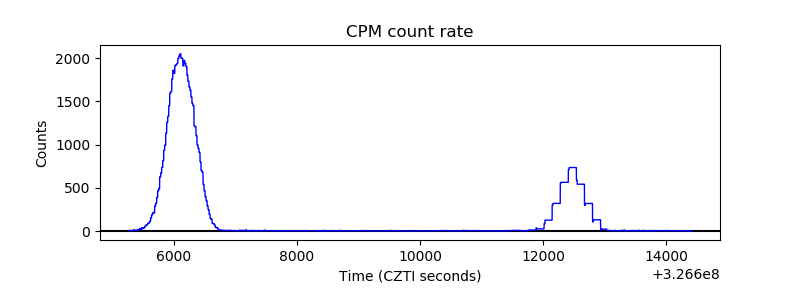 |
| CZT Counter | 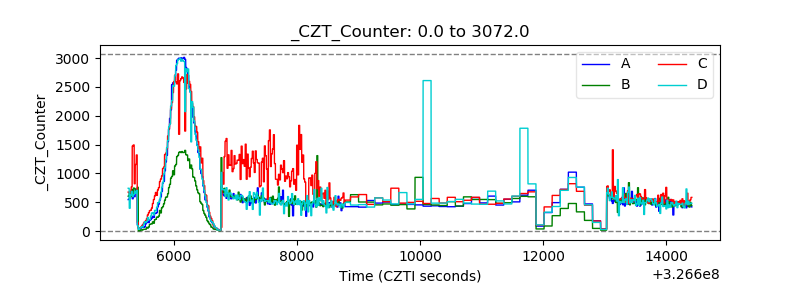 |
| +2.5 Volts monitor |  |
| +5 Volts monitor |  |
| _ROLL_ROT | 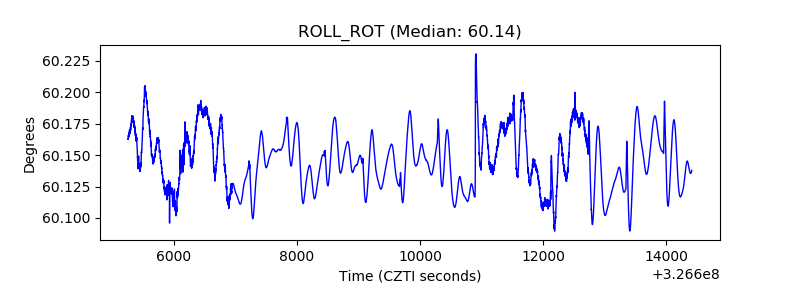 |
| _Roll_DEC | 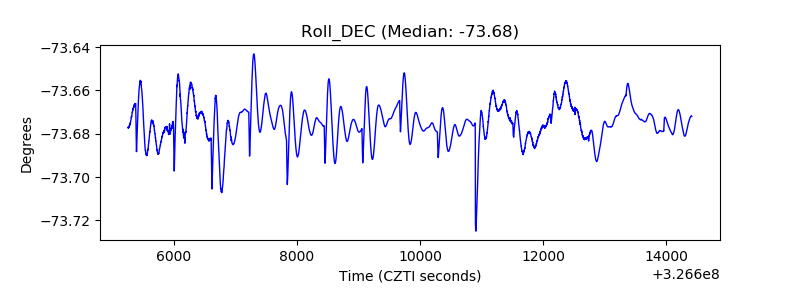 |
| _Roll_RA |  |
| Veto Counter | 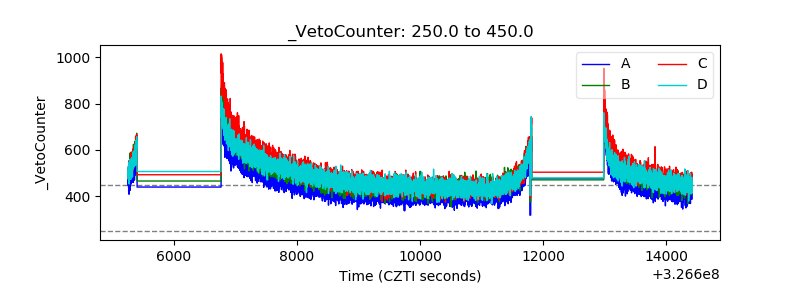 |