| Param | Original file | Final file |
|---|---|---|
| Filename | modeM0/AS1T03_205T01_9000003652_24928cztM0_level2.evt | modeM0/AS1T03_205T01_9000003652_24928cztM0_level2_quad_clean.evt |
| Size (bytes) | 479,946,240 | 136,497,600 |
| Size | 457.7 MB | 130.2 MB |
| Events in quadrant A | 3,193,402 | 929,322 |
| Events in quadrant B | 3,295,481 | 939,764 |
| Events in quadrant C | 4,309,999 | 899,176 |
| Events in quadrant D | 3,279,927 | 897,659 |
| Mode SS | |||
|---|---|---|---|
| Quadrant | BADHDUFLAG | Total packets | Discarded packets |
| A | 0 | 136 | 0 |
| B | 0 | 136 | 0 |
| C | 0 | 136 | 0 |
| D | 0 | 136 | 0 |
| Mode M9 | |||
|---|---|---|---|
| Quadrant | BADHDUFLAG | Total packets | Discarded packets |
| A | 0 | 9 | 0 |
| B | 0 | 9 | 0 |
| C | 0 | 9 | 0 |
| D | 0 | 9 | 0 |
| Mode M0 | |||
|---|---|---|---|
| Quadrant | BADHDUFLAG | Total packets | Discarded packets |
| A | 0 | 13702 | 2 |
| B | 0 | 13991 | 2 |
| C | 0 | 17183 | 2 |
| D | 0 | 14095 | 2 |
| Quadrant | Total seconds | Saturated seconds | Saturation percentage |
|---|---|---|---|
| A | 6721 | 58 | 0.862967% |
| B | 6722 | 55 | 0.818209% |
| C | 6722 | 193 | 2.871169% |
| D | 6722 | 51 | 0.758703% |
Noise dominated data is calculated using 1-second bins in cleaned event files. If a bin has >2000 counts, and if more than 50% of those come from <1% of pixels, then it is considered to be noise-dominated and hence unusable.
| Quadrant | # 1 sec bins | Bins with >0 counts | Bins with >2000 counts | High rate bins dominated by noise | Noise dominated (total time) | Noise dominated (detector-on time) | Marked lightcurve |
|---|---|---|---|---|---|---|---|
| A | 7556 | 6722 | 0 | 0 | 0.00% | 0.00% | 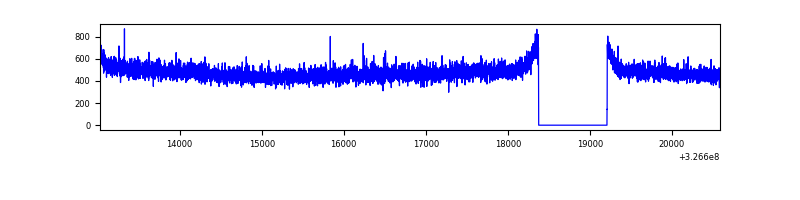 |
| B | 7557 | 6723 | 1 | 1 | 0.01% | 0.01% | 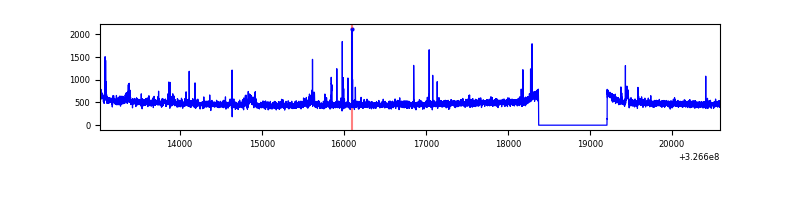 |
| C | 7557 | 6723 | 15 | 15 | 0.20% | 0.22% | 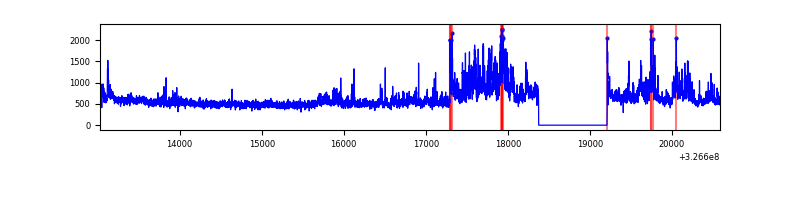 |
| D | 7557 | 6723 | 9 | 9 | 0.12% | 0.13% | 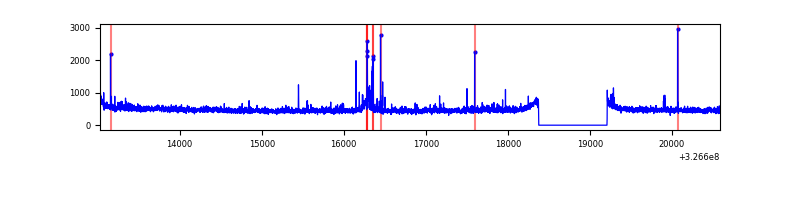 |
Top three noisy pixels from each quadrant. If the there are fewer than three noisy pixels in the level2.evt file, extra rows are filled as -1
| Pixel properties | Quadrant properties | ||||||
|---|---|---|---|---|---|---|---|
| Quadrant | DetID | PixID | Counts | Sigma | Mean | Median | Sigma |
| A | 13 | 254 | 10684 | 60.16 | 827 | 810 | 164.1 |
| A | 3 | 137 | 7085 | 38.23 | 827 | 810 | 164.1 |
| A | 0 | 226 | 7059 | 38.08 | 827 | 810 | 164.1 |
| B | 4 | 216 | 37301 | 237.54 | 818 | 797 | 153.7 |
| B | 4 | 80 | 23865 | 150.11 | 818 | 797 | 153.7 |
| B | 12 | 111 | 18271 | 113.71 | 818 | 797 | 153.7 |
| C | 7 | 247 | 1002741 | 5462.36 | 799 | 801 | 183.4 |
| C | 14 | 238 | 130764 | 708.53 | 799 | 801 | 183.4 |
| C | 2 | 16 | 47158 | 252.73 | 799 | 801 | 183.4 |
| D | 1 | 52 | 89736 | 455.39 | 814 | 791 | 195.3 |
| D | 8 | 195 | 71347 | 361.24 | 814 | 791 | 195.3 |
| D | 7 | 238 | 38700 | 194.09 | 814 | 791 | 195.3 |
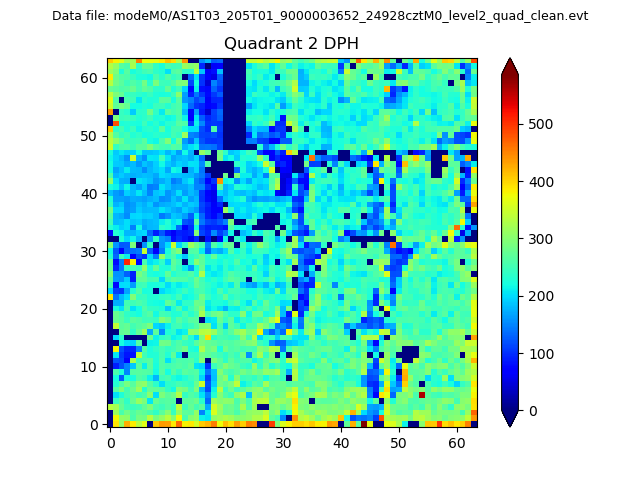
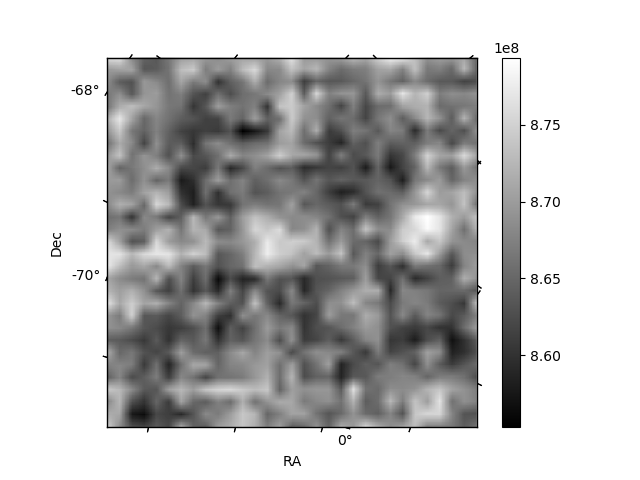
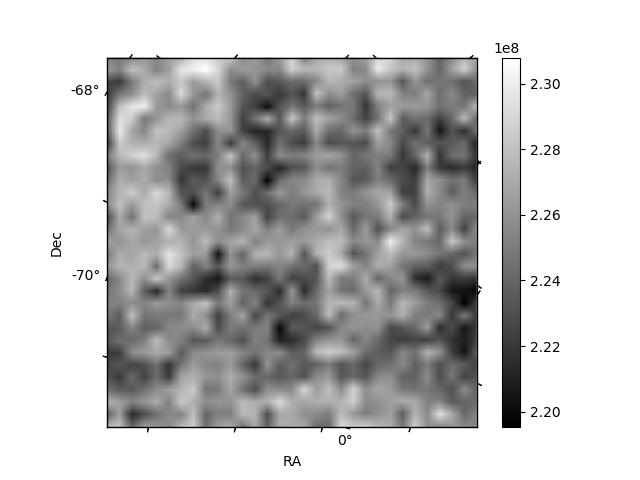
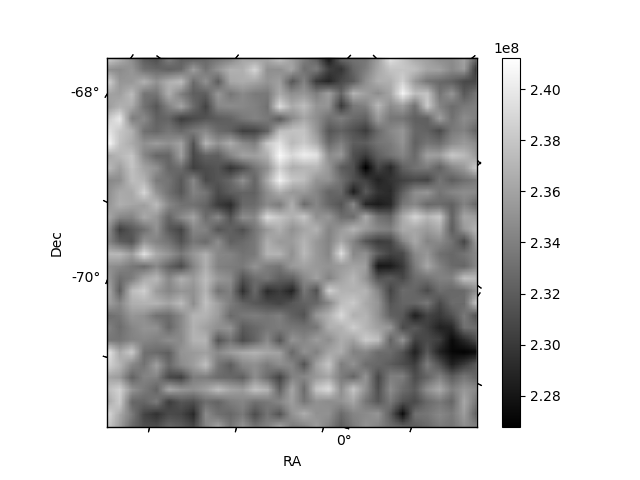
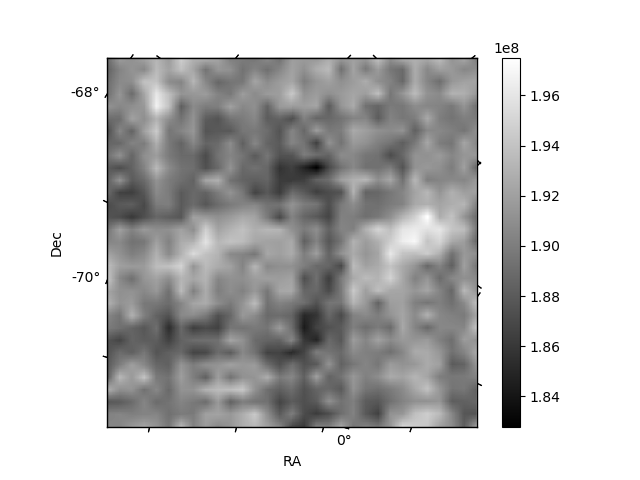
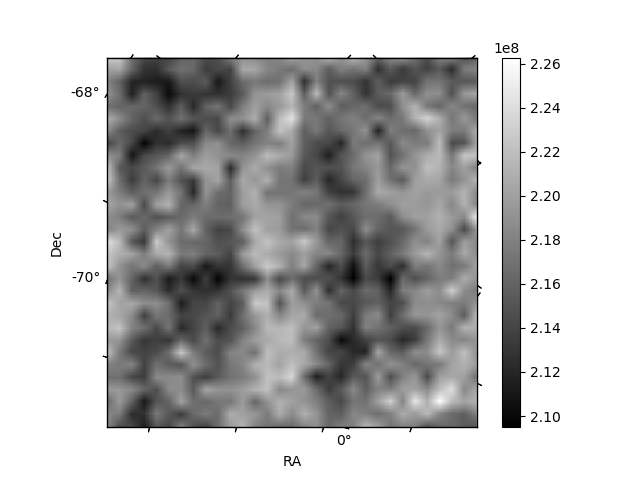
Histogram calculated using DETX and DETY for each event in the final _common_clean file
| Quadrant A | 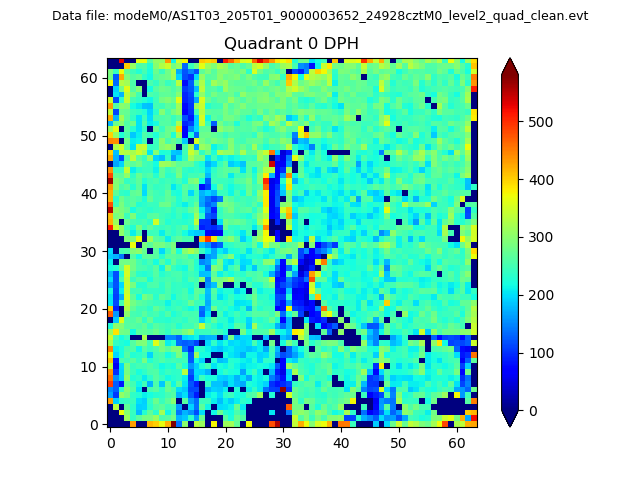 |
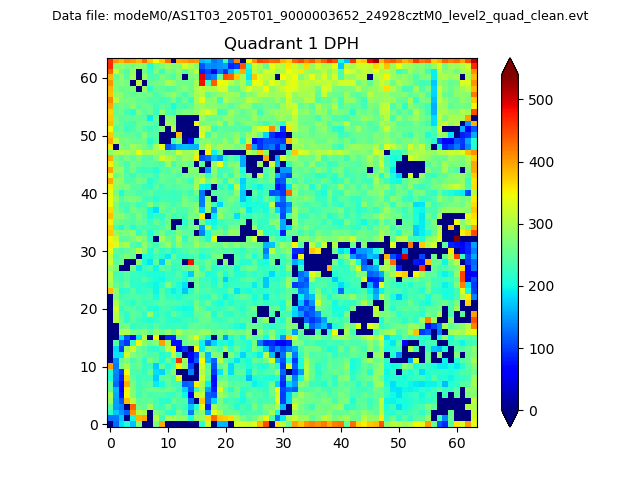 |
Quadrant B |
|---|---|---|---|
| Quadrant D | 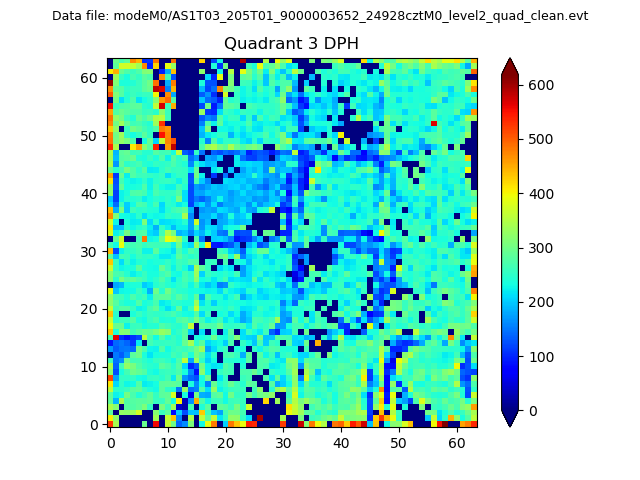 |
 |
Quadrant C |
| Plot type | Count rate plots | Images |
|---|---|---|
| Comparison with Poisson distribution Blue bars denote a histogram of data divided into 1 sec bins. Red curve is a Poisson curve with rate = median count rate of data. |
 |
 |
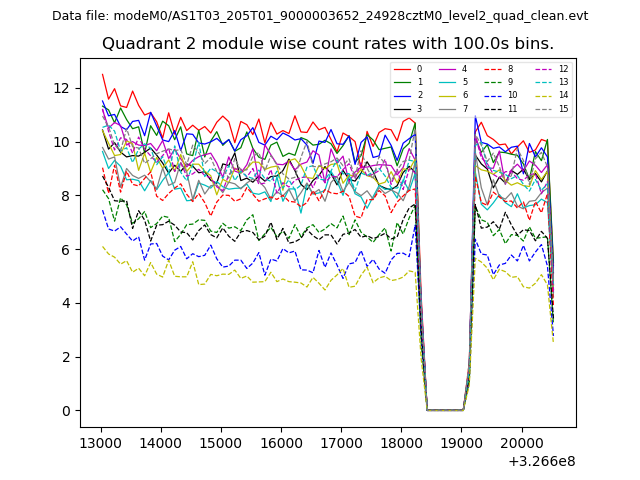
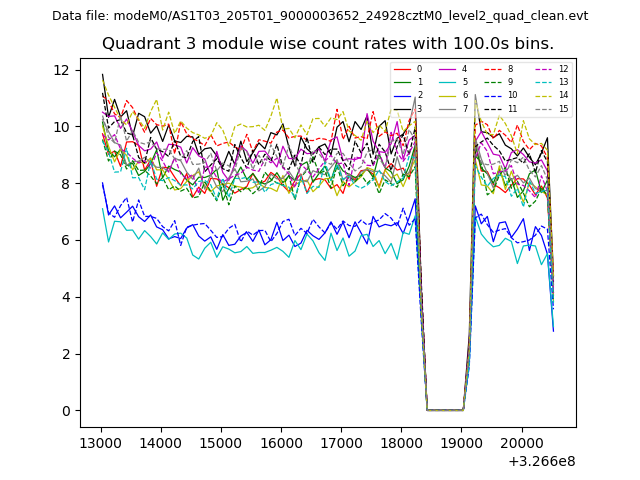
| Quadrant-wise count rates Data is divided into 100 sec bins |
 |
|
| Module-wise count rates for Quadrant A Data is divided into 100 sec bins |
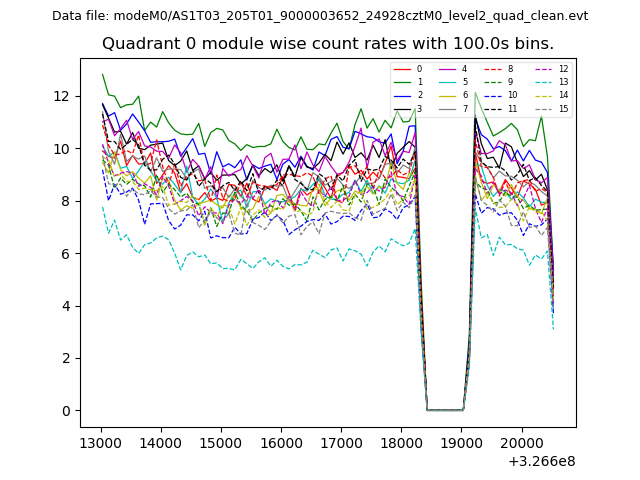 |
 |
| Module-wise count rates for Quadrant B Data is divided into 100 sec bins |
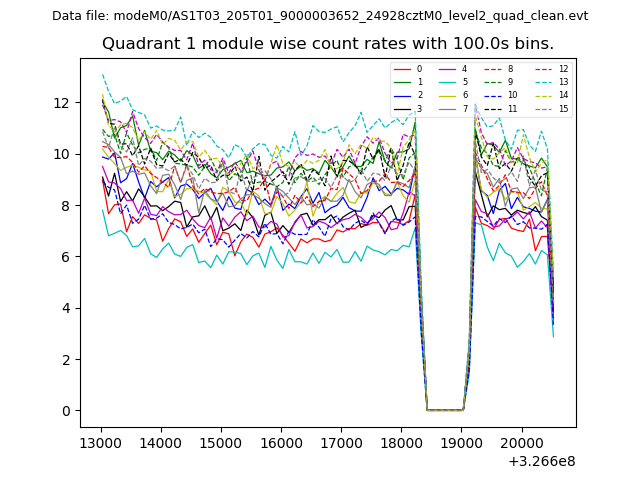 |
 |
| Module-wise count rates for Quadrant C Data is divided into 100 sec bins |
 |
 |
| Module-wise count rates for Quadrant D Data is divided into 100 sec bins |
 |
 |
| Parameter | Plot |
|---|---|
| CZT HV Monitor | 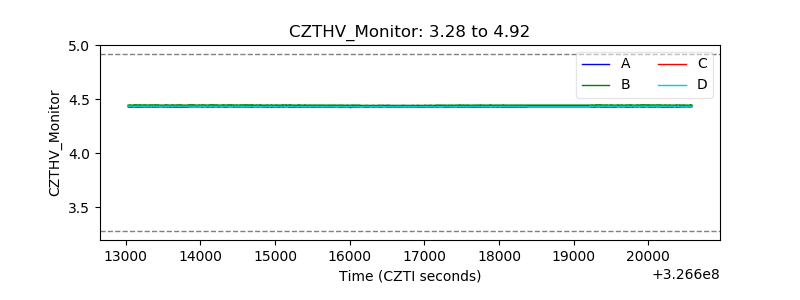 |
| D_VDD | 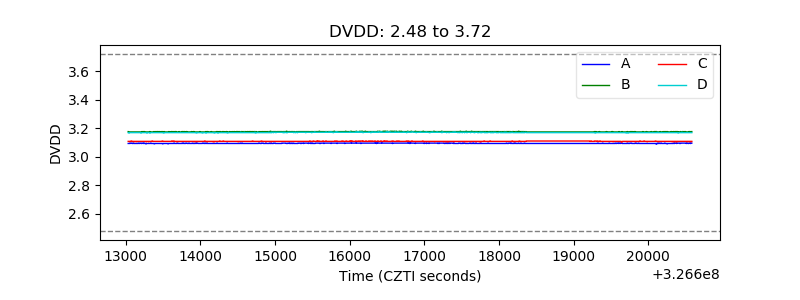 |
| Temperature 1 | 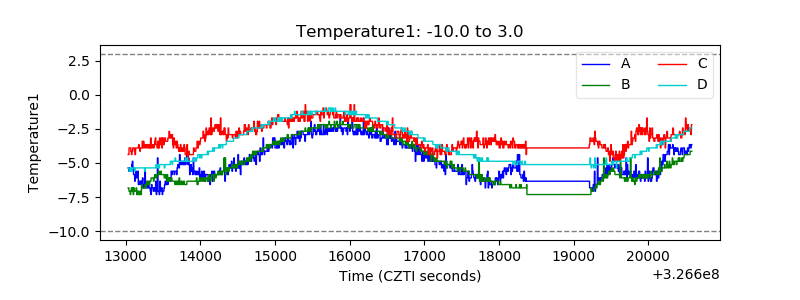 |
| Veto HV Monitor |  |
| Veto LLD | 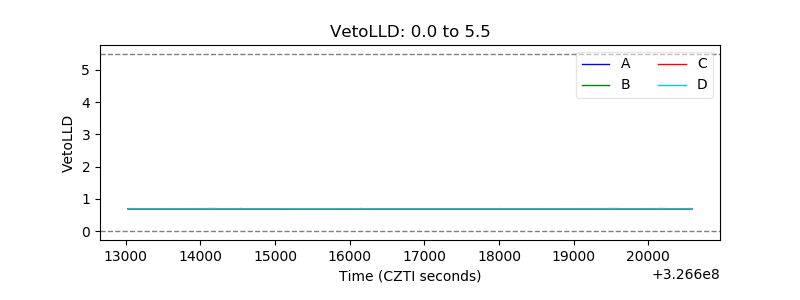 |
| Alpha Counter | 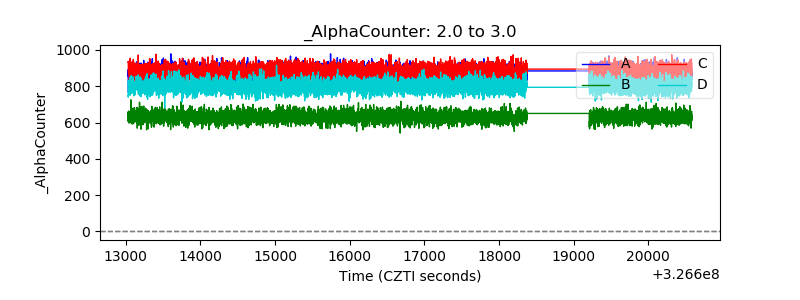 |
| _CPM_Rate |  |
| CZT Counter | 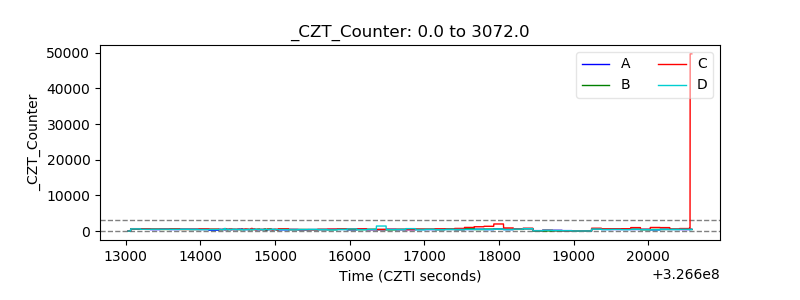 |
| +2.5 Volts monitor |  |
| +5 Volts monitor |  |
| _ROLL_ROT | 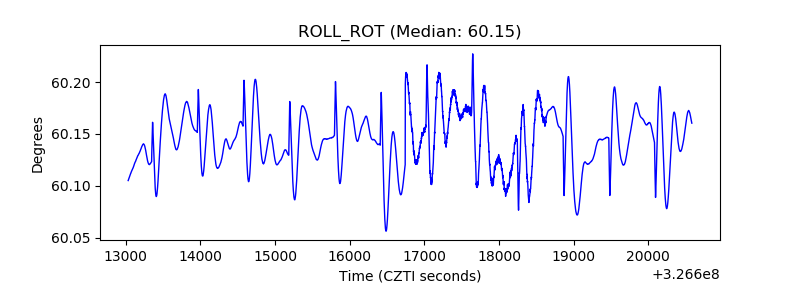 |
| _Roll_DEC | 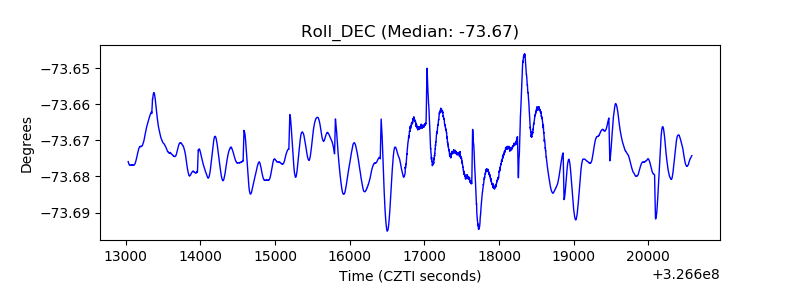 |
| _Roll_RA | 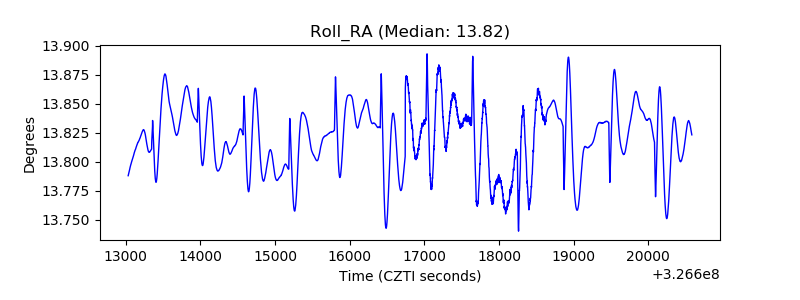 |
| Veto Counter | 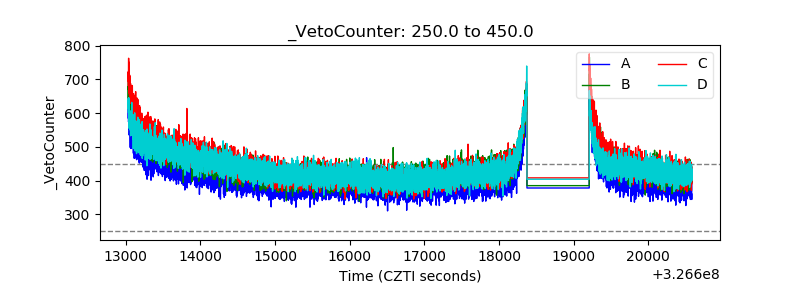 |