| Param | Original file | Final file |
|---|---|---|
| Filename | modeM0/AS1T03_205T01_9000003652_24929cztM0_level2.evt | modeM0/AS1T03_205T01_9000003652_24929cztM0_level2_quad_clean.evt |
| Size (bytes) | 729,256,320 | 147,441,600 |
| Size | 695.5 MB | 140.6 MB |
| Events in quadrant A | 3,632,373 | 1,019,725 |
| Events in quadrant B | 3,774,308 | 1,034,364 |
| Events in quadrant C | 8,983,754 | 912,202 |
| Events in quadrant D | 5,168,044 | 956,950 |
| Mode SS | |||
|---|---|---|---|
| Quadrant | BADHDUFLAG | Total packets | Discarded packets |
| A | 0 | 158 | 0 |
| B | 0 | 158 | 0 |
| C | 0 | 158 | 0 |
| D | 0 | 158 | 0 |
| Mode M9 | |||
|---|---|---|---|
| Quadrant | BADHDUFLAG | Total packets | Discarded packets |
| A | 0 | 5 | 0 |
| B | 0 | 6 | 0 |
| C | 0 | 6 | 0 |
| D | 0 | 6 | 0 |
| Mode M0 | |||
|---|---|---|---|
| Quadrant | BADHDUFLAG | Total packets | Discarded packets |
| A | 0 | 15947 | 2 |
| B | 0 | 16216 | 2 |
| C | 0 | 32117 | 2 |
| D | 0 | 20514 | 2 |
| Quadrant | Total seconds | Saturated seconds | Saturation percentage |
|---|---|---|---|
| A | 7783 | 221 | 2.839522% |
| B | 7783 | 250 | 3.212129% |
| C | 7783 | 1806 | 23.204420% |
| D | 7783 | 673 | 8.647051% |
Noise dominated data is calculated using 1-second bins in cleaned event files. If a bin has >2000 counts, and if more than 50% of those come from <1% of pixels, then it is considered to be noise-dominated and hence unusable.
| Quadrant | # 1 sec bins | Bins with >0 counts | Bins with >2000 counts | High rate bins dominated by noise | Noise dominated (total time) | Noise dominated (detector-on time) | Marked lightcurve |
|---|---|---|---|---|---|---|---|
| A | 8043 | 7784 | 0 | 0 | 0.00% | 0.00% | 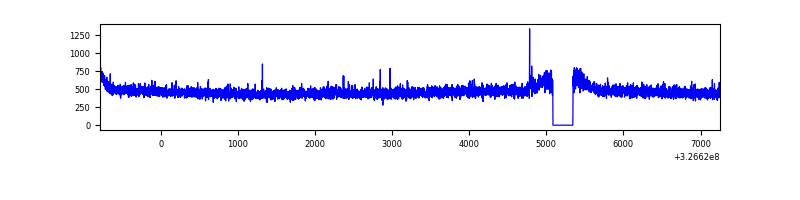 |
| B | 8043 | 7784 | 5 | 5 | 0.06% | 0.06% | 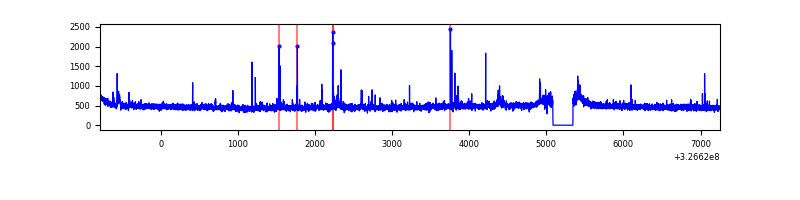 |
| C | 8043 | 7784 | 866 | 866 | 10.77% | 11.13% | 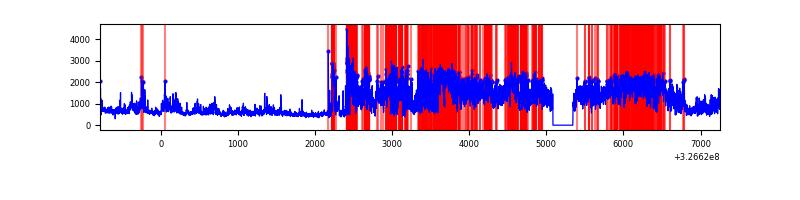 |
| D | 8043 | 7784 | 329 | 329 | 4.09% | 4.23% | 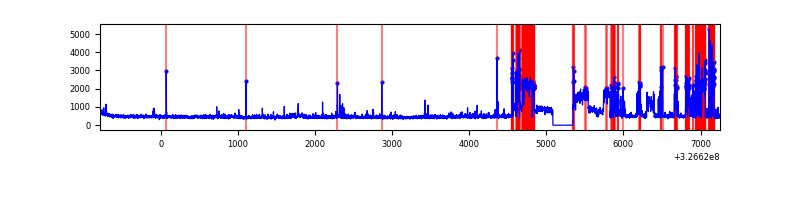 |
Top three noisy pixels from each quadrant. If the there are fewer than three noisy pixels in the level2.evt file, extra rows are filled as -1
| Pixel properties | Quadrant properties | ||||||
|---|---|---|---|---|---|---|---|
| Quadrant | DetID | PixID | Counts | Sigma | Mean | Median | Sigma |
| A | 13 | 254 | 12805 | 62.87 | 940 | 918 | 189.1 |
| A | 3 | 137 | 8424 | 39.7 | 940 | 918 | 189.1 |
| A | 0 | 226 | 8091 | 37.94 | 940 | 918 | 189.1 |
| B | 0 | 189 | 29046 | 159.71 | 929 | 904 | 176.2 |
| B | 4 | 216 | 27811 | 152.7 | 929 | 904 | 176.2 |
| B | 12 | 111 | 21358 | 116.08 | 929 | 904 | 176.2 |
| C | 7 | 247 | 5190170 | 26316.06 | 856 | 861 | 197.2 |
| C | 2 | 16 | 217531 | 1098.78 | 856 | 861 | 197.2 |
| C | 14 | 238 | 135701 | 683.8 | 856 | 861 | 197.2 |
| D | 1 | 52 | 1407358 | 6497.4 | 904 | 877 | 216.5 |
| D | 7 | 238 | 175110 | 804.89 | 904 | 877 | 216.5 |
| D | 8 | 195 | 140245 | 643.83 | 904 | 877 | 216.5 |
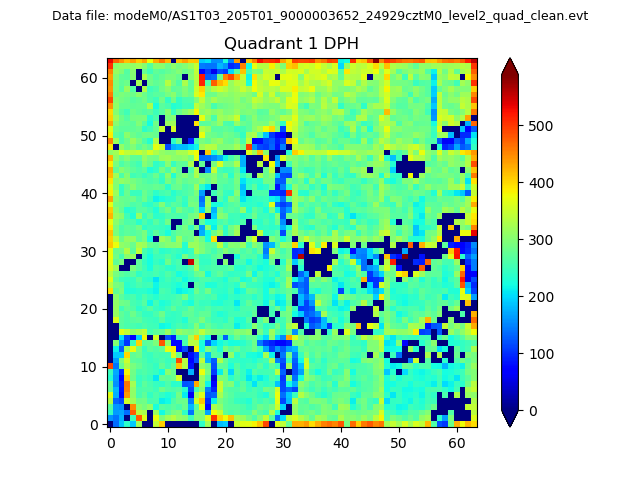
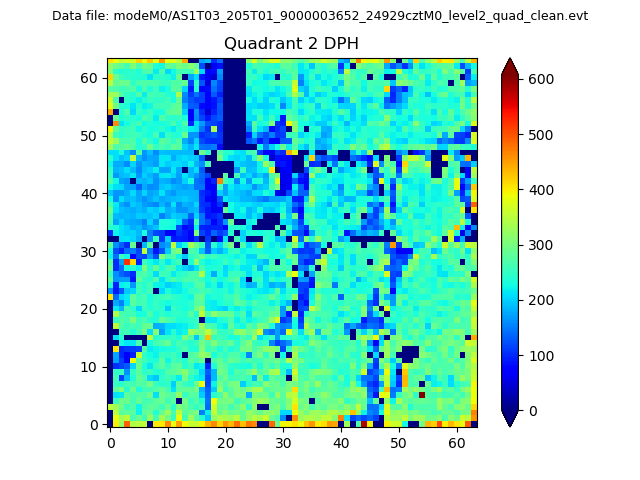
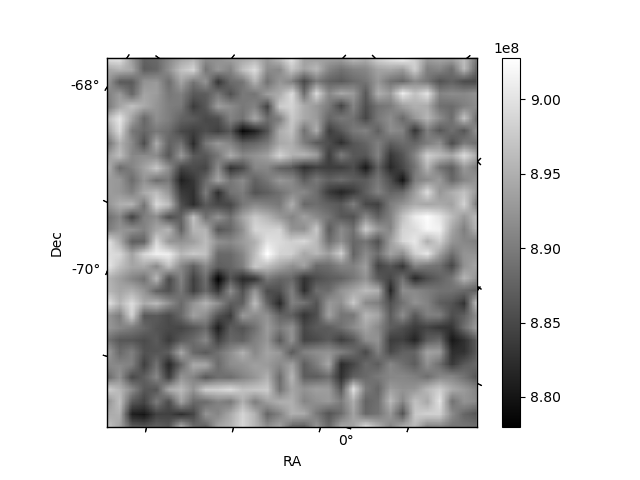
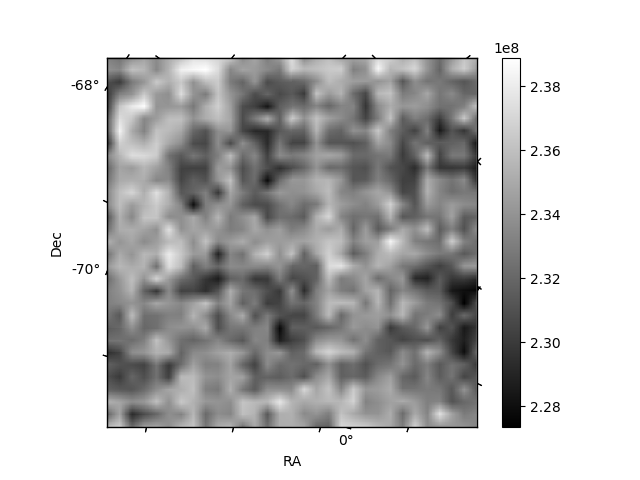
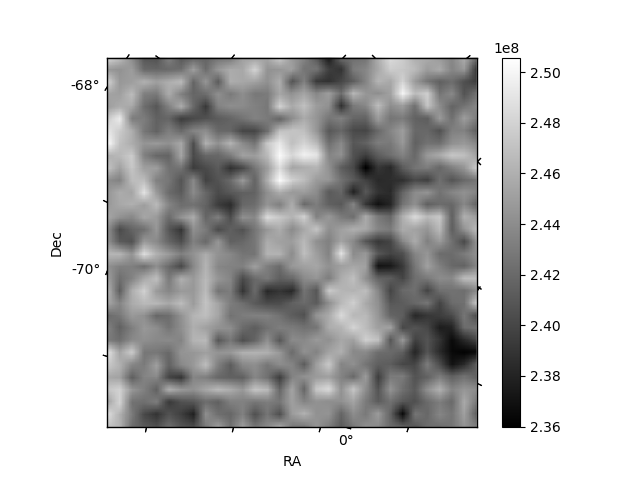
Histogram calculated using DETX and DETY for each event in the final _common_clean file
| Quadrant A |  |
 |
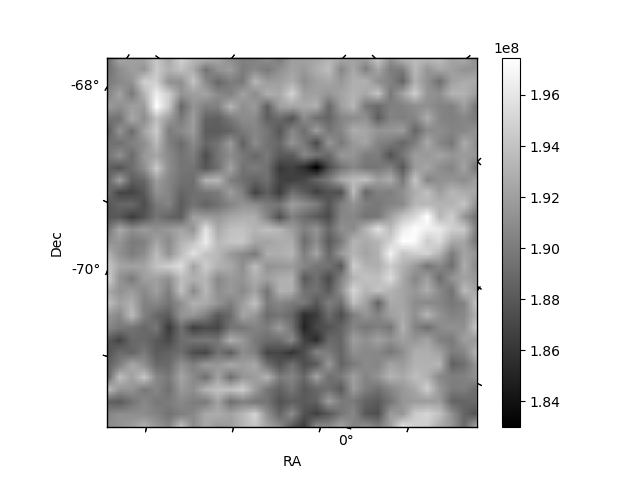
Quadrant B |
|---|---|---|---|
| Quadrant D | 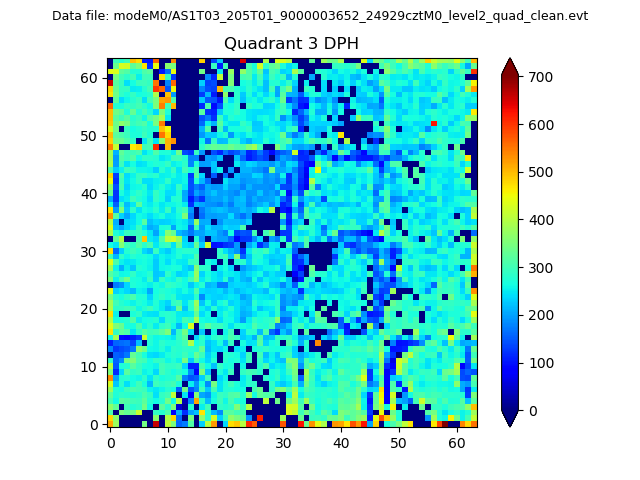 |
 |
Quadrant C |
| Plot type | Count rate plots | Images |
|---|---|---|
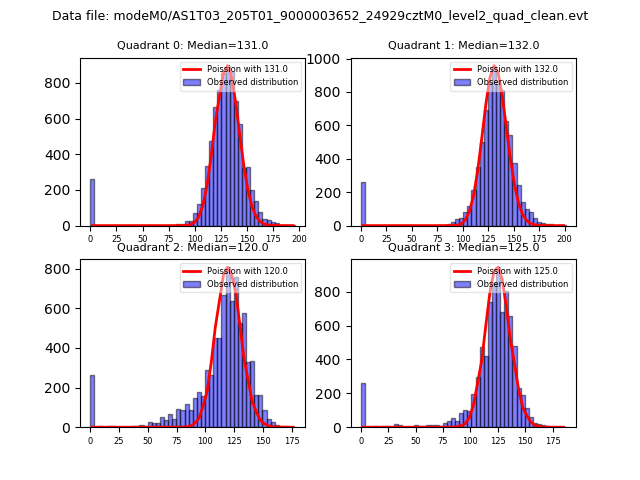
| Comparison with Poisson distribution Blue bars denote a histogram of data divided into 1 sec bins. Red curve is a Poisson curve with rate = median count rate of data. |
 |
 |
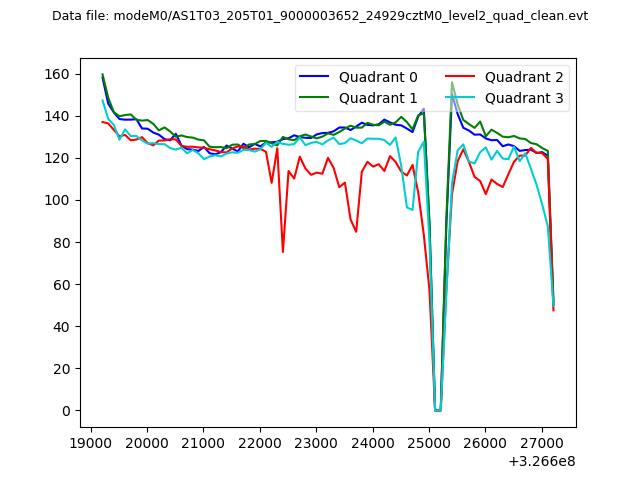
| Quadrant-wise count rates Data is divided into 100 sec bins |
 |
|
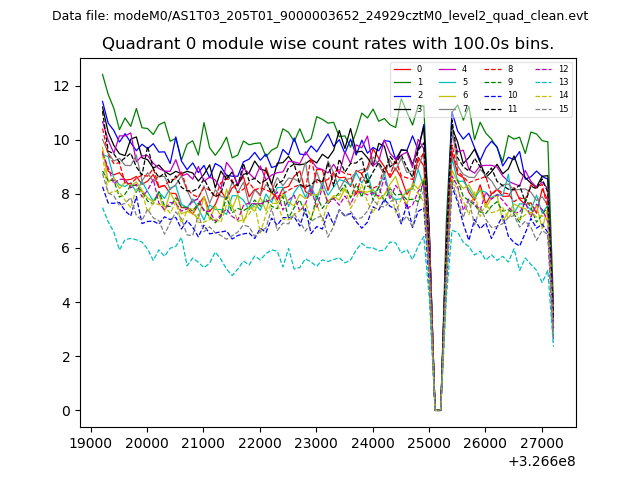
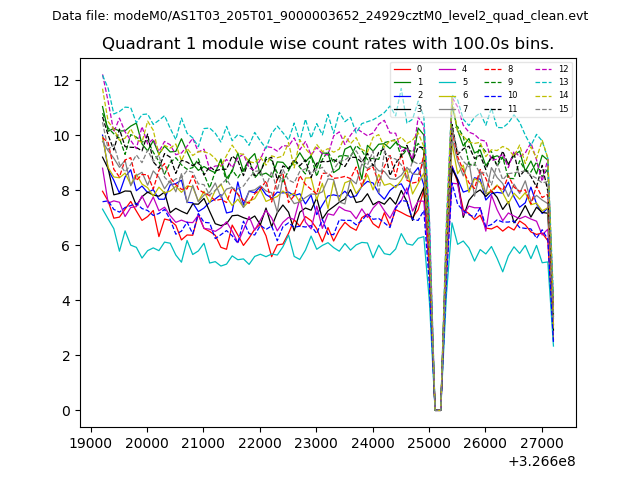
| Module-wise count rates for Quadrant A Data is divided into 100 sec bins |
 |
 |
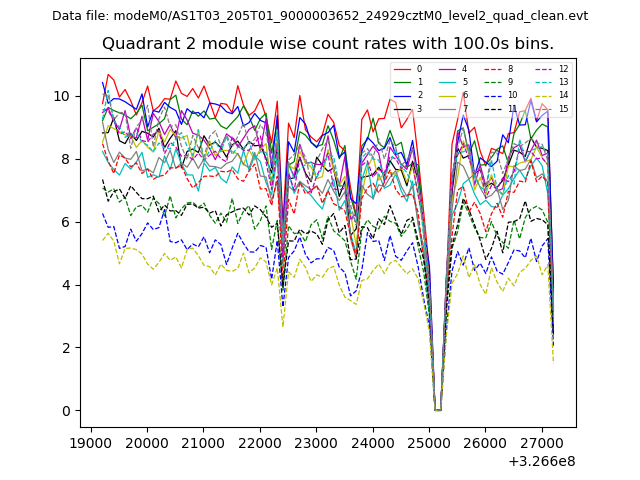
| Module-wise count rates for Quadrant B Data is divided into 100 sec bins |
 |
 |
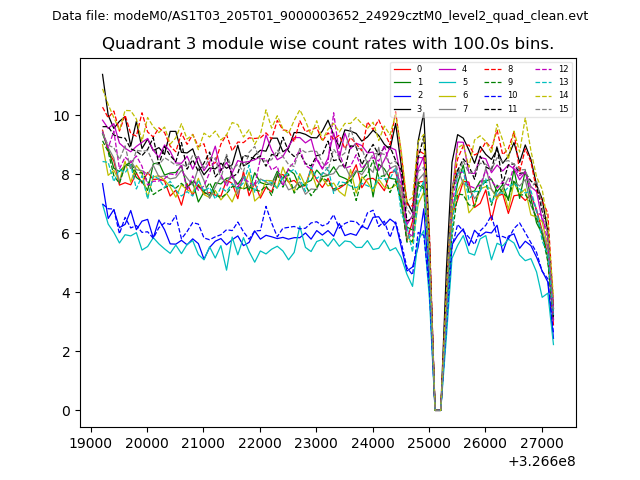
| Module-wise count rates for Quadrant C Data is divided into 100 sec bins |
 |
 |
| Module-wise count rates for Quadrant D Data is divided into 100 sec bins |
 |
 |
| Parameter | Plot |
|---|---|
| CZT HV Monitor | 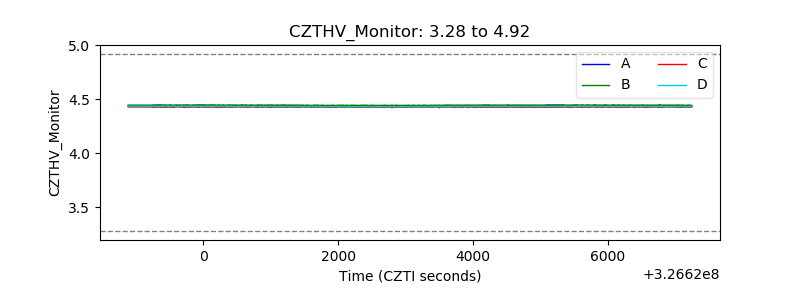 |
| D_VDD | 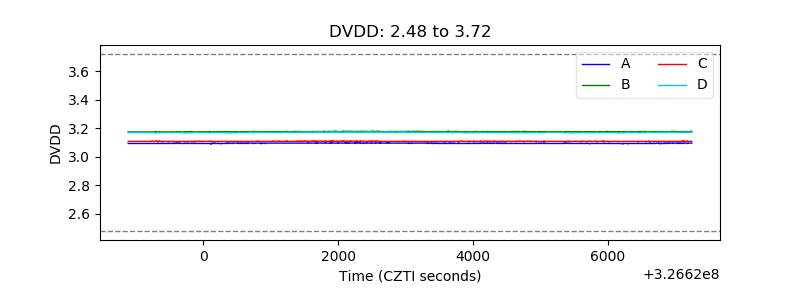 |
| Temperature 1 | 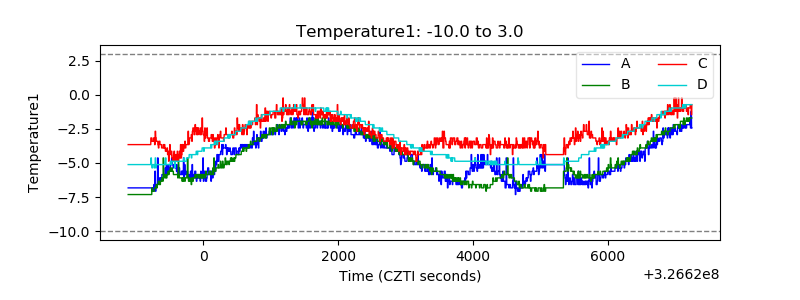 |
| Veto HV Monitor | 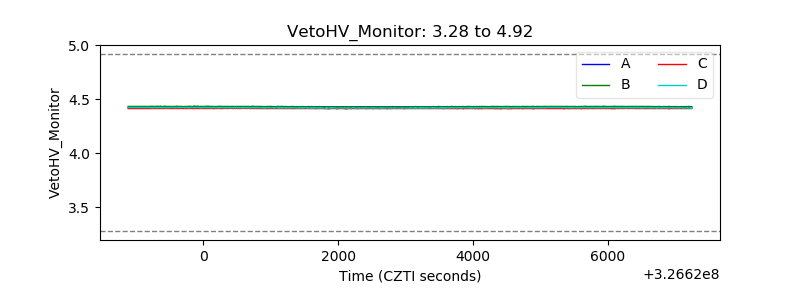 |
| Veto LLD | 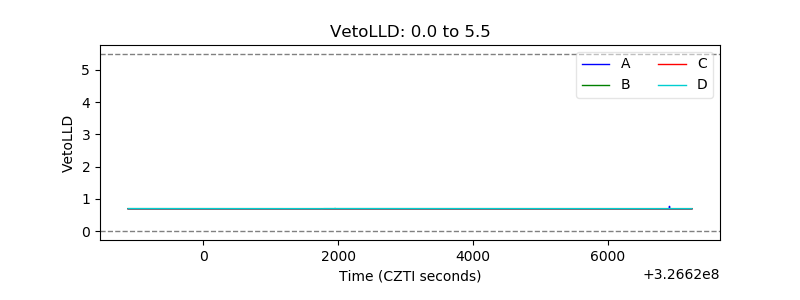 |
| Alpha Counter | 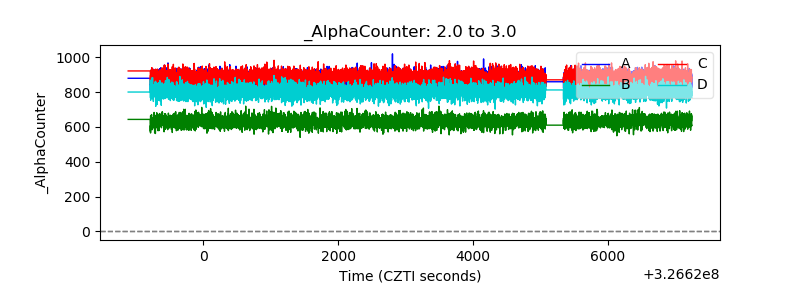 |
| _CPM_Rate | 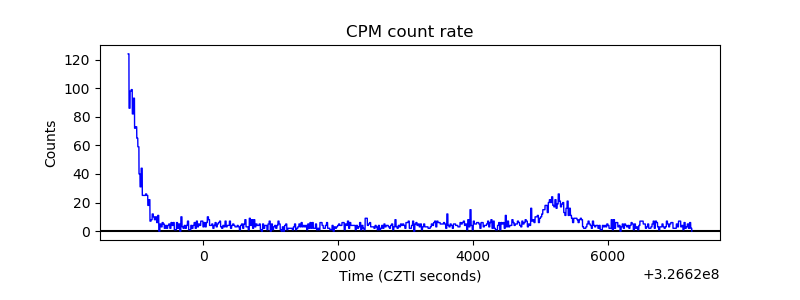 |
| CZT Counter | 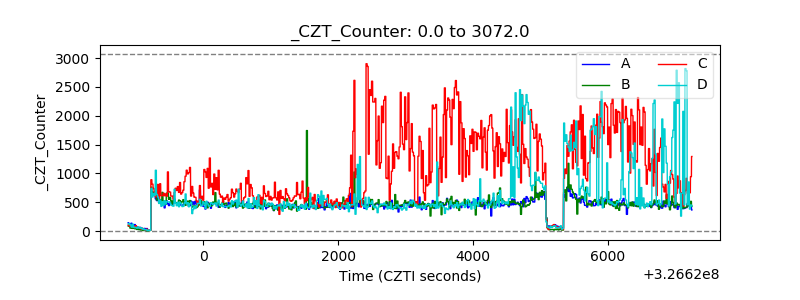 |
| +2.5 Volts monitor |  |
| +5 Volts monitor |  |
| _ROLL_ROT | 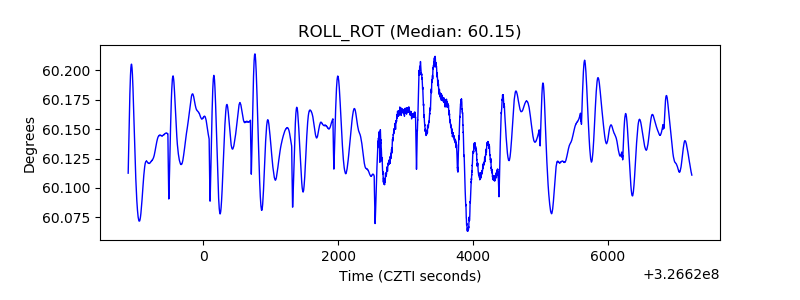 |
| _Roll_DEC |  |
| _Roll_RA |  |
| Veto Counter | 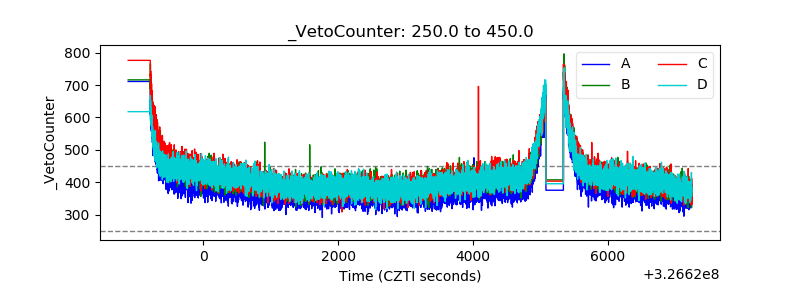 |