| Param | Original file | Final file |
|---|---|---|
| Filename | modeM0/AS1T03_205T01_9000003652_24930cztM0_level2.evt | modeM0/AS1T03_205T01_9000003652_24930cztM0_level2_quad_clean.evt |
| Size (bytes) | 603,123,840 | 129,617,280 |
| Size | 575.2 MB | 123.6 MB |
| Events in quadrant A | 3,244,120 | 897,255 |
| Events in quadrant B | 3,331,499 | 907,474 |
| Events in quadrant C | 4,109,095 | 868,339 |
| Events in quadrant D | 7,105,740 | 764,115 |
| Mode SS | |||
|---|---|---|---|
| Quadrant | BADHDUFLAG | Total packets | Discarded packets |
| A | 0 | 140 | 0 |
| B | 0 | 140 | 0 |
| C | 0 | 140 | 0 |
| D | 0 | 140 | 0 |
| Mode M0 | |||
|---|---|---|---|
| Quadrant | BADHDUFLAG | Total packets | Discarded packets |
| A | 0 | 14386 | 1 |
| B | 0 | 14547 | 1 |
| C | 0 | 16690 | 1 |
| D | 0 | 25667 | 1 |
| Quadrant | Total seconds | Saturated seconds | Saturation percentage |
|---|---|---|---|
| A | 7001 | 212 | 3.028139% |
| B | 7002 | 253 | 3.613253% |
| C | 7002 | 367 | 5.241360% |
| D | 7002 | 1531 | 21.865181% |
Noise dominated data is calculated using 1-second bins in cleaned event files. If a bin has >2000 counts, and if more than 50% of those come from <1% of pixels, then it is considered to be noise-dominated and hence unusable.
| Quadrant | # 1 sec bins | Bins with >0 counts | Bins with >2000 counts | High rate bins dominated by noise | Noise dominated (total time) | Noise dominated (detector-on time) | Marked lightcurve |
|---|---|---|---|---|---|---|---|
| A | 7046 | 7002 | 0 | 0 | 0.00% | 0.00% | 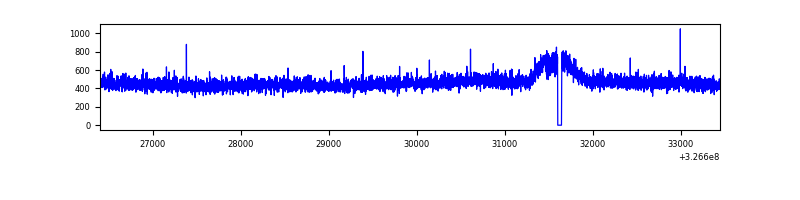 |
| B | 7047 | 7003 | 0 | 0 | 0.00% | 0.00% | 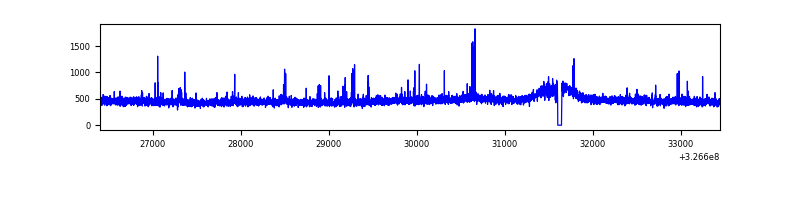 |
| C | 7047 | 7003 | 35 | 35 | 0.50% | 0.50% | 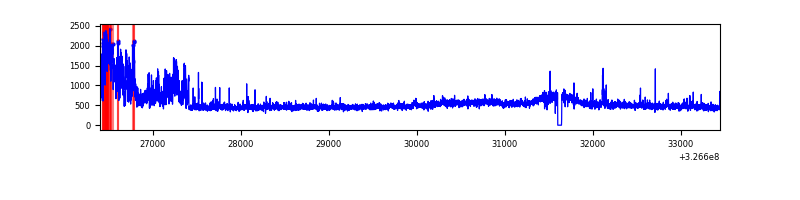 |
| D | 7047 | 7003 | 1328 | 1328 | 18.84% | 18.96% | 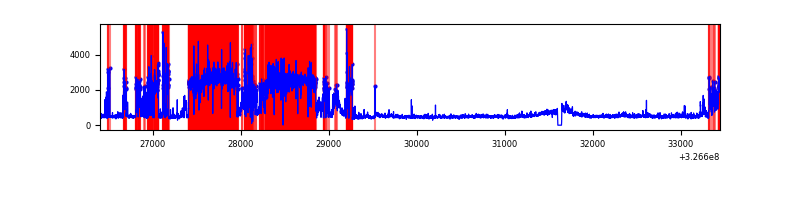 |
Top three noisy pixels from each quadrant. If the there are fewer than three noisy pixels in the level2.evt file, extra rows are filled as -1
| Pixel properties | Quadrant properties | ||||||
|---|---|---|---|---|---|---|---|
| Quadrant | DetID | PixID | Counts | Sigma | Mean | Median | Sigma |
| A | 13 | 254 | 11325 | 62.23 | 839 | 819 | 168.8 |
| A | 3 | 137 | 7926 | 42.1 | 839 | 819 | 168.8 |
| A | 0 | 226 | 7232 | 37.98 | 839 | 819 | 168.8 |
| B | 4 | 80 | 36209 | 223.11 | 831 | 810 | 158.7 |
| B | 12 | 111 | 19224 | 116.06 | 831 | 810 | 158.7 |
| B | 11 | 111 | 17540 | 105.44 | 831 | 810 | 158.7 |
| C | 7 | 247 | 673997 | 3595.27 | 805 | 809 | 187.2 |
| C | 14 | 238 | 127771 | 678.06 | 805 | 809 | 187.2 |
| C | 10 | 218 | 123355 | 654.47 | 805 | 809 | 187.2 |
| D | 7 | 238 | 2783753 | 15448.08 | 745 | 722 | 180.2 |
| D | 1 | 52 | 1284719 | 7127.22 | 745 | 722 | 180.2 |
| D | 8 | 195 | 150237 | 829.93 | 745 | 722 | 180.2 |
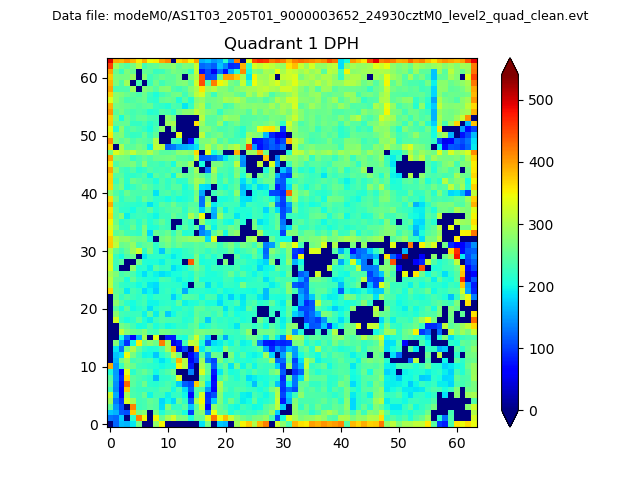
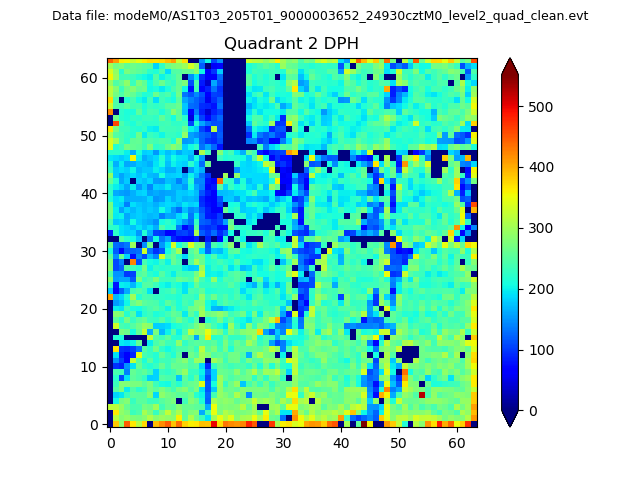
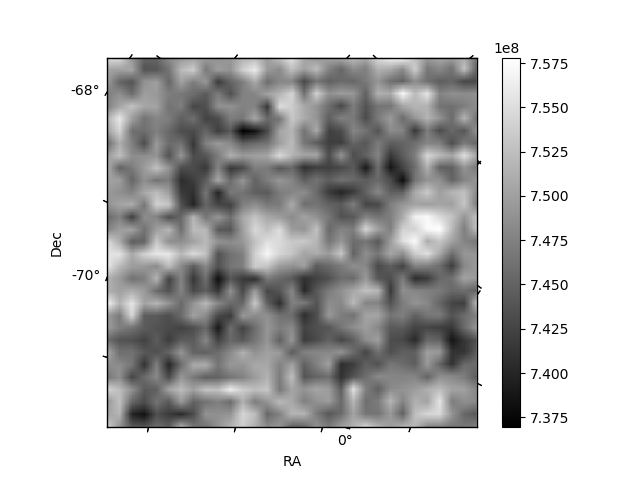
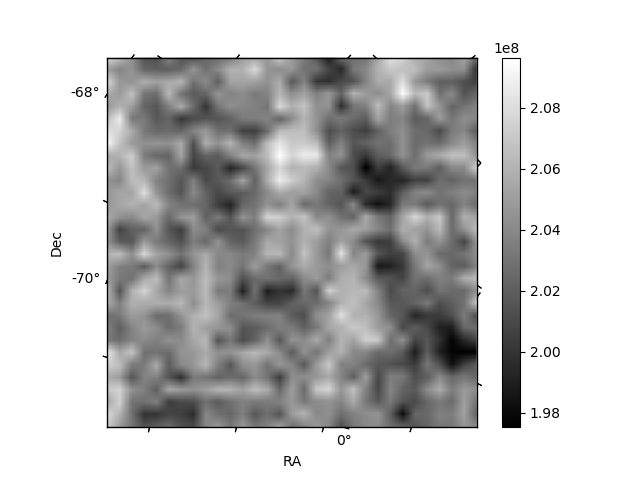
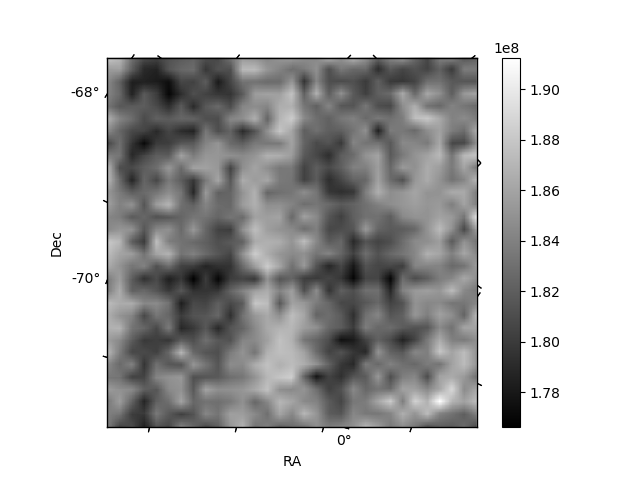
Histogram calculated using DETX and DETY for each event in the final _common_clean file
| Quadrant A |  |
 |
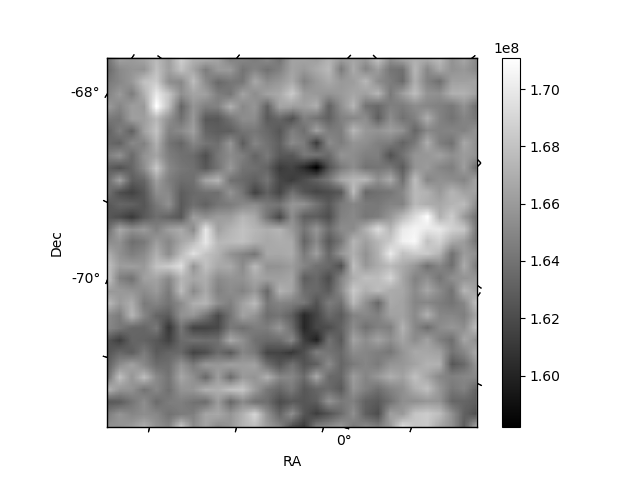
Quadrant B |
|---|---|---|---|
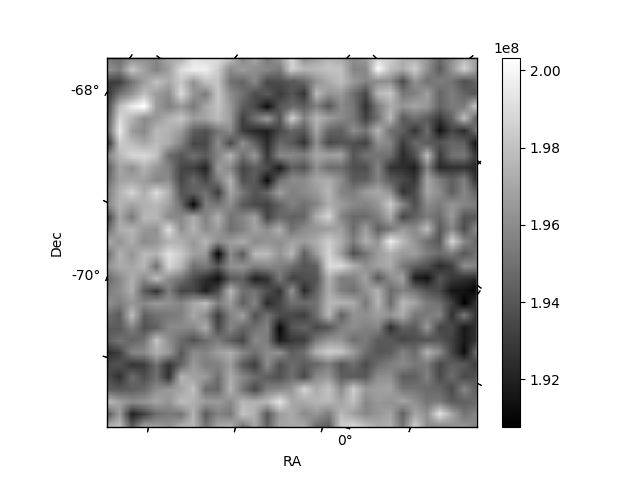
| Quadrant D | 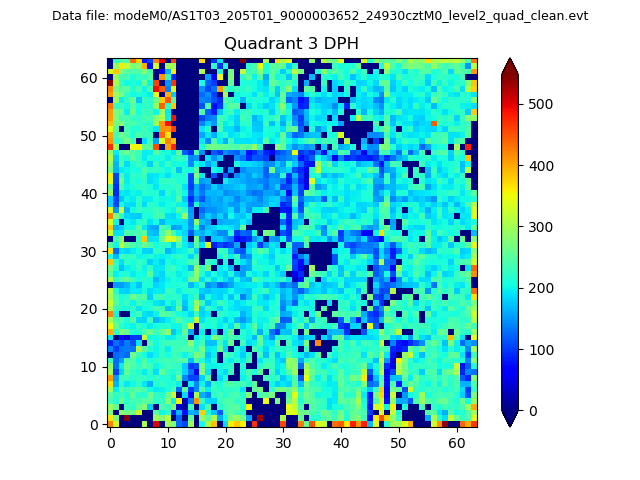 |
 |
Quadrant C |
| Plot type | Count rate plots | Images |
|---|---|---|
| Comparison with Poisson distribution Blue bars denote a histogram of data divided into 1 sec bins. Red curve is a Poisson curve with rate = median count rate of data. |
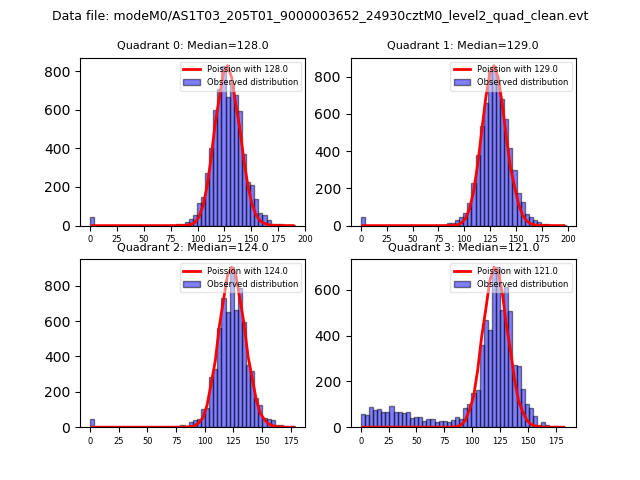 |
 |
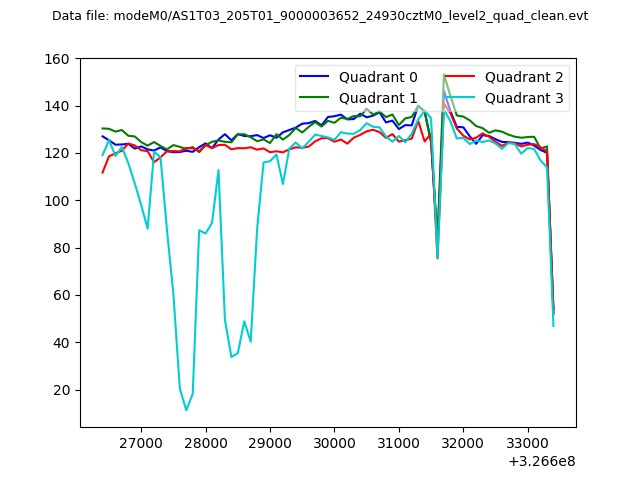
| Quadrant-wise count rates Data is divided into 100 sec bins |
 |
|
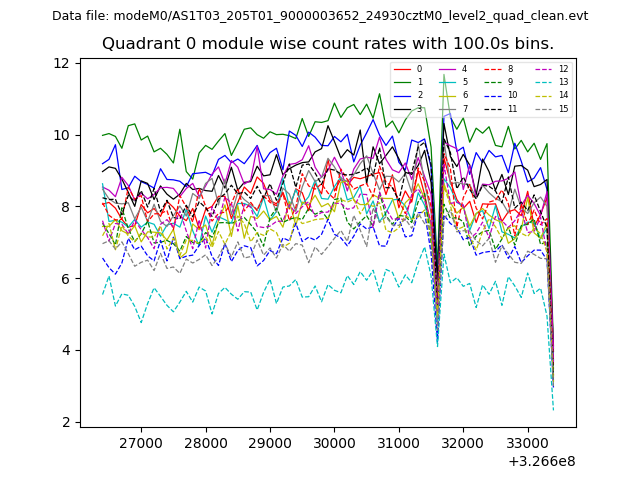
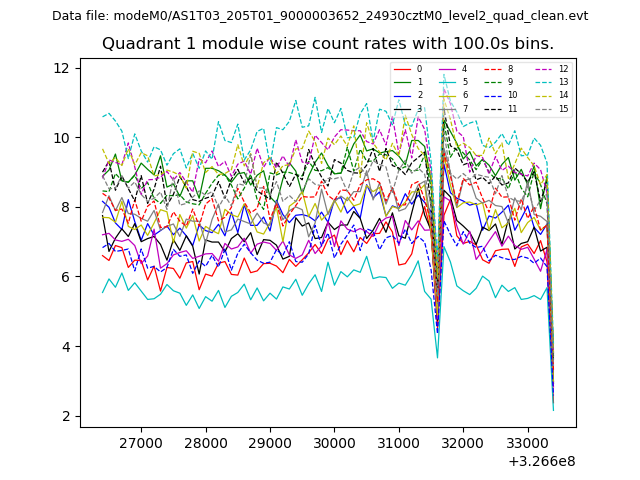
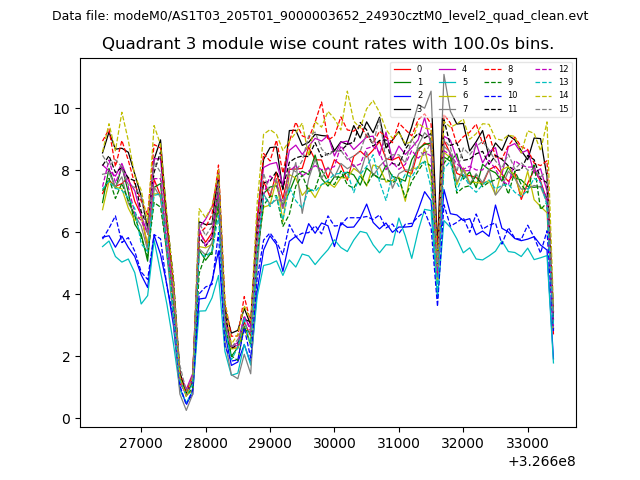
| Module-wise count rates for Quadrant A Data is divided into 100 sec bins |
 |
 |
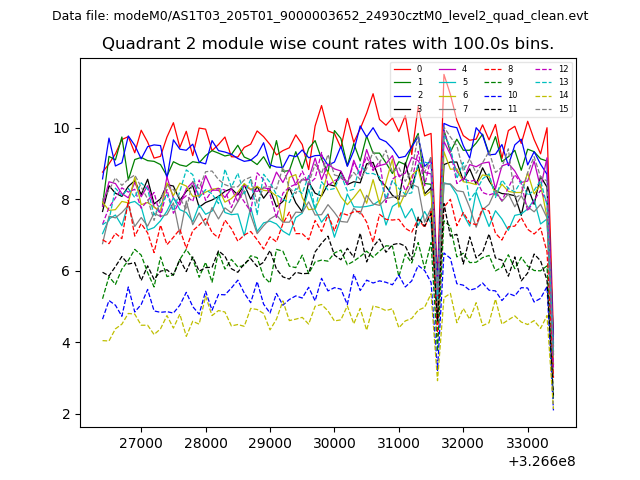
| Module-wise count rates for Quadrant B Data is divided into 100 sec bins |
 |
 |
| Module-wise count rates for Quadrant C Data is divided into 100 sec bins |
 |
 |
| Module-wise count rates for Quadrant D Data is divided into 100 sec bins |
 |
 |
| Parameter | Plot |
|---|---|
| CZT HV Monitor | 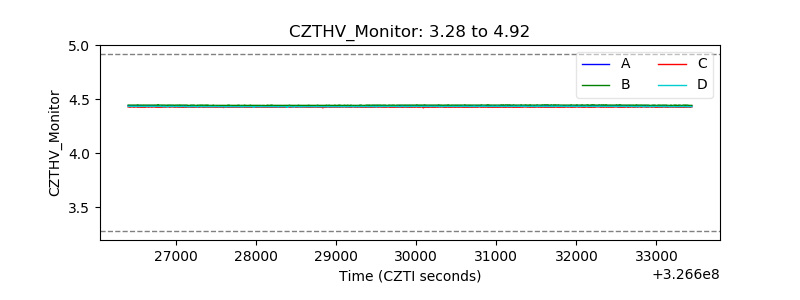 |
| D_VDD | 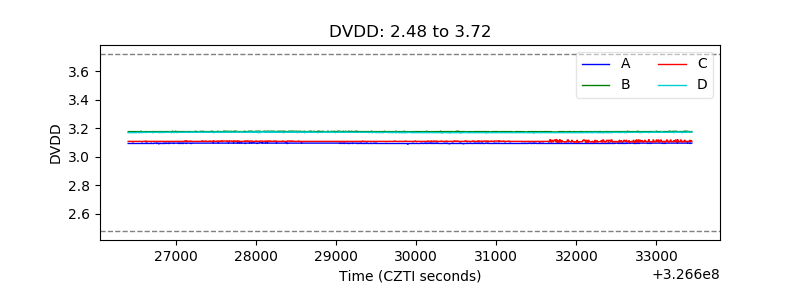 |
| Temperature 1 | 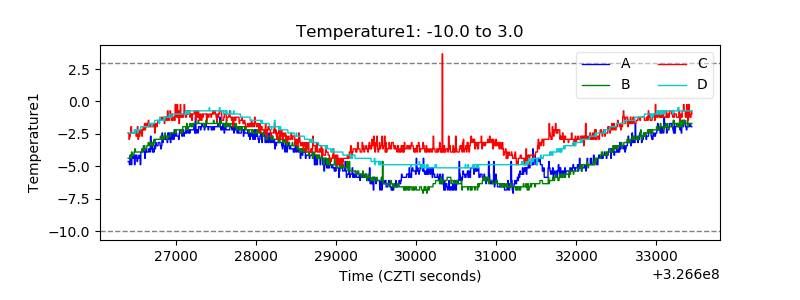 |
| Veto HV Monitor |  |
| Veto LLD | 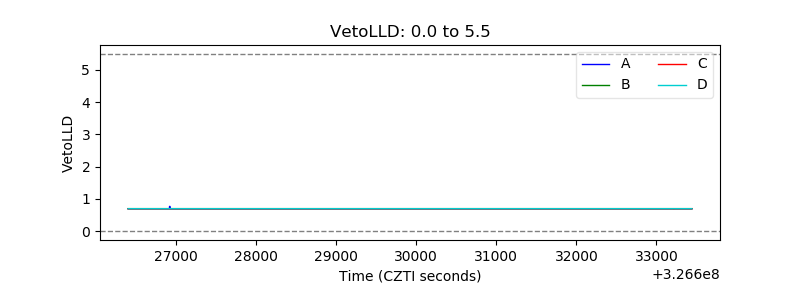 |
| Alpha Counter | 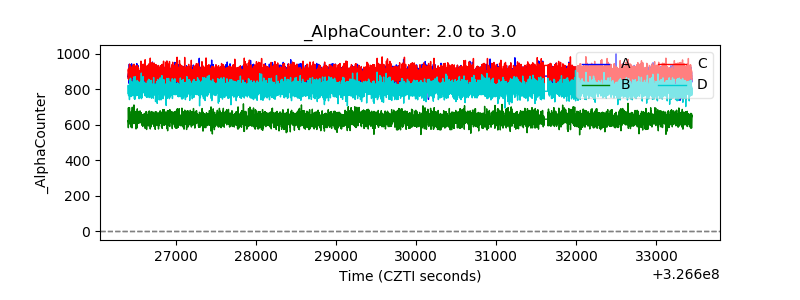 |
| _CPM_Rate | 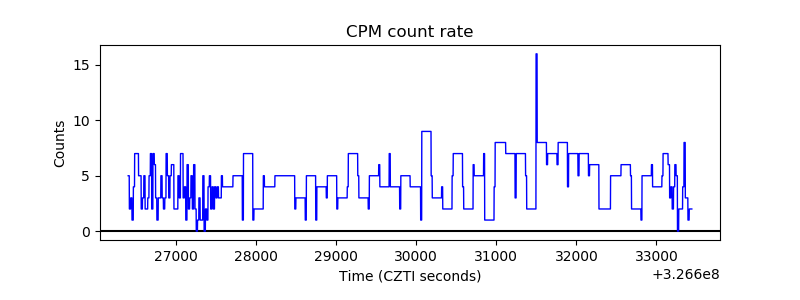 |
| CZT Counter |  |
| +2.5 Volts monitor |  |
| +5 Volts monitor |  |
| _ROLL_ROT | 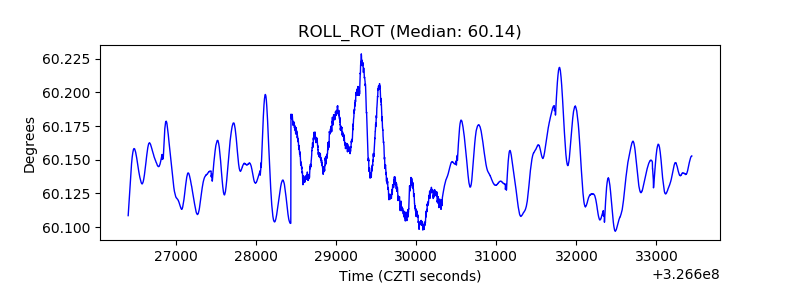 |
| _Roll_DEC | 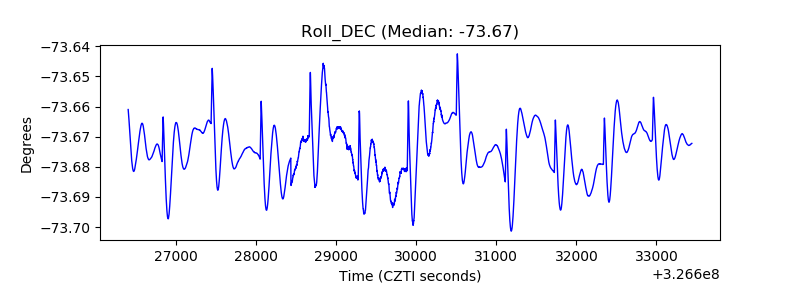 |
| _Roll_RA | 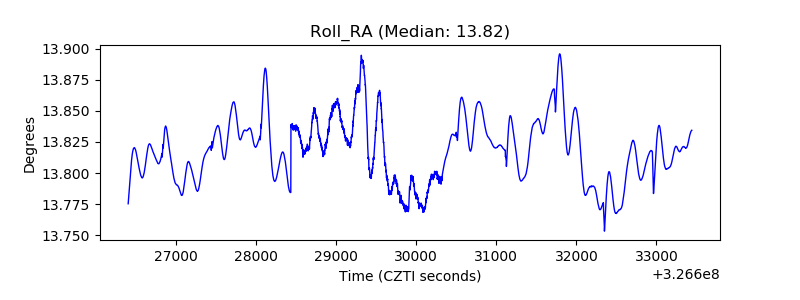 |
| Veto Counter | 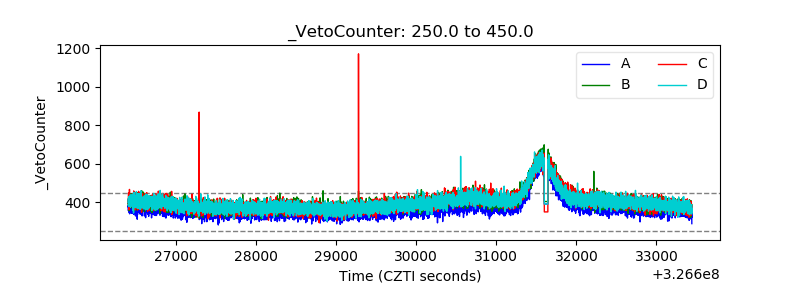 |