| Param | Original file | Final file |
|---|---|---|
| Filename | modeM0/AS1T03_205T01_9000003652_24931cztM0_level2.evt | modeM0/AS1T03_205T01_9000003652_24931cztM0_level2_quad_clean.evt |
| Size (bytes) | 548,735,040 | 143,161,920 |
| Size | 523.3 MB | 136.5 MB |
| Events in quadrant A | 3,529,707 | 966,129 |
| Events in quadrant B | 3,651,761 | 977,361 |
| Events in quadrant C | 4,347,750 | 937,491 |
| Events in quadrant D | 4,573,436 | 926,255 |
| Mode SS | |||
|---|---|---|---|
| Quadrant | BADHDUFLAG | Total packets | Discarded packets |
| A | 0 | 154 | 0 |
| B | 0 | 154 | 0 |
| C | 0 | 154 | 0 |
| D | 0 | 154 | 0 |
| Mode M9 | |||
|---|---|---|---|
| Quadrant | BADHDUFLAG | Total packets | Discarded packets |
| A | 0 | 2 | 0 |
| B | 0 | 2 | 0 |
| C | 0 | 2 | 0 |
| D | 0 | 2 | 0 |
| Mode M0 | |||
|---|---|---|---|
| Quadrant | BADHDUFLAG | Total packets | Discarded packets |
| A | 0 | 15558 | 2 |
| B | 0 | 15790 | 2 |
| C | 0 | 17878 | 2 |
| D | 0 | 18479 | 2 |
| Quadrant | Total seconds | Saturated seconds | Saturation percentage |
|---|---|---|---|
| A | 7601 | 155 | 2.039205% |
| B | 7601 | 176 | 2.315485% |
| C | 7600 | 224 | 2.947368% |
| D | 7601 | 270 | 3.552164% |
Noise dominated data is calculated using 1-second bins in cleaned event files. If a bin has >2000 counts, and if more than 50% of those come from <1% of pixels, then it is considered to be noise-dominated and hence unusable.
| Quadrant | # 1 sec bins | Bins with >0 counts | Bins with >2000 counts | High rate bins dominated by noise | Noise dominated (total time) | Noise dominated (detector-on time) | Marked lightcurve |
|---|---|---|---|---|---|---|---|
| A | 7846 | 7603 | 0 | 0 | 0.00% | 0.00% | 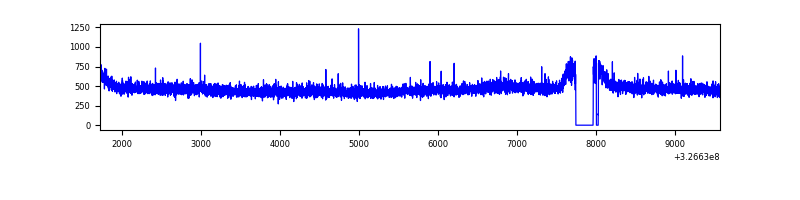 |
| B | 7846 | 7603 | 2 | 2 | 0.03% | 0.03% | 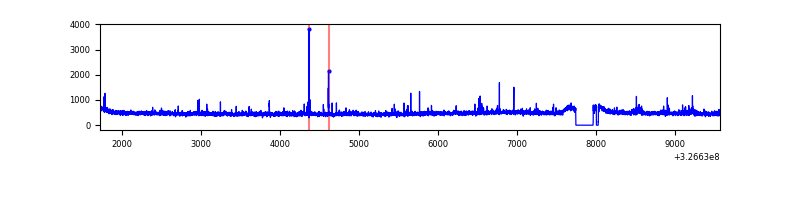 |
| C | 7845 | 7602 | 0 | 0 | 0.00% | 0.00% | 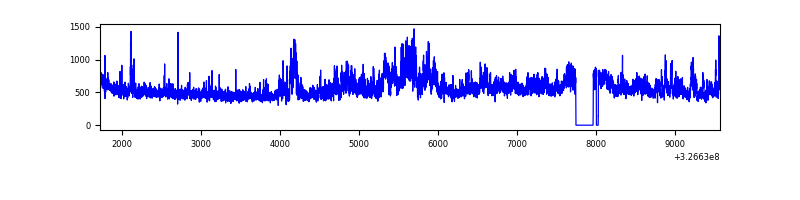 |
| D | 7846 | 7603 | 136 | 136 | 1.73% | 1.79% | 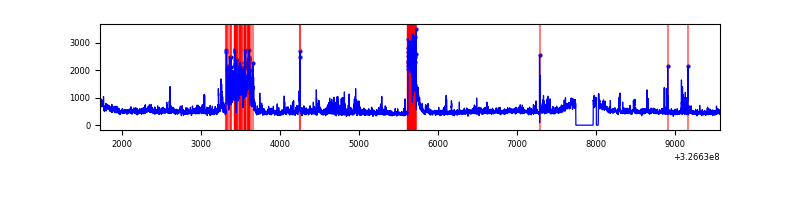 |
Top three noisy pixels from each quadrant. If the there are fewer than three noisy pixels in the level2.evt file, extra rows are filled as -1
| Pixel properties | Quadrant properties | ||||||
|---|---|---|---|---|---|---|---|
| Quadrant | DetID | PixID | Counts | Sigma | Mean | Median | Sigma |
| A | 13 | 254 | 12412 | 63.65 | 913 | 892 | 181.0 |
| A | 3 | 137 | 8403 | 41.5 | 913 | 892 | 181.0 |
| A | 0 | 226 | 7826 | 38.31 | 913 | 892 | 181.0 |
| B | 0 | 230 | 32680 | 184.86 | 902 | 876 | 172.0 |
| B | 0 | 190 | 22926 | 128.16 | 902 | 876 | 172.0 |
| B | 12 | 111 | 21284 | 118.62 | 902 | 876 | 172.0 |
| C | 7 | 247 | 721724 | 3517.27 | 877 | 882 | 204.9 |
| C | 14 | 238 | 139408 | 675.92 | 877 | 882 | 204.9 |
| C | 2 | 16 | 37898 | 180.62 | 877 | 882 | 204.9 |
| D | 7 | 238 | 641386 | 2980.52 | 892 | 865 | 214.9 |
| D | 1 | 52 | 283194 | 1313.76 | 892 | 865 | 214.9 |
| D | 8 | 195 | 175370 | 812.02 | 892 | 865 | 214.9 |
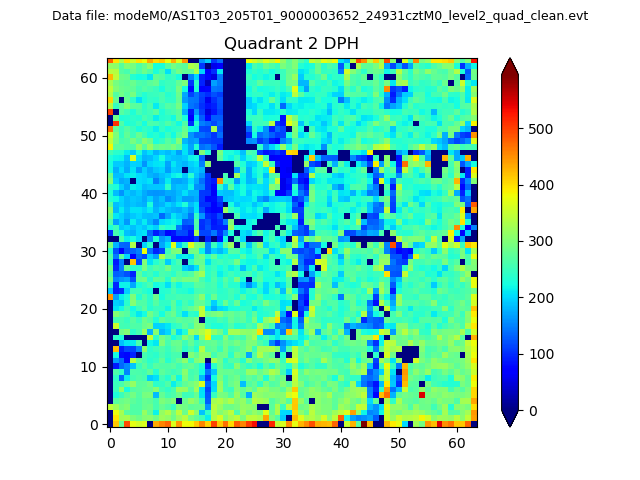
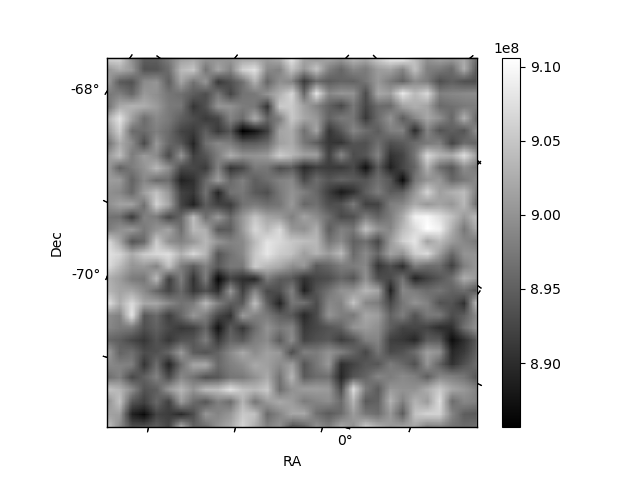
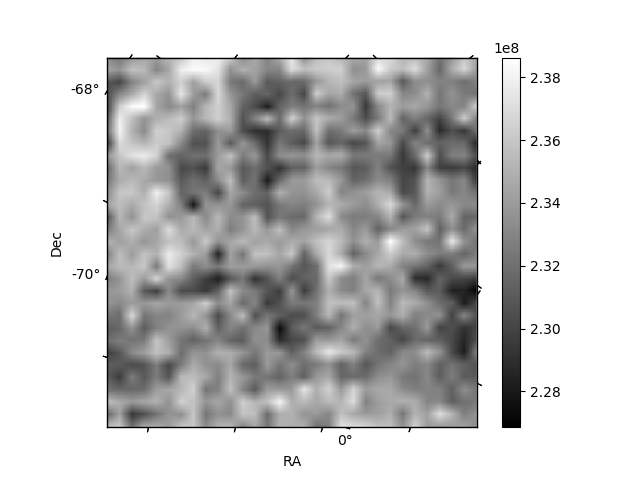
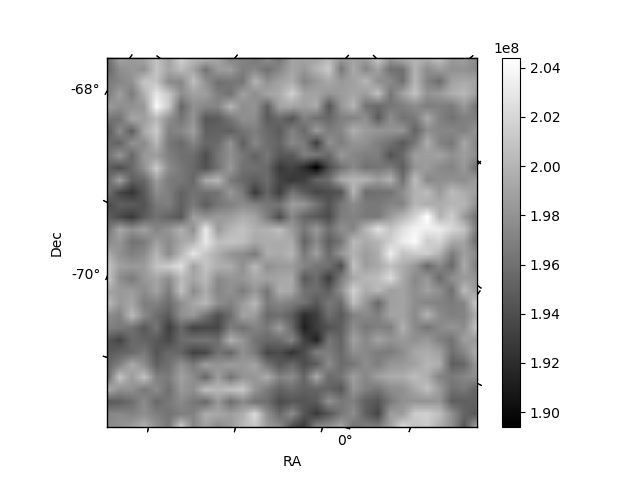
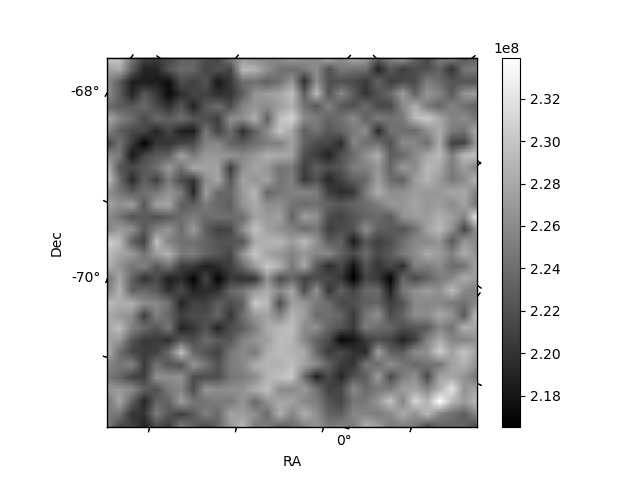
Histogram calculated using DETX and DETY for each event in the final _common_clean file
| Quadrant A | 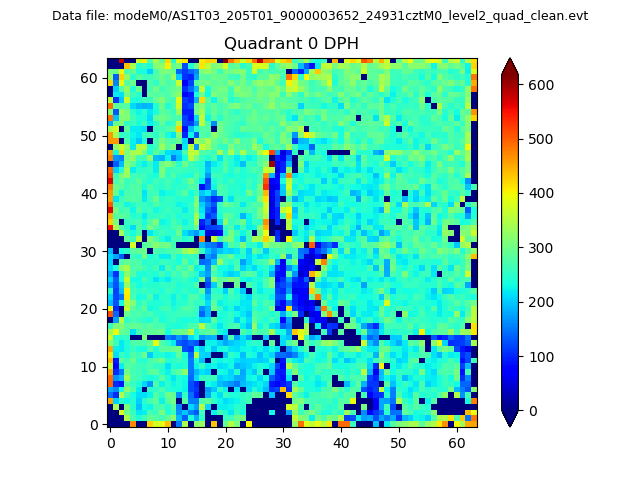 |
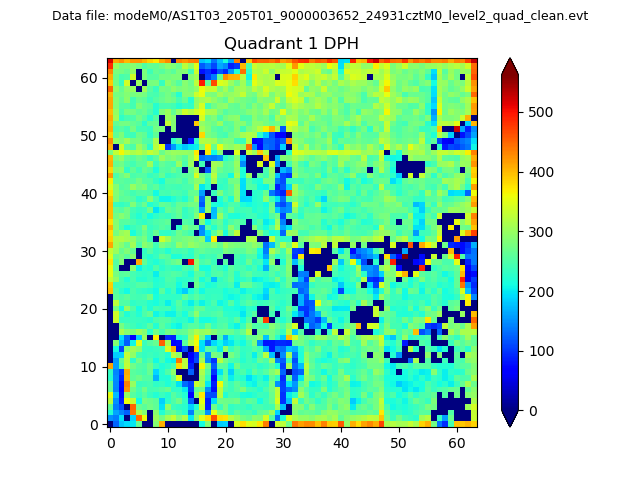 |
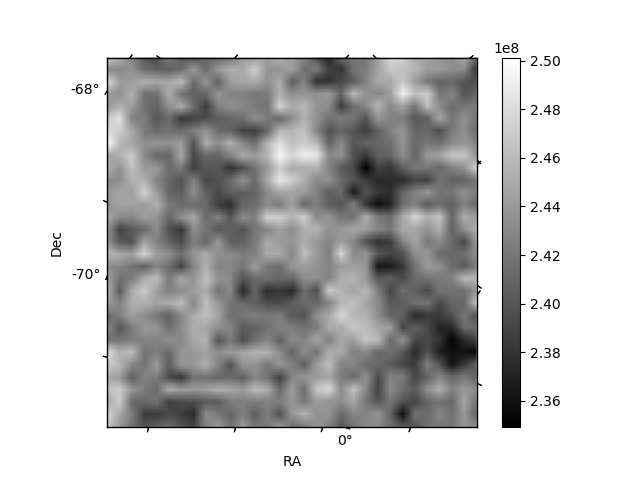
Quadrant B |
|---|---|---|---|
| Quadrant D | 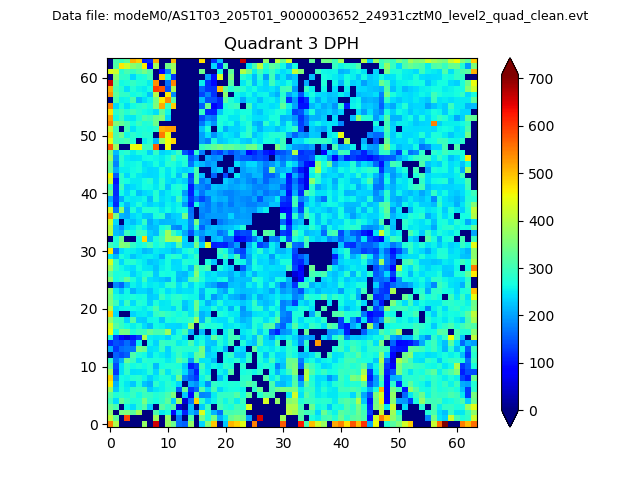 |
 |
Quadrant C |
| Plot type | Count rate plots | Images |
|---|---|---|
| Comparison with Poisson distribution Blue bars denote a histogram of data divided into 1 sec bins. Red curve is a Poisson curve with rate = median count rate of data. |
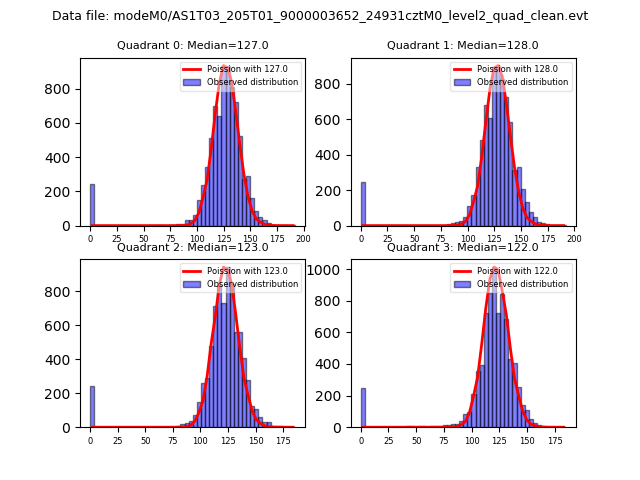 |
 |
| Quadrant-wise count rates Data is divided into 100 sec bins |
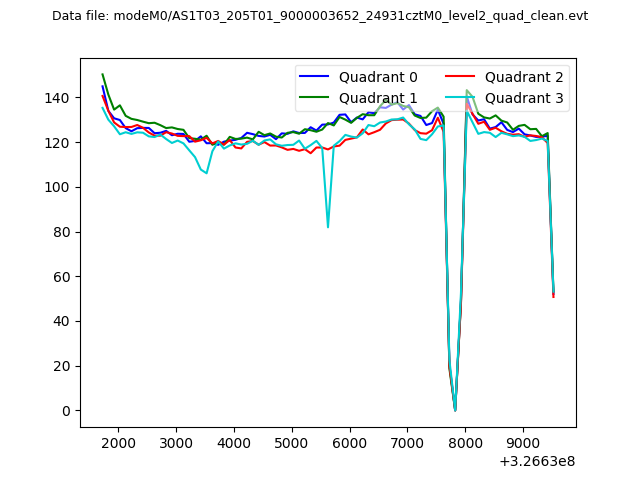 |
|
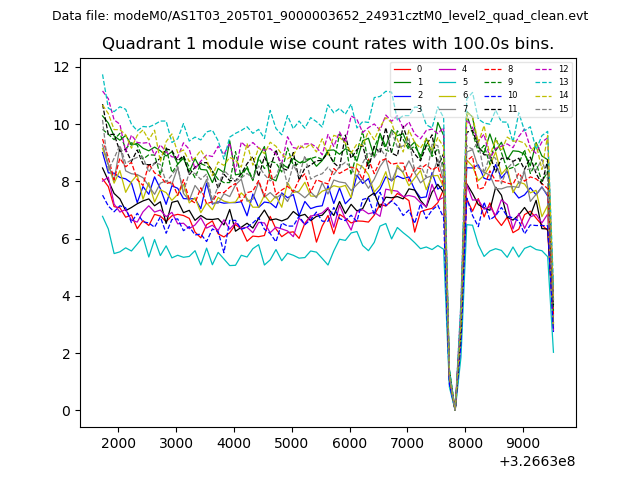
| Module-wise count rates for Quadrant A Data is divided into 100 sec bins |
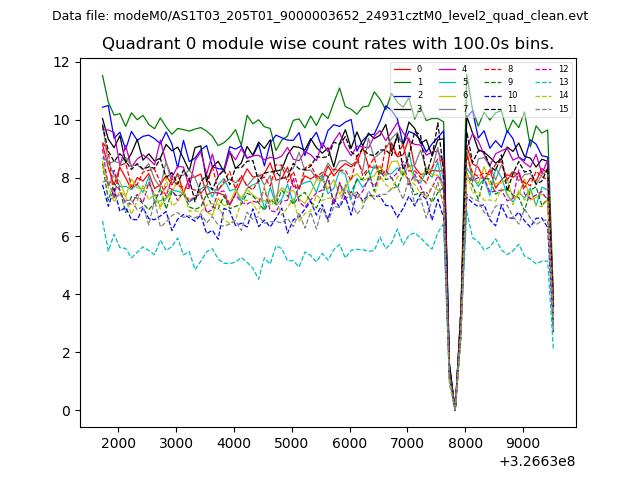 |
 |
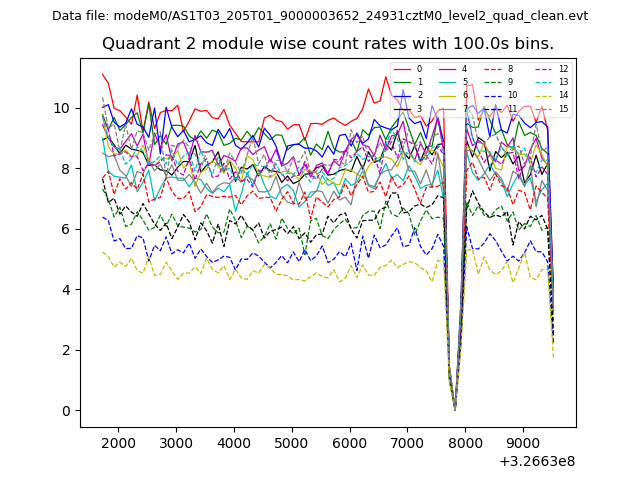
| Module-wise count rates for Quadrant B Data is divided into 100 sec bins |
 |
 |
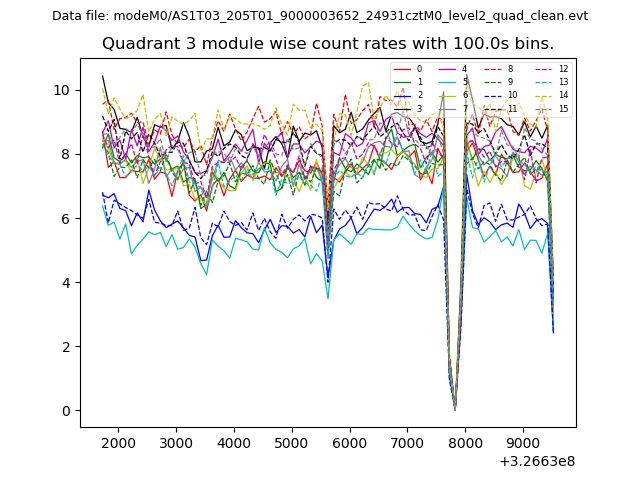
| Module-wise count rates for Quadrant C Data is divided into 100 sec bins |
 |
 |
| Module-wise count rates for Quadrant D Data is divided into 100 sec bins |
 |
 |
| Parameter | Plot |
|---|---|
| CZT HV Monitor | 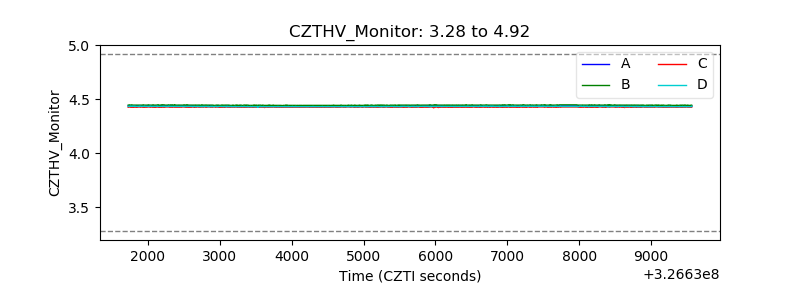 |
| D_VDD | 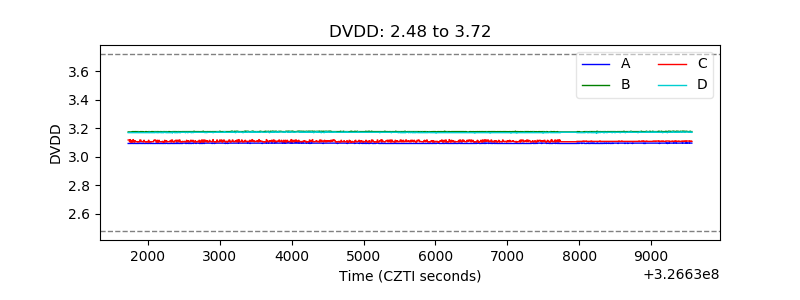 |
| Temperature 1 | 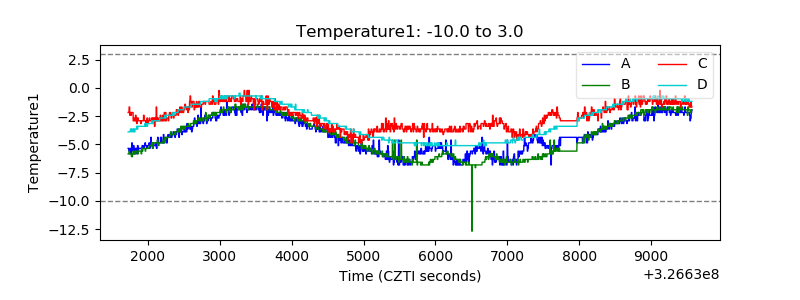 |
| Veto HV Monitor |  |
| Veto LLD | 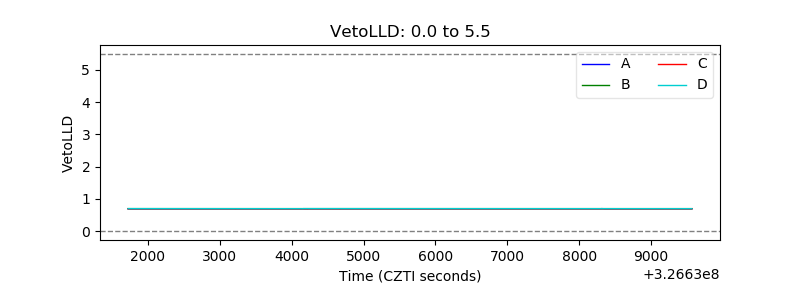 |
| Alpha Counter | 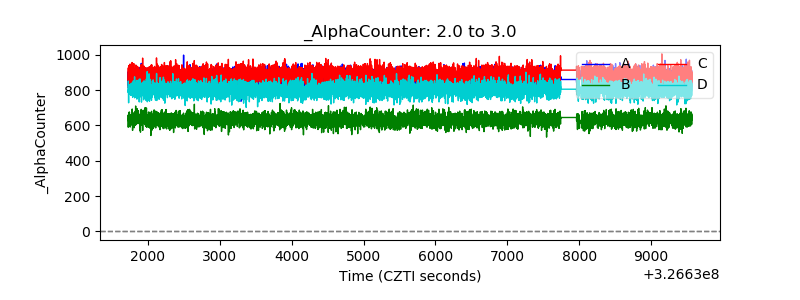 |
| _CPM_Rate | 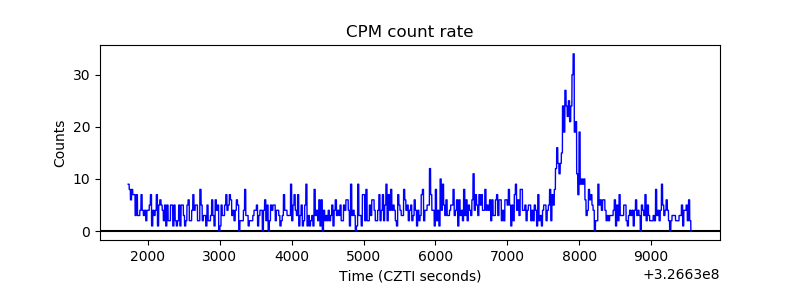 |
| CZT Counter | 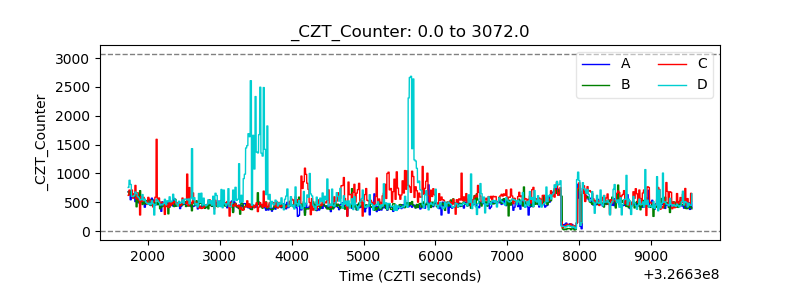 |
| +2.5 Volts monitor | 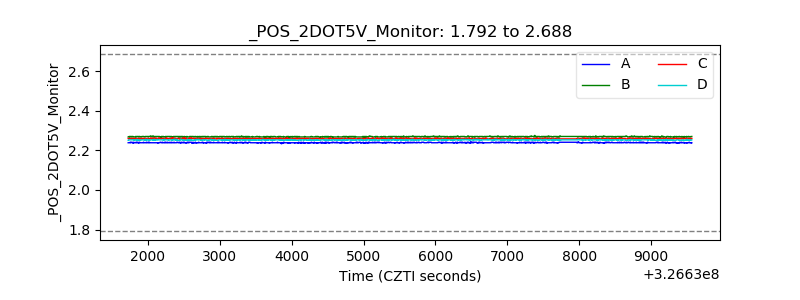 |
| +5 Volts monitor |  |
| _ROLL_ROT | 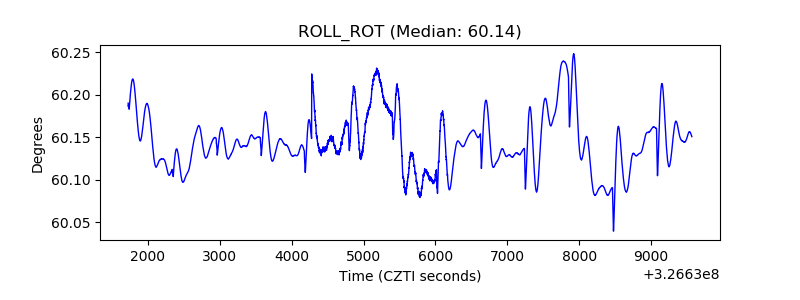 |
| _Roll_DEC | 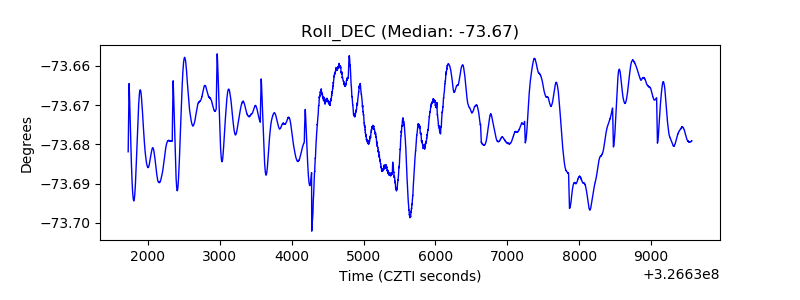 |
| _Roll_RA | 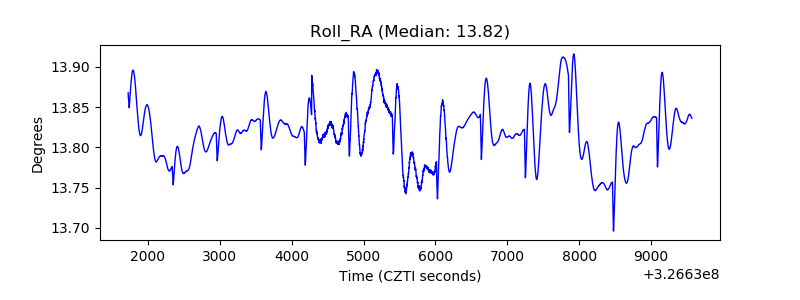 |
| Veto Counter | 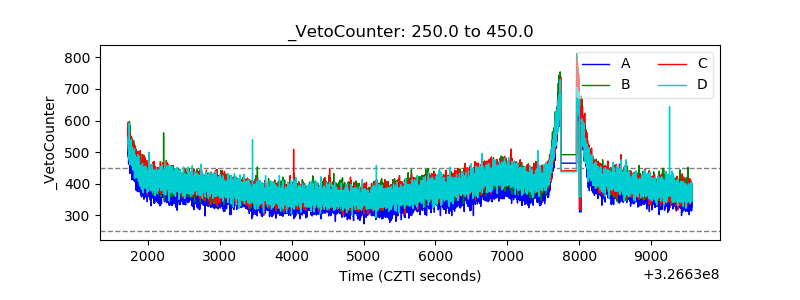 |