| Param | Original file | Final file |
|---|---|---|
| Filename | modeM0/AS1T03_205T01_9000003652_24933cztM0_level2.evt | modeM0/AS1T03_205T01_9000003652_24933cztM0_level2_quad_clean.evt |
| Size (bytes) | 870,773,760 | 237,816,000 |
| Size | 830.4 MB | 226.8 MB |
| Events in quadrant A | 5,808,141 | 1,610,592 |
| Events in quadrant B | 6,019,046 | 1,622,680 |
| Events in quadrant C | 6,903,449 | 1,553,197 |
| Events in quadrant D | 6,782,163 | 1,540,564 |
| Mode SS | |||
|---|---|---|---|
| Quadrant | BADHDUFLAG | Total packets | Discarded packets |
| A | 0 | 256 | 0 |
| B | 0 | 256 | 0 |
| C | 0 | 256 | 0 |
| D | 0 | 256 | 0 |
| Mode M9 | |||
|---|---|---|---|
| Quadrant | BADHDUFLAG | Total packets | Discarded packets |
| A | 0 | 12 | 0 |
| B | 0 | 12 | 0 |
| C | 0 | 12 | 0 |
| D | 0 | 12 | 0 |
| Mode M0 | |||
|---|---|---|---|
| Quadrant | BADHDUFLAG | Total packets | Discarded packets |
| A | 0 | 25717 | 2 |
| B | 0 | 26162 | 2 |
| C | 0 | 28521 | 2 |
| D | 0 | 28308 | 2 |
| Quadrant | Total seconds | Saturated seconds | Saturation percentage |
|---|---|---|---|
| A | 12687 | 82 | 0.646331% |
| B | 12687 | 110 | 0.867029% |
| C | 12687 | 174 | 1.371483% |
| D | 12687 | 202 | 1.592181% |
Noise dominated data is calculated using 1-second bins in cleaned event files. If a bin has >2000 counts, and if more than 50% of those come from <1% of pixels, then it is considered to be noise-dominated and hence unusable.
| Quadrant | # 1 sec bins | Bins with >0 counts | Bins with >2000 counts | High rate bins dominated by noise | Noise dominated (total time) | Noise dominated (detector-on time) | Marked lightcurve |
|---|---|---|---|---|---|---|---|
| A | 13877 | 12688 | 0 | 0 | 0.00% | 0.00% | 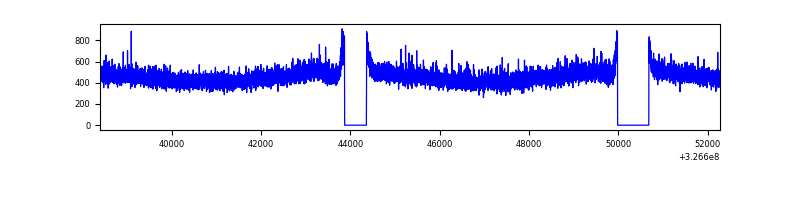 |
| B | 13877 | 12688 | 5 | 5 | 0.04% | 0.04% | 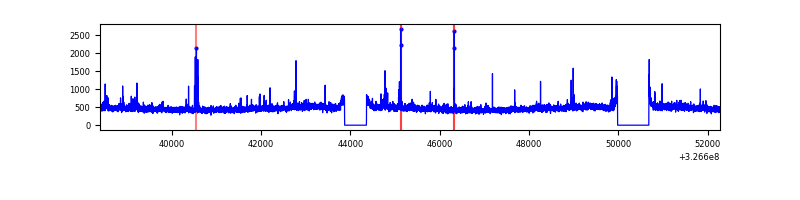 |
| C | 13877 | 12688 | 3 | 3 | 0.02% | 0.02% | 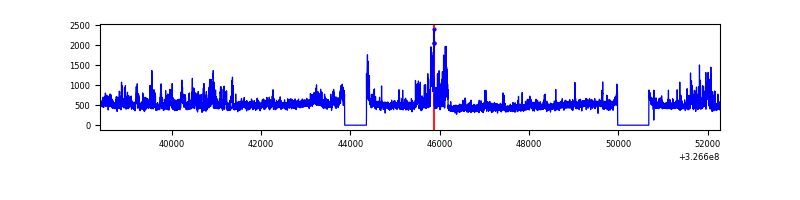 |
| D | 13877 | 12688 | 84 | 84 | 0.61% | 0.66% | 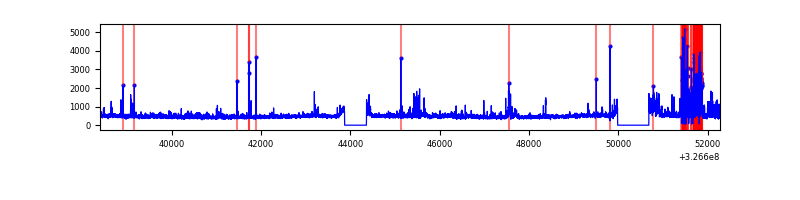 |
Top three noisy pixels from each quadrant. If the there are fewer than three noisy pixels in the level2.evt file, extra rows are filled as -1
| Pixel properties | Quadrant properties | ||||||
|---|---|---|---|---|---|---|---|
| Quadrant | DetID | PixID | Counts | Sigma | Mean | Median | Sigma |
| A | 13 | 254 | 19974 | 61.4 | 1504 | 1468 | 301.4 |
| A | 3 | 137 | 14032 | 41.69 | 1504 | 1468 | 301.4 |
| A | 0 | 226 | 12769 | 37.5 | 1504 | 1468 | 301.4 |
| B | 12 | 111 | 35308 | 120.1 | 1488 | 1448 | 281.9 |
| B | 4 | 216 | 34707 | 117.97 | 1488 | 1448 | 281.9 |
| B | 15 | 33 | 33583 | 113.98 | 1488 | 1448 | 281.9 |
| C | 7 | 247 | 1062924 | 3194.25 | 1434 | 1443 | 332.3 |
| C | 14 | 238 | 227283 | 679.6 | 1434 | 1443 | 332.3 |
| C | 2 | 16 | 11849 | 31.31 | 1434 | 1443 | 332.3 |
| D | 1 | 52 | 564554 | 1609.72 | 1455 | 1411 | 349.8 |
| D | 8 | 195 | 265234 | 754.13 | 1455 | 1411 | 349.8 |
| D | 7 | 238 | 142793 | 404.13 | 1455 | 1411 | 349.8 |
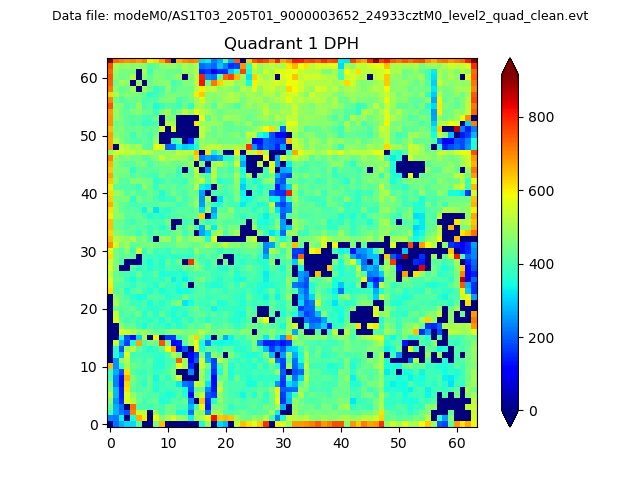
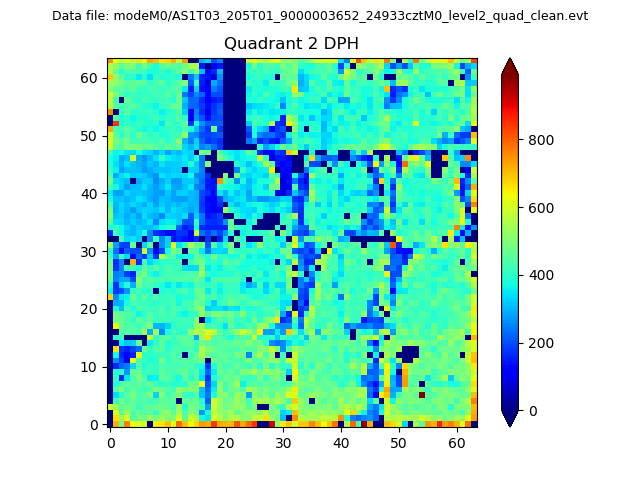
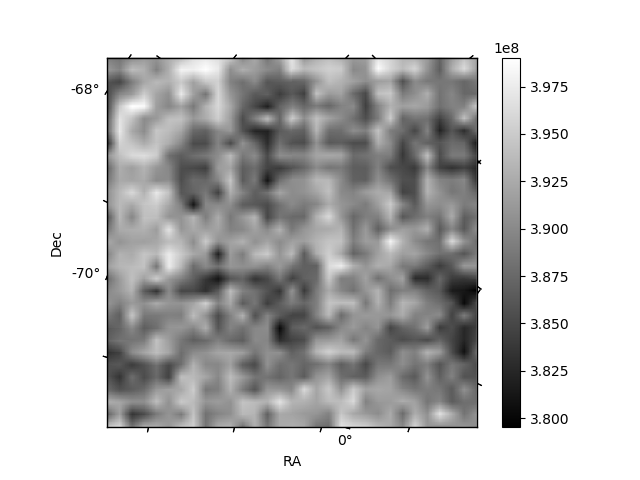
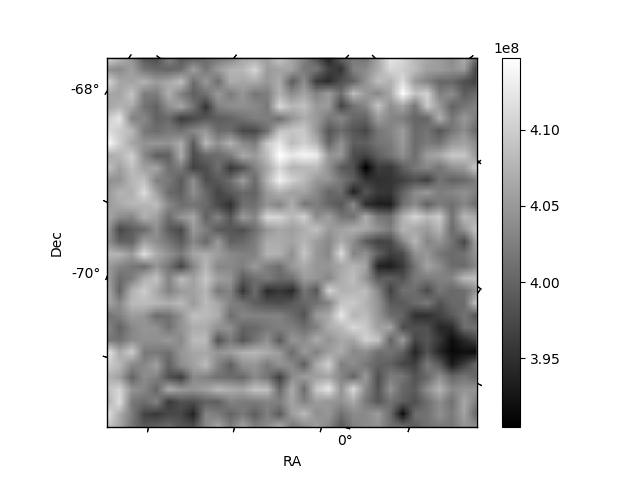
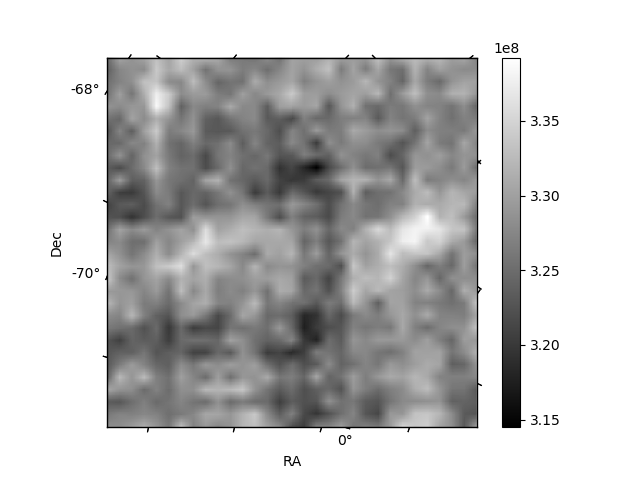
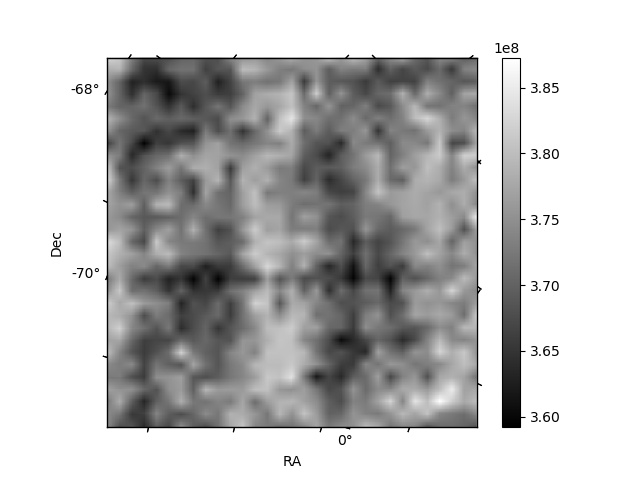
Histogram calculated using DETX and DETY for each event in the final _common_clean file
| Quadrant A |  |
 |
Quadrant B |
|---|---|---|---|
| Quadrant D |  |
 |
Quadrant C |
| Plot type | Count rate plots | Images |
|---|---|---|
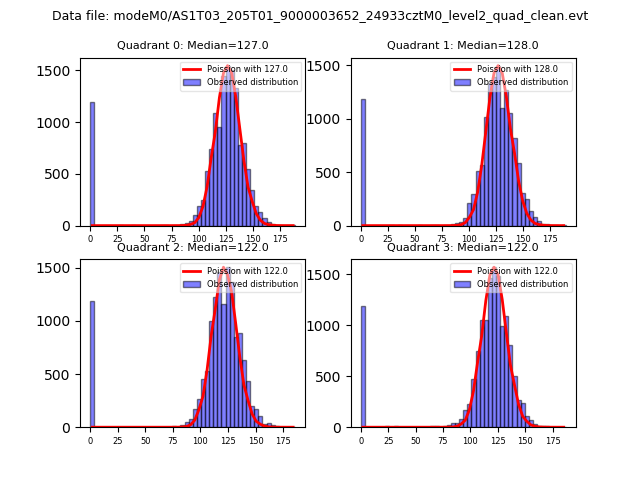
| Comparison with Poisson distribution Blue bars denote a histogram of data divided into 1 sec bins. Red curve is a Poisson curve with rate = median count rate of data. |
 |
 |
| Quadrant-wise count rates Data is divided into 100 sec bins |
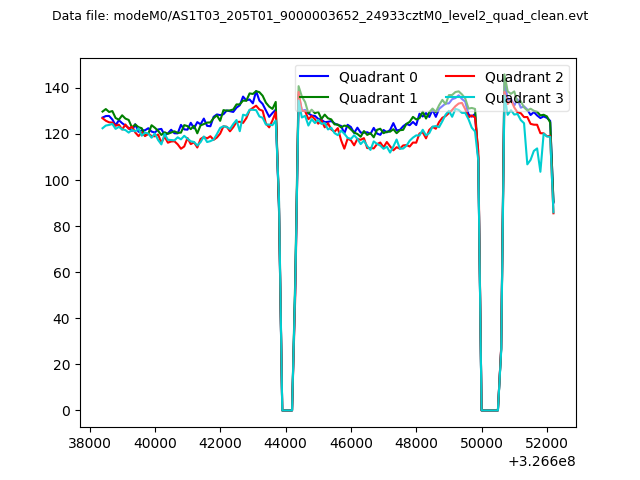 |
|
| Module-wise count rates for Quadrant A Data is divided into 100 sec bins |
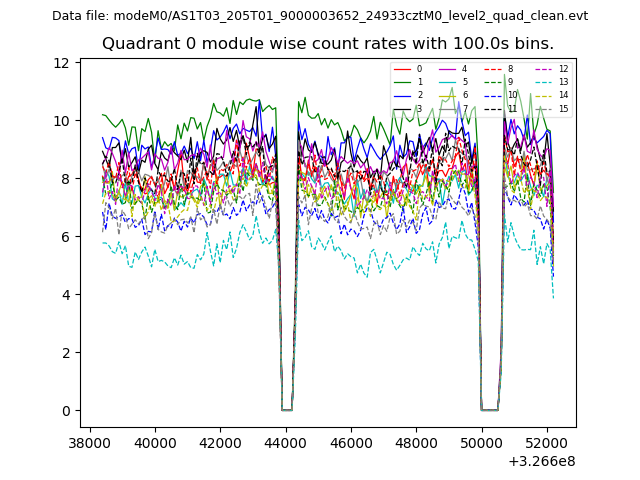 |
 |
| Module-wise count rates for Quadrant B Data is divided into 100 sec bins |
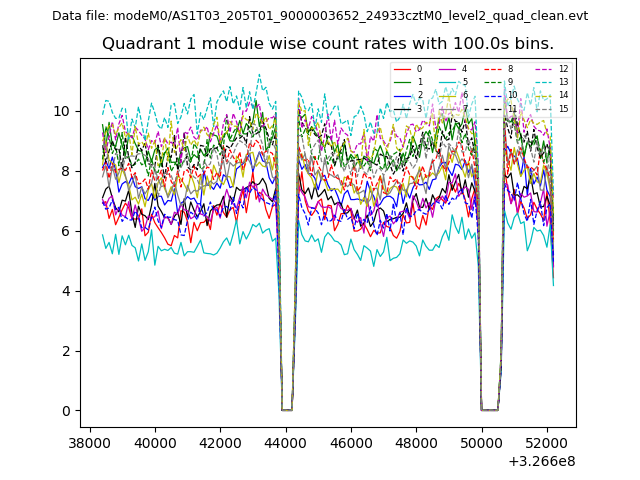 |
 |
| Module-wise count rates for Quadrant C Data is divided into 100 sec bins |
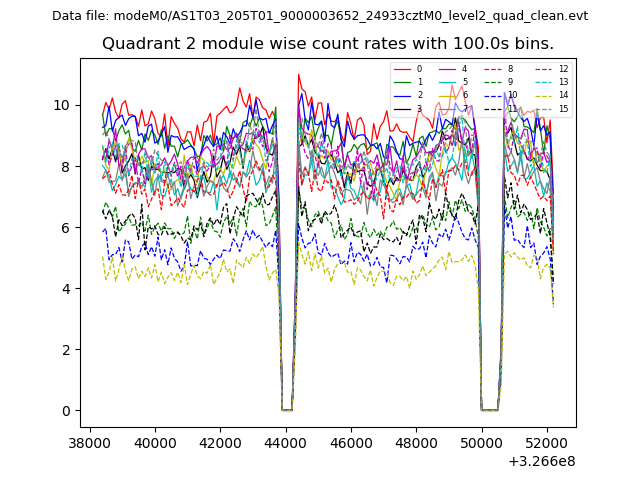 |
 |
| Module-wise count rates for Quadrant D Data is divided into 100 sec bins |
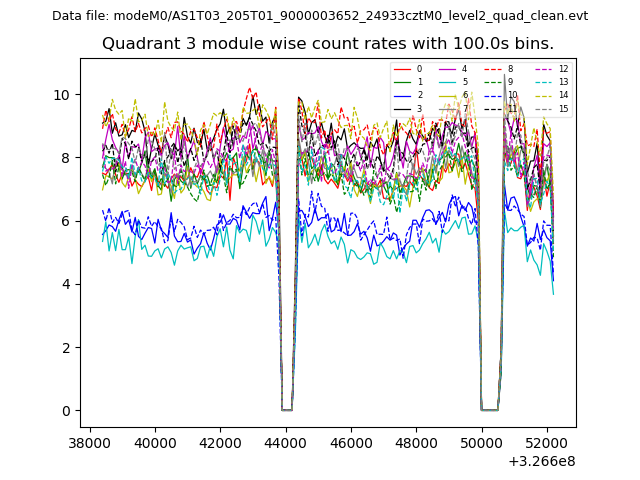 |
 |
| Parameter | Plot |
|---|---|
| CZT HV Monitor | 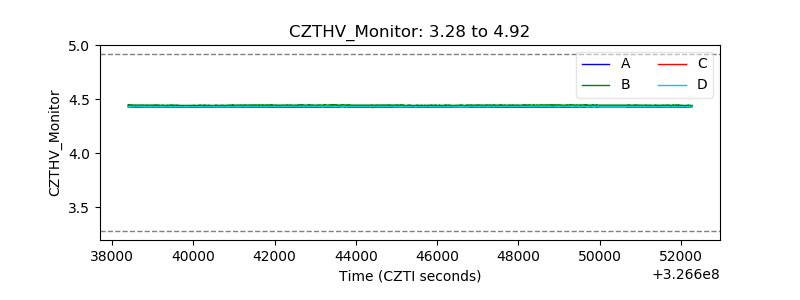 |
| D_VDD | 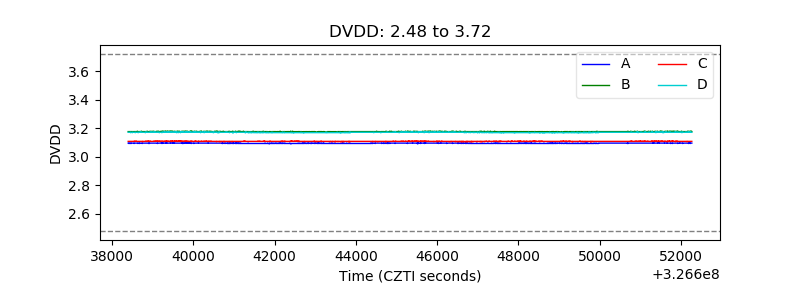 |
| Temperature 1 | 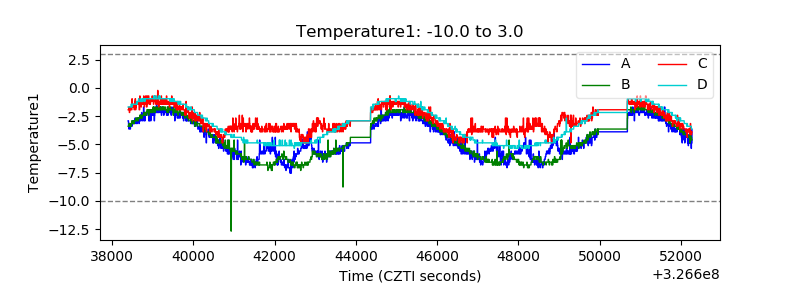 |
| Veto HV Monitor | 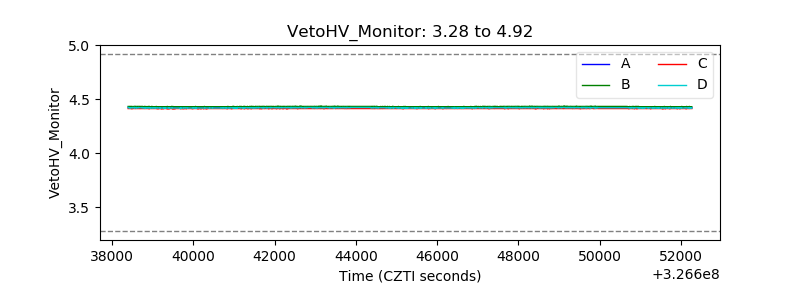 |
| Veto LLD | 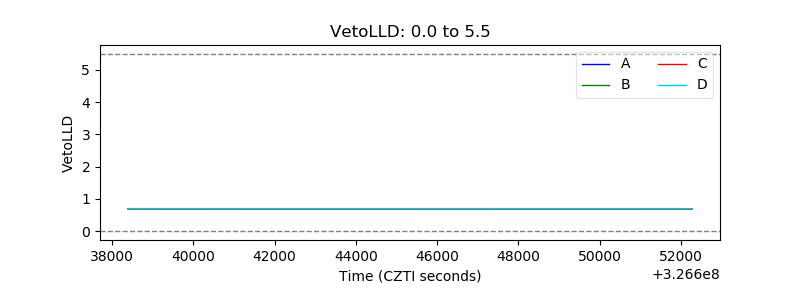 |
| Alpha Counter | 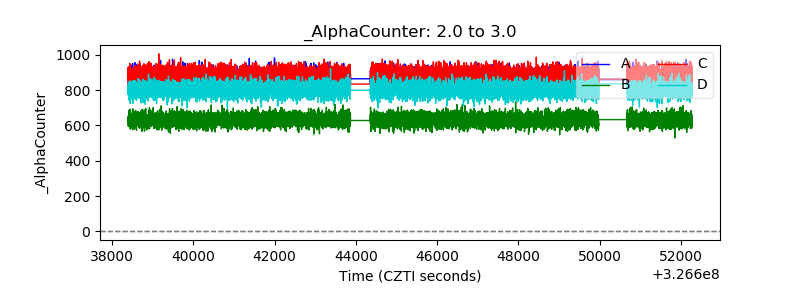 |
| _CPM_Rate | 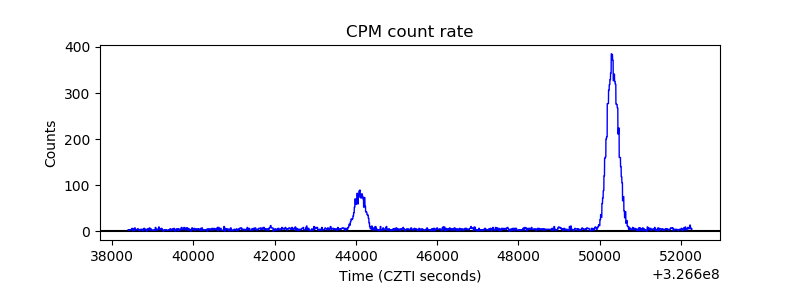 |
| CZT Counter | 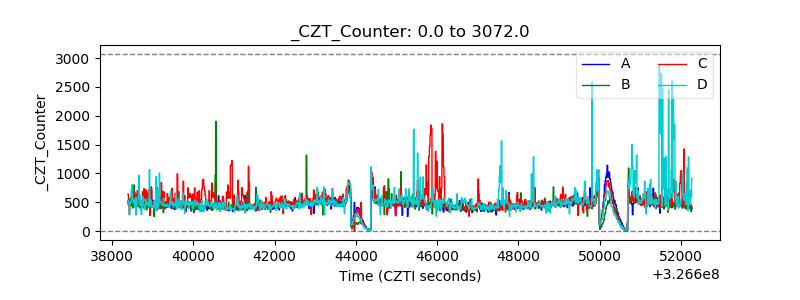 |
| +2.5 Volts monitor | 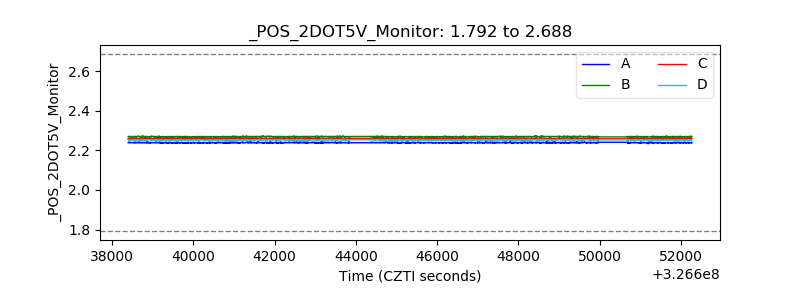 |
| +5 Volts monitor | 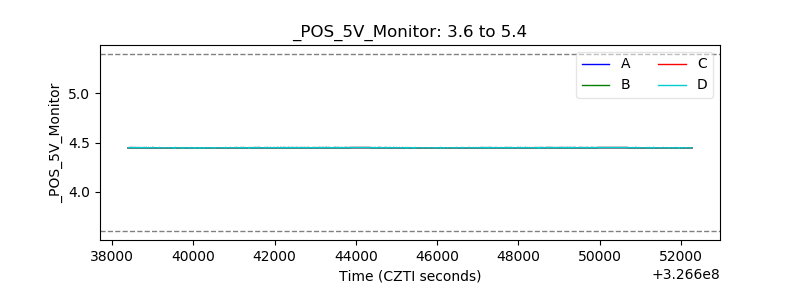 |
| _ROLL_ROT | 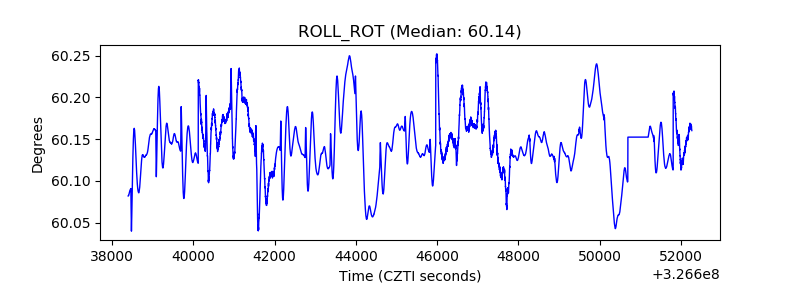 |
| _Roll_DEC | 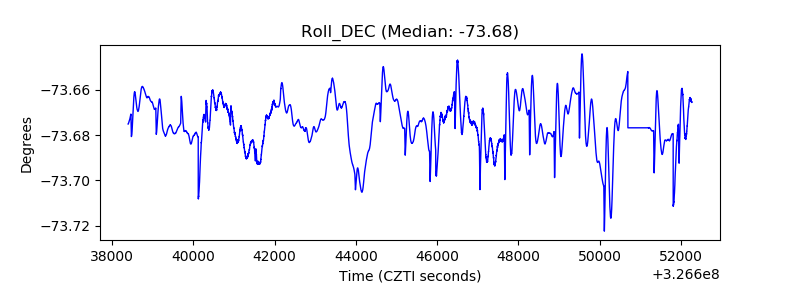 |
| _Roll_RA | 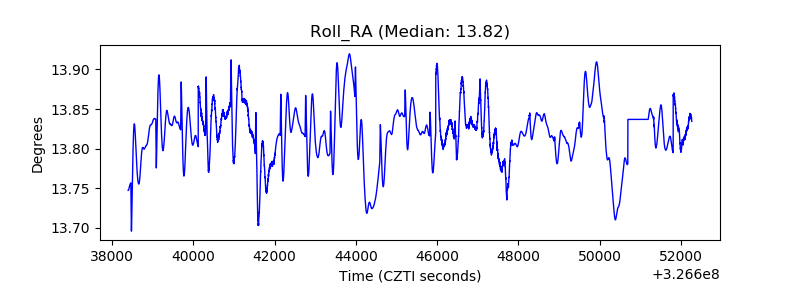 |
| Veto Counter | 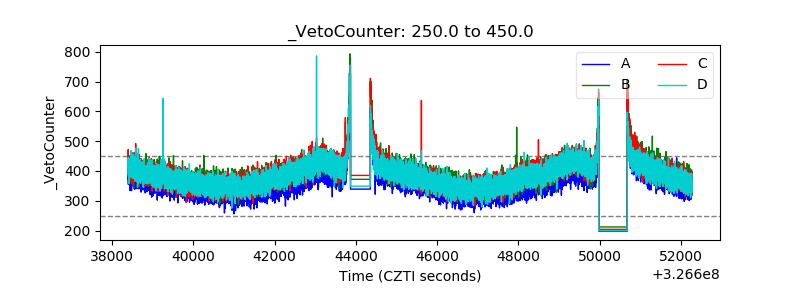 |