| Param | Original file | Final file |
|---|---|---|
| Filename | modeM0/AS1T03_205T01_9000003652_24934cztM0_level2.evt | modeM0/AS1T03_205T01_9000003652_24934cztM0_level2_quad_clean.evt |
| Size (bytes) | 500,299,200 | 131,489,280 |
| Size | 477.1 MB | 125.4 MB |
| Events in quadrant A | 3,301,643 | 896,369 |
| Events in quadrant B | 3,353,881 | 904,963 |
| Events in quadrant C | 3,805,277 | 856,517 |
| Events in quadrant D | 4,222,682 | 844,355 |
| Mode SS | |||
|---|---|---|---|
| Quadrant | BADHDUFLAG | Total packets | Discarded packets |
| A | 0 | 140 | 0 |
| B | 0 | 140 | 0 |
| C | 0 | 140 | 0 |
| D | 0 | 140 | 0 |
| Mode M9 | |||
|---|---|---|---|
| Quadrant | BADHDUFLAG | Total packets | Discarded packets |
| A | 0 | 13 | 0 |
| B | 0 | 14 | 0 |
| C | 0 | 14 | 0 |
| D | 0 | 14 | 0 |
| Mode M0 | |||
|---|---|---|---|
| Quadrant | BADHDUFLAG | Total packets | Discarded packets |
| A | 0 | 14348 | 2 |
| B | 0 | 14408 | 2 |
| C | 0 | 15666 | 2 |
| D | 0 | 17272 | 2 |
| Quadrant | Total seconds | Saturated seconds | Saturation percentage |
|---|---|---|---|
| A | 6896 | 81 | 1.174594% |
| B | 6896 | 57 | 0.826566% |
| C | 6896 | 74 | 1.073086% |
| D | 6896 | 188 | 2.726218% |
Noise dominated data is calculated using 1-second bins in cleaned event files. If a bin has >2000 counts, and if more than 50% of those come from <1% of pixels, then it is considered to be noise-dominated and hence unusable.
| Quadrant | # 1 sec bins | Bins with >0 counts | Bins with >2000 counts | High rate bins dominated by noise | Noise dominated (total time) | Noise dominated (detector-on time) | Marked lightcurve |
|---|---|---|---|---|---|---|---|
| A | 7765 | 6896 | 31 | 31 | 0.40% | 0.45% | 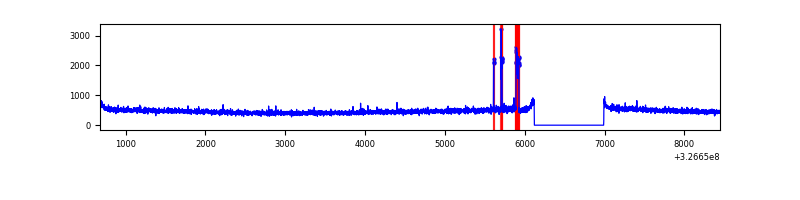 |
| B | 7765 | 6896 | 3 | 3 | 0.04% | 0.04% | 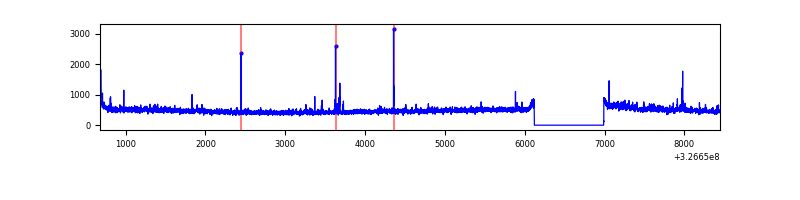 |
| C | 7765 | 6896 | 0 | 0 | 0.00% | 0.00% | 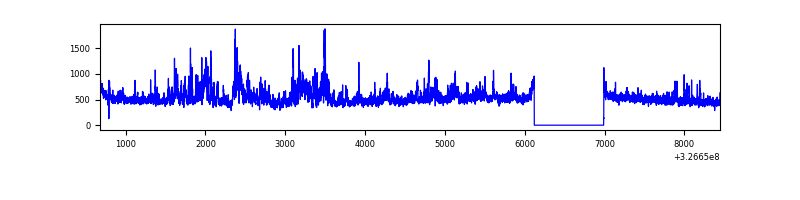 |
| D | 7765 | 6896 | 106 | 106 | 1.37% | 1.54% | 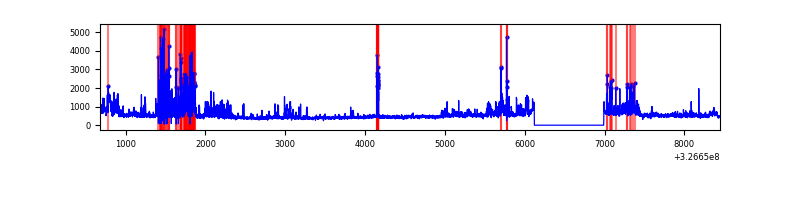 |
Top three noisy pixels from each quadrant. If the there are fewer than three noisy pixels in the level2.evt file, extra rows are filled as -1
| Pixel properties | Quadrant properties | ||||||
|---|---|---|---|---|---|---|---|
| Quadrant | DetID | PixID | Counts | Sigma | Mean | Median | Sigma |
| A | 15 | 223 | 75197 | 444.74 | 829 | 810 | 167.3 |
| A | 15 | 239 | 26406 | 153.03 | 829 | 810 | 167.3 |
| A | 13 | 254 | 11182 | 62.01 | 829 | 810 | 167.3 |
| B | 0 | 230 | 32092 | 200.66 | 822 | 803 | 155.9 |
| B | 10 | 251 | 30840 | 192.63 | 822 | 803 | 155.9 |
| B | 0 | 229 | 30572 | 190.91 | 822 | 803 | 155.9 |
| C | 7 | 247 | 612038 | 3326.27 | 786 | 789 | 183.8 |
| C | 14 | 238 | 125828 | 680.43 | 786 | 789 | 183.8 |
| C | 13 | 61 | 5513 | 25.71 | 786 | 789 | 183.8 |
| D | 1 | 52 | 676036 | 3556.87 | 791 | 766 | 189.8 |
| D | 1 | 239 | 295553 | 1552.74 | 791 | 766 | 189.8 |
| D | 8 | 195 | 108195 | 565.86 | 791 | 766 | 189.8 |
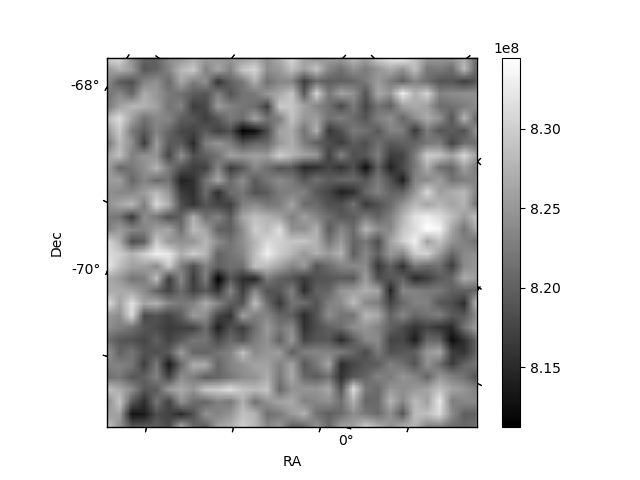
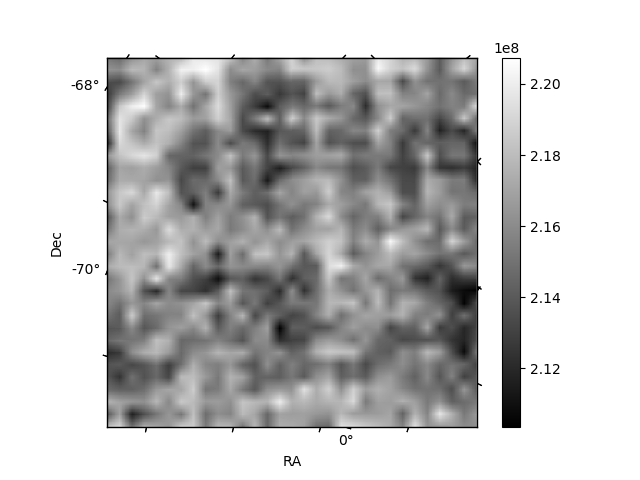
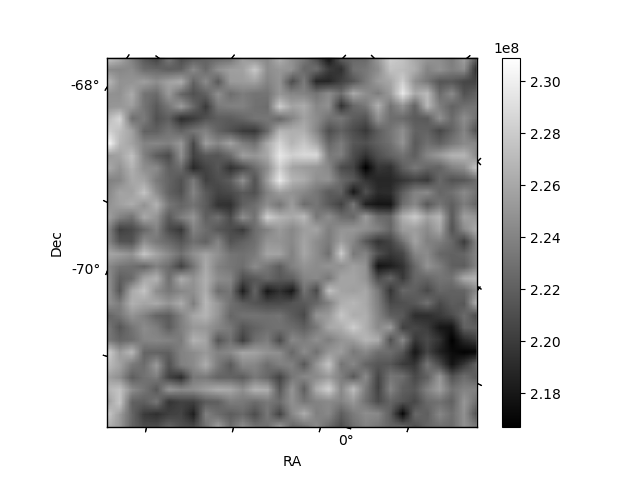
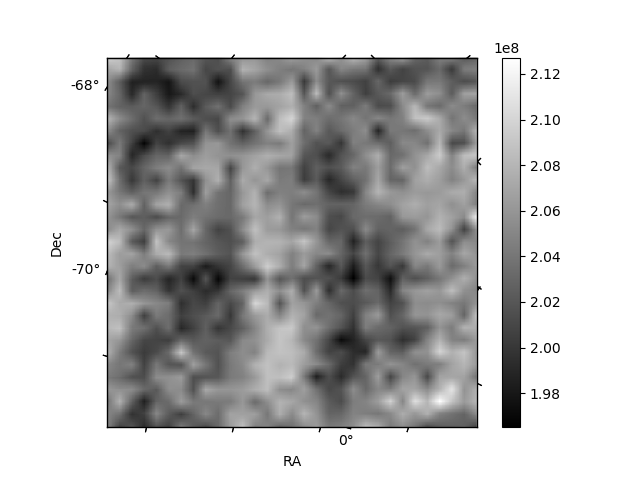
Histogram calculated using DETX and DETY for each event in the final _common_clean file
| Quadrant A | 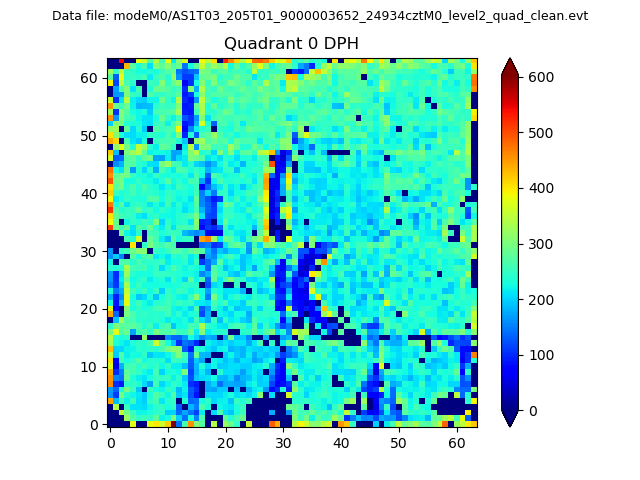 |
 |
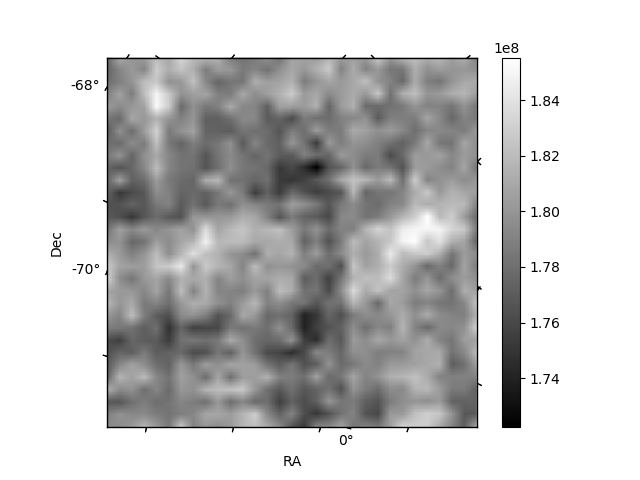
Quadrant B |
|---|---|---|---|
| Quadrant D | 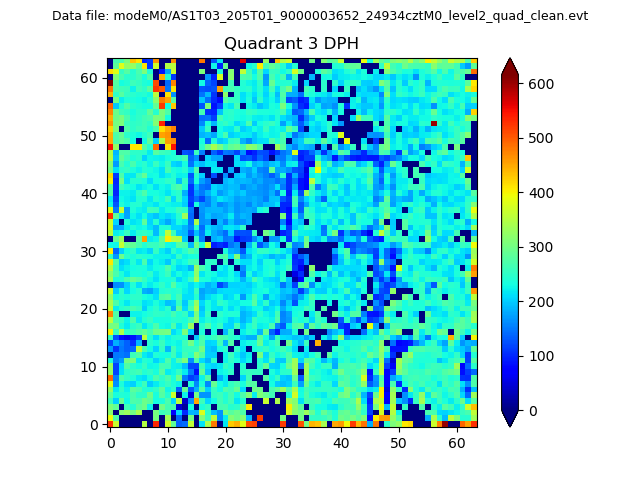 |
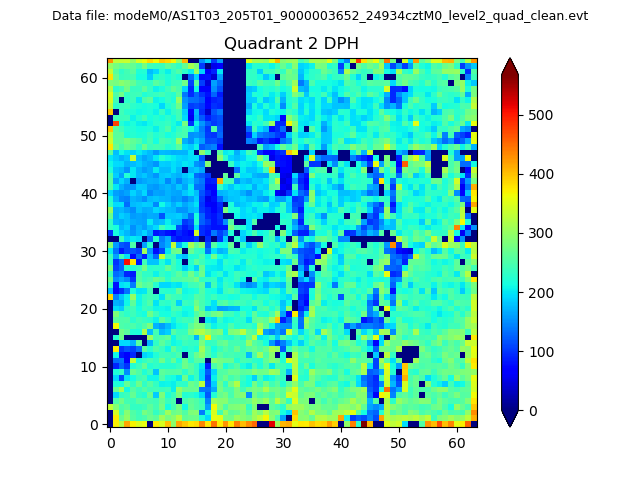 |
Quadrant C |
| Plot type | Count rate plots | Images |
|---|---|---|
| Comparison with Poisson distribution Blue bars denote a histogram of data divided into 1 sec bins. Red curve is a Poisson curve with rate = median count rate of data. |
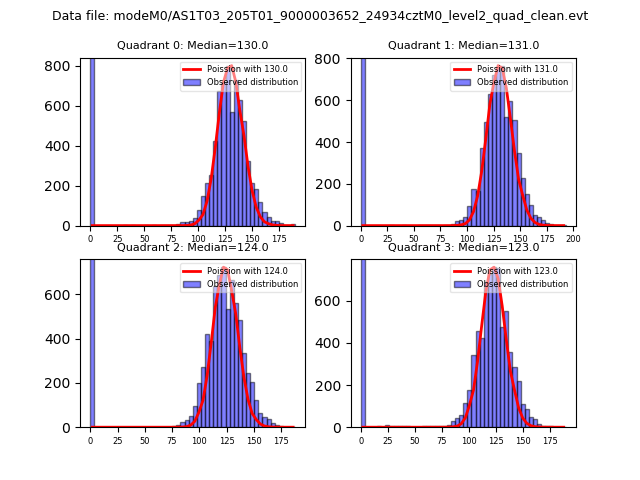 |
 |
| Quadrant-wise count rates Data is divided into 100 sec bins |
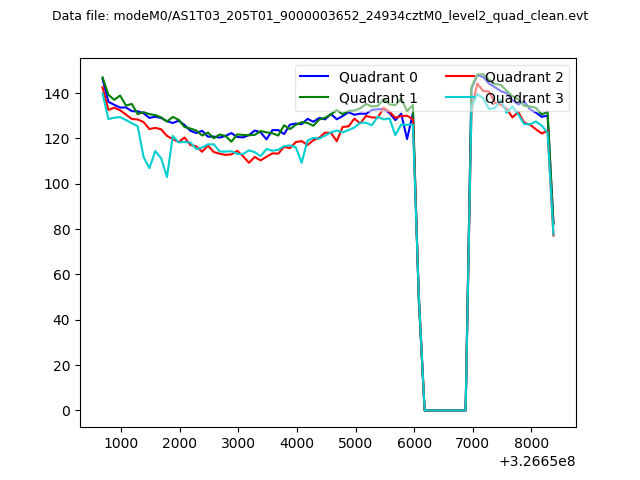 |
|
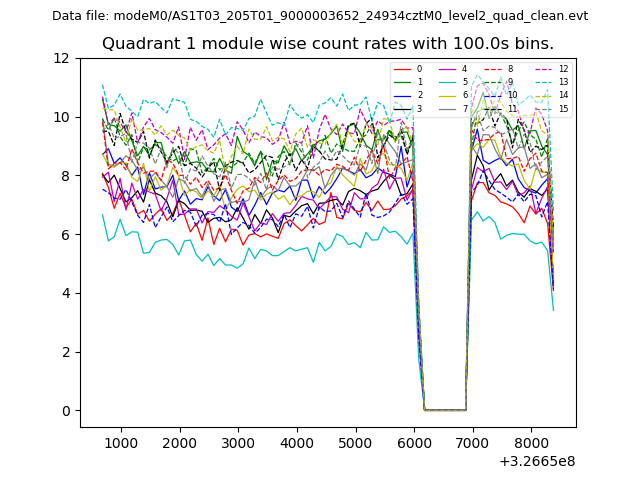
| Module-wise count rates for Quadrant A Data is divided into 100 sec bins |
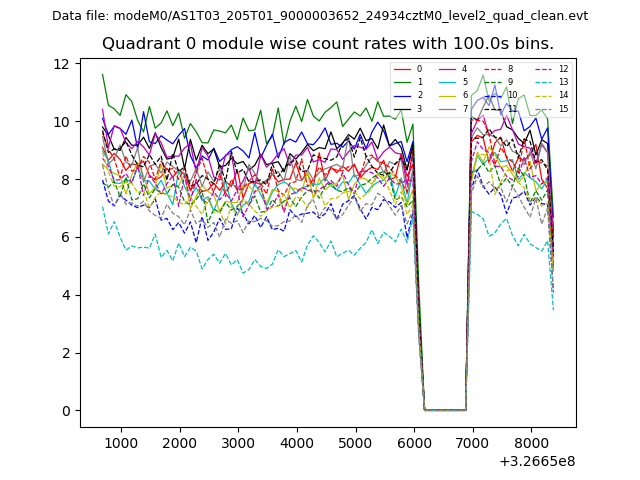 |
 |
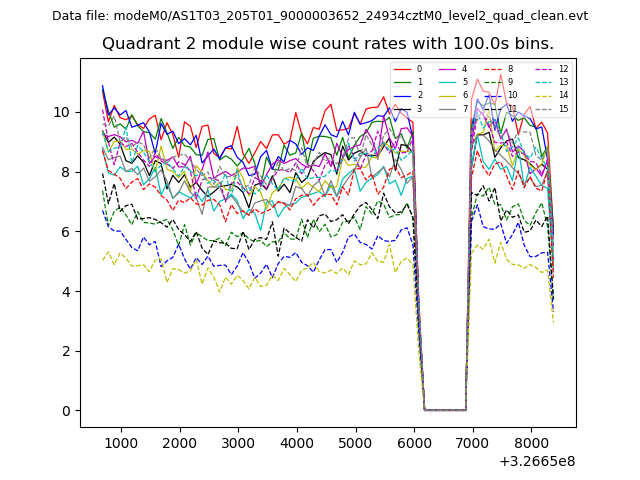
| Module-wise count rates for Quadrant B Data is divided into 100 sec bins |
 |
 |
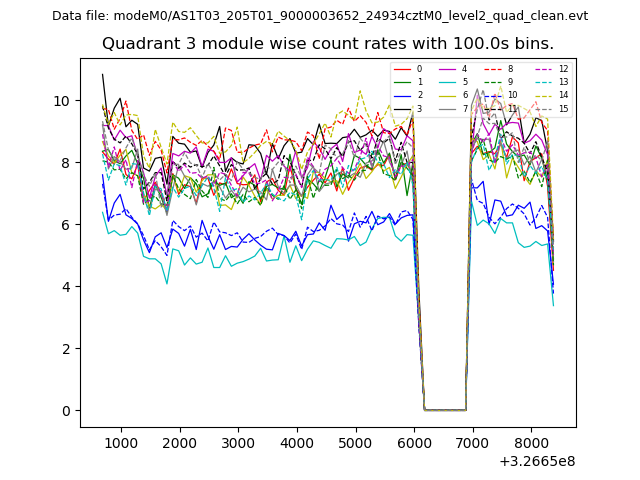
| Module-wise count rates for Quadrant C Data is divided into 100 sec bins |
 |
 |
| Module-wise count rates for Quadrant D Data is divided into 100 sec bins |
 |
 |
| Parameter | Plot |
|---|---|
| CZT HV Monitor | 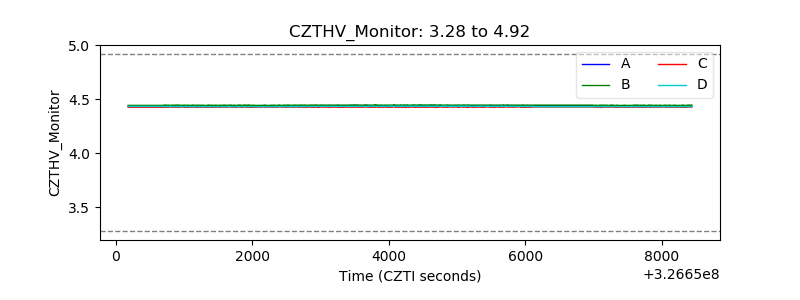 |
| D_VDD | 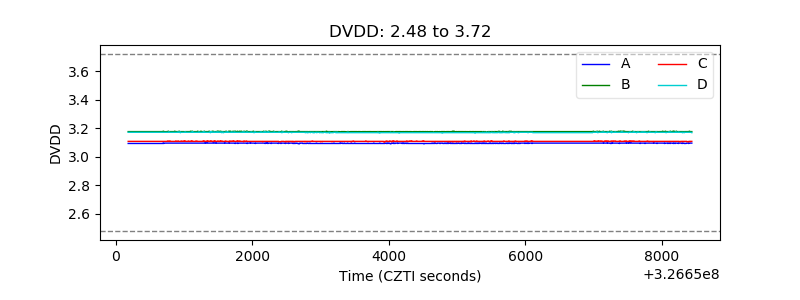 |
| Temperature 1 |  |
| Veto HV Monitor | 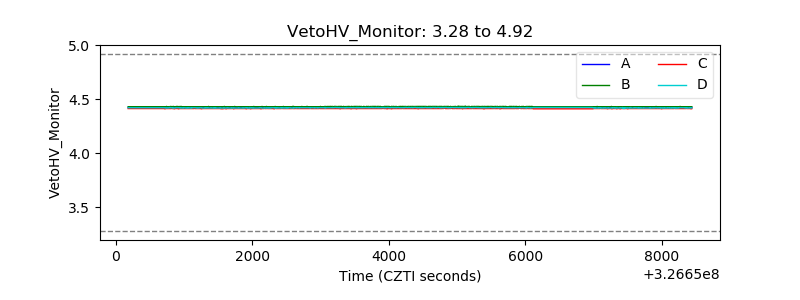 |
| Veto LLD | 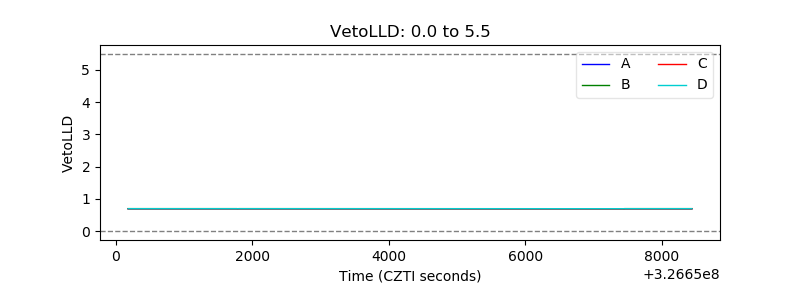 |
| Alpha Counter | 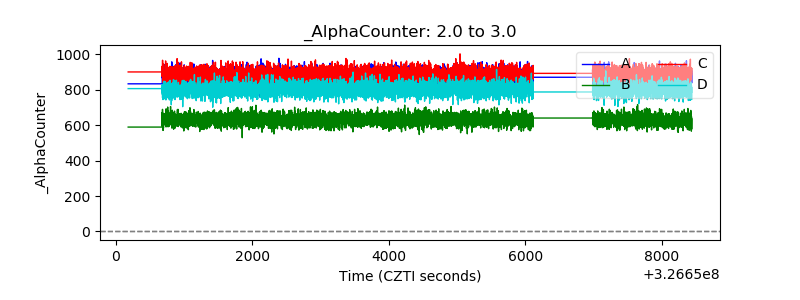 |
| _CPM_Rate | 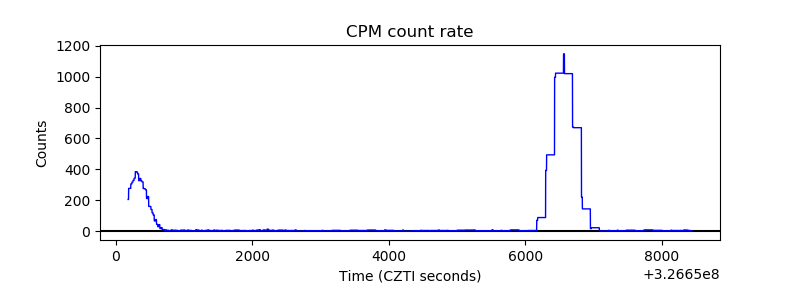 |
| CZT Counter | 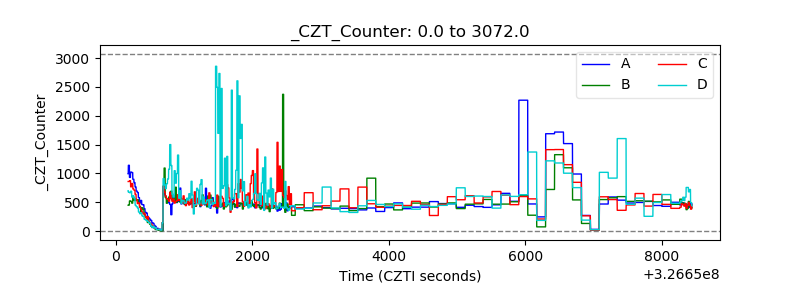 |
| +2.5 Volts monitor | 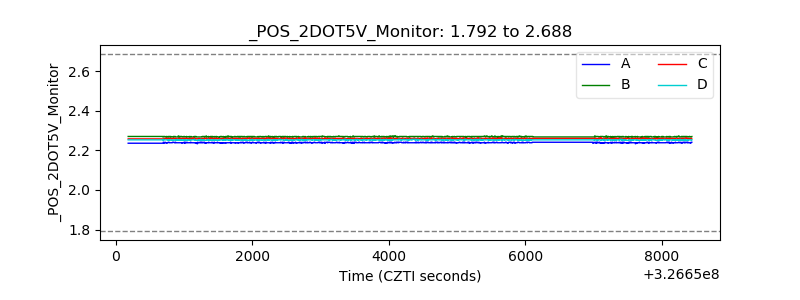 |
| +5 Volts monitor | 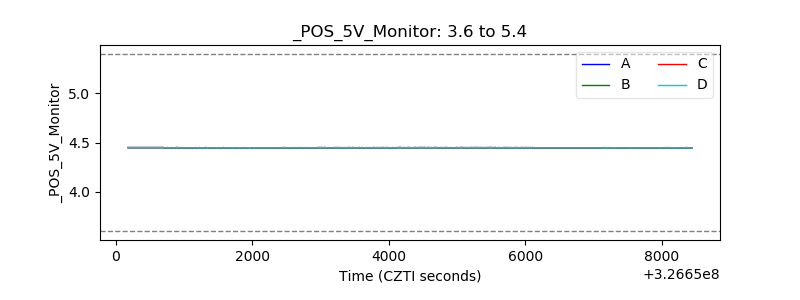 |
| _ROLL_ROT | 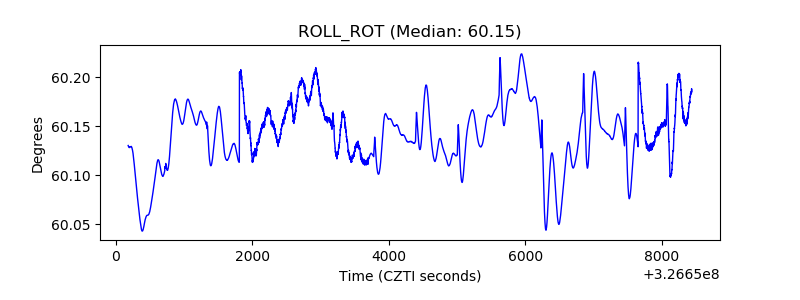 |
| _Roll_DEC | 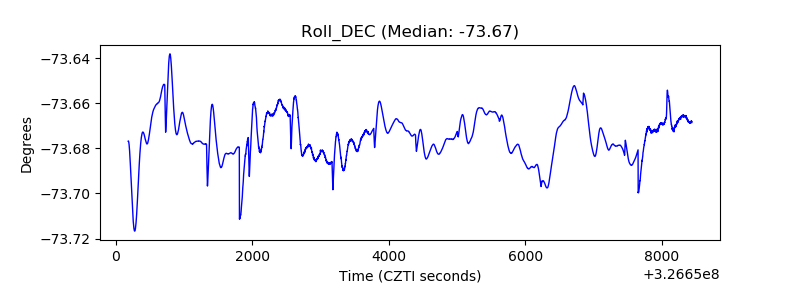 |
| _Roll_RA | 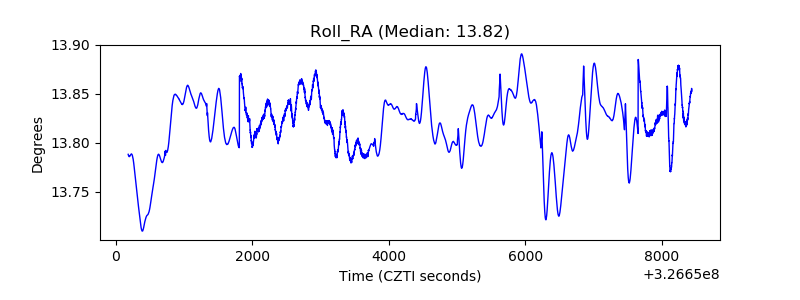 |
| Veto Counter | 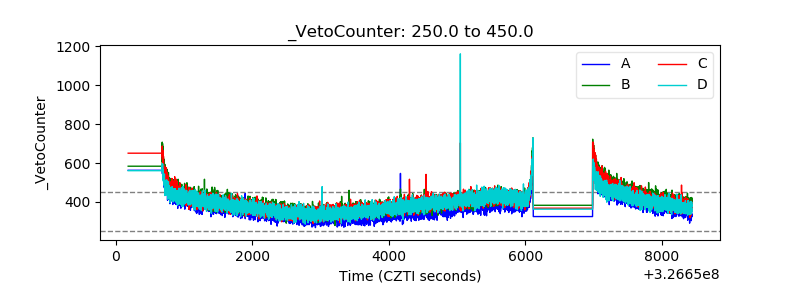 |