| Param | Original file | Final file |
|---|---|---|
| Filename | modeM0/AS1T03_205T01_9000003652_24937cztM0_level2.evt | modeM0/AS1T03_205T01_9000003652_24937cztM0_level2_quad_clean.evt |
| Size (bytes) | 415,249,920 | 120,144,960 |
| Size | 396.0 MB | 114.6 MB |
| Events in quadrant A | 2,868,501 | 821,277 |
| Events in quadrant B | 2,993,896 | 829,867 |
| Events in quadrant C | 3,184,162 | 782,190 |
| Events in quadrant D | 3,113,946 | 779,344 |
| Mode SS | |||
|---|---|---|---|
| Quadrant | BADHDUFLAG | Total packets | Discarded packets |
| A | 0 | 124 | 0 |
| B | 0 | 124 | 0 |
| C | 0 | 124 | 0 |
| D | 0 | 124 | 0 |
| Mode M9 | |||
|---|---|---|---|
| Quadrant | BADHDUFLAG | Total packets | Discarded packets |
| A | 0 | 11 | 0 |
| B | 0 | 11 | 0 |
| C | 0 | 11 | 0 |
| D | 0 | 11 | 0 |
| Mode M0 | |||
|---|---|---|---|
| Quadrant | BADHDUFLAG | Total packets | Discarded packets |
| A | 0 | 12531 | 1 |
| B | 0 | 12842 | 1 |
| C | 0 | 13382 | 1 |
| D | 0 | 13285 | 1 |
| Quadrant | Total seconds | Saturated seconds | Saturation percentage |
|---|---|---|---|
| A | 6107 | 28 | 0.458490% |
| B | 6107 | 29 | 0.474865% |
| C | 6107 | 66 | 1.080727% |
| D | 6108 | 21 | 0.343811% |
Noise dominated data is calculated using 1-second bins in cleaned event files. If a bin has >2000 counts, and if more than 50% of those come from <1% of pixels, then it is considered to be noise-dominated and hence unusable.
| Quadrant | # 1 sec bins | Bins with >0 counts | Bins with >2000 counts | High rate bins dominated by noise | Noise dominated (total time) | Noise dominated (detector-on time) | Marked lightcurve |
|---|---|---|---|---|---|---|---|
| A | 7157 | 6108 | 0 | 0 | 0.00% | 0.00% | 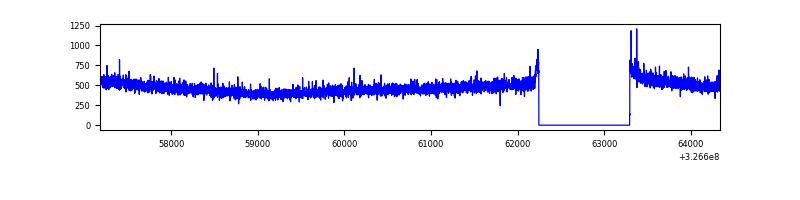 |
| B | 7156 | 6107 | 0 | 0 | 0.00% | 0.00% | 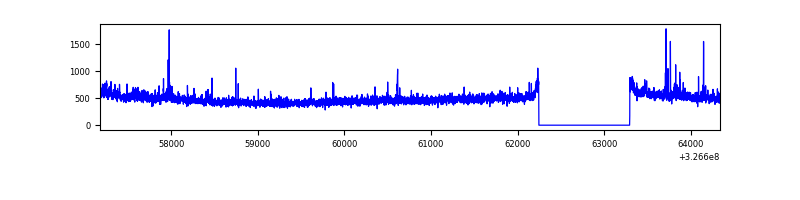 |
| C | 7156 | 6107 | 0 | 0 | 0.00% | 0.00% | 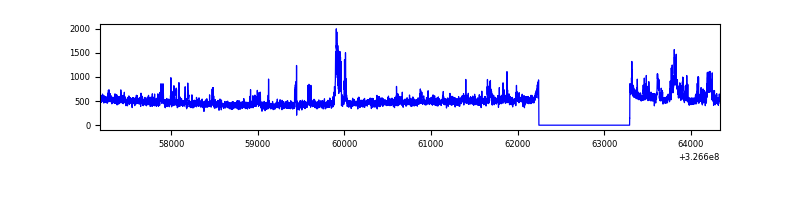 |
| D | 7158 | 6109 | 8 | 8 | 0.11% | 0.13% | 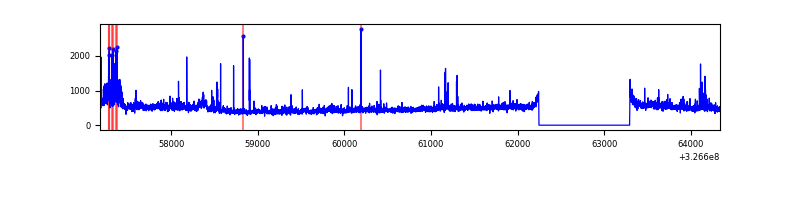 |
Top three noisy pixels from each quadrant. If the there are fewer than three noisy pixels in the level2.evt file, extra rows are filled as -1
| Pixel properties | Quadrant properties | ||||||
|---|---|---|---|---|---|---|---|
| Quadrant | DetID | PixID | Counts | Sigma | Mean | Median | Sigma |
| A | 13 | 254 | 9539 | 58.84 | 743 | 728 | 149.8 |
| A | 3 | 137 | 6676 | 39.72 | 743 | 728 | 149.8 |
| A | 0 | 226 | 6371 | 37.68 | 743 | 728 | 149.8 |
| B | 7 | 202 | 29252 | 203.11 | 738 | 719 | 140.5 |
| B | 0 | 230 | 19043 | 130.44 | 738 | 719 | 140.5 |
| B | 0 | 229 | 18180 | 124.3 | 738 | 719 | 140.5 |
| C | 7 | 247 | 319912 | 1957.04 | 704 | 708 | 163.1 |
| C | 14 | 238 | 115697 | 705.0 | 704 | 708 | 163.1 |
| C | 13 | 61 | 4846 | 25.37 | 704 | 708 | 163.1 |
| D | 1 | 52 | 191130 | 1120.02 | 713 | 693 | 170.0 |
| D | 8 | 195 | 89442 | 521.96 | 713 | 693 | 170.0 |
| D | 2 | 244 | 56379 | 327.51 | 713 | 693 | 170.0 |
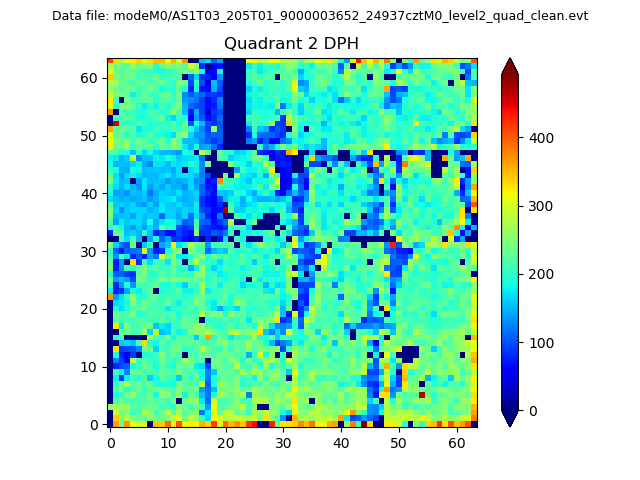
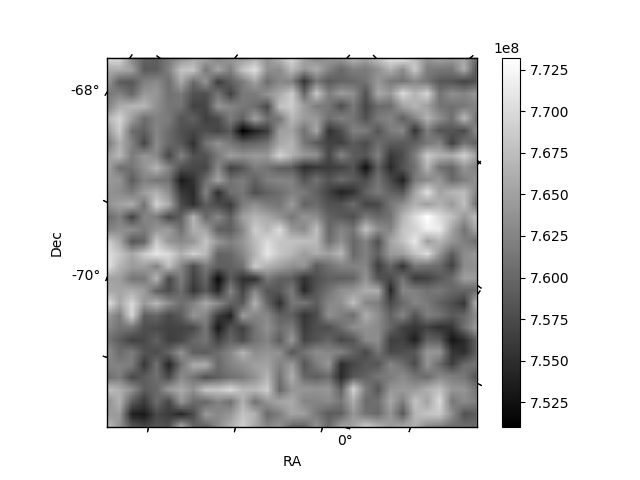
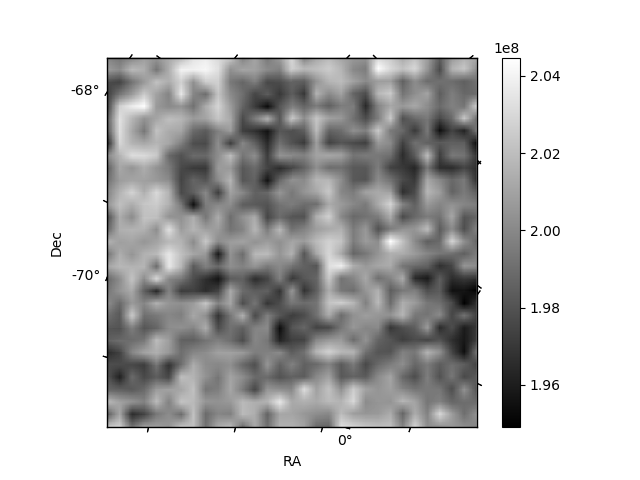
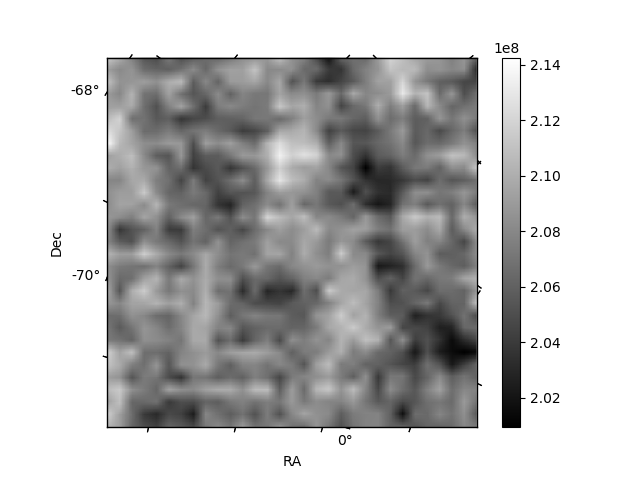
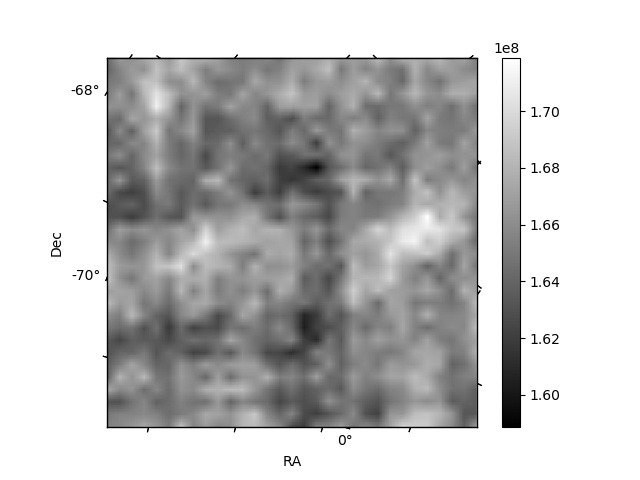
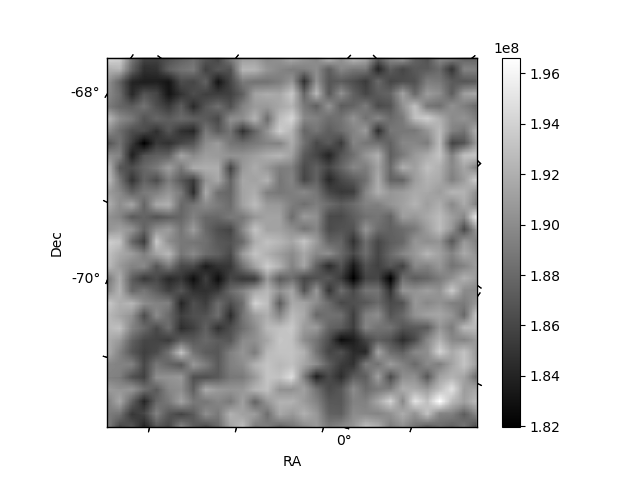
Histogram calculated using DETX and DETY for each event in the final _common_clean file
| Quadrant A | 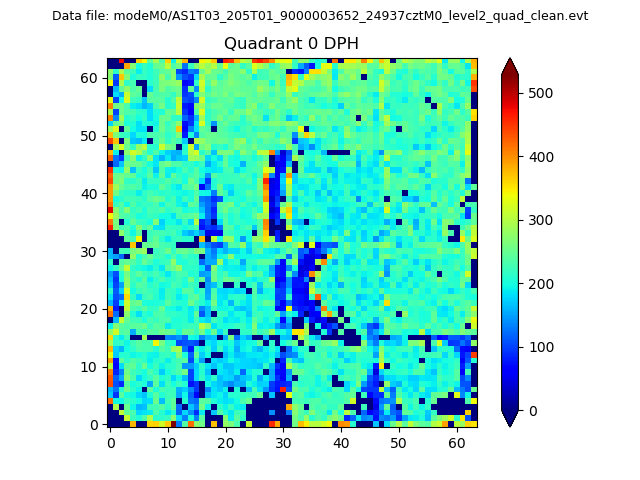 |
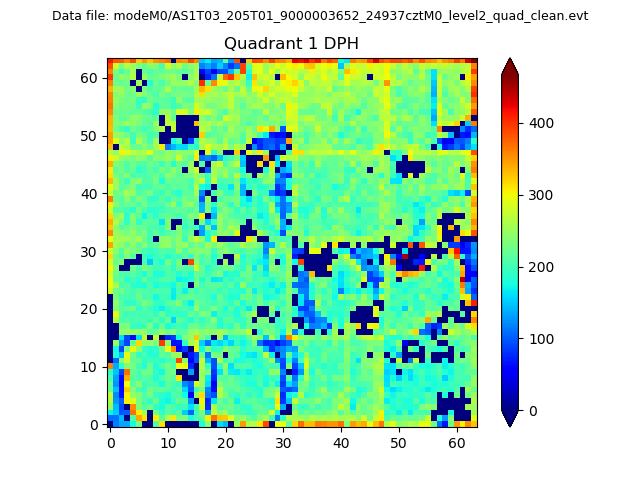 |
Quadrant B |
|---|---|---|---|
| Quadrant D | 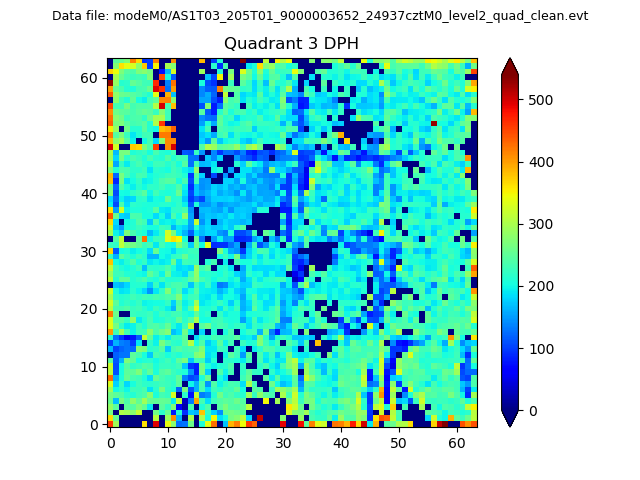 |
 |
Quadrant C |
| Plot type | Count rate plots | Images |
|---|---|---|
| Comparison with Poisson distribution Blue bars denote a histogram of data divided into 1 sec bins. Red curve is a Poisson curve with rate = median count rate of data. |
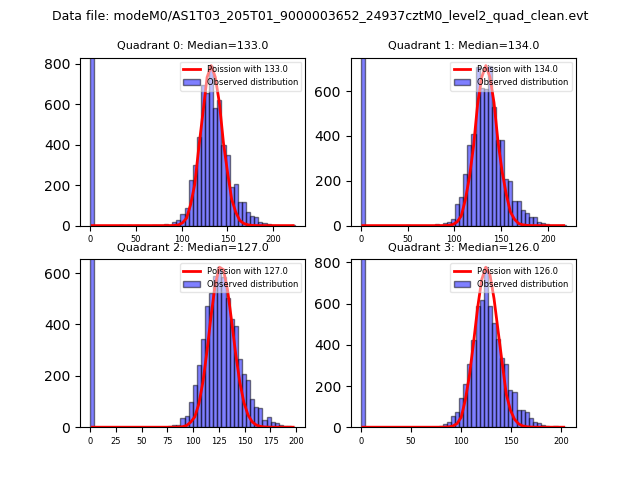 |
 |
| Quadrant-wise count rates Data is divided into 100 sec bins |
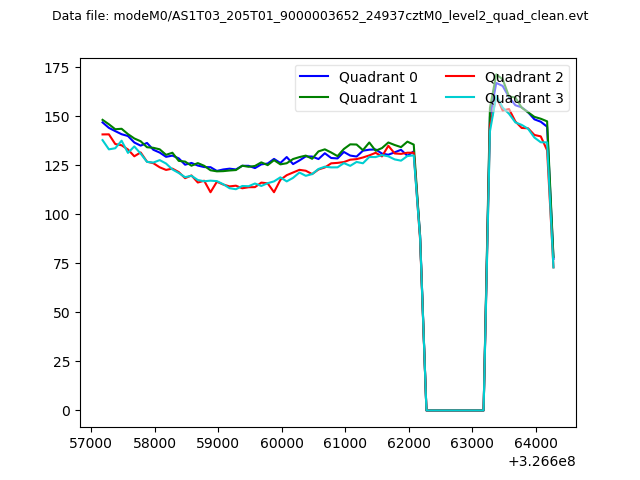 |
|
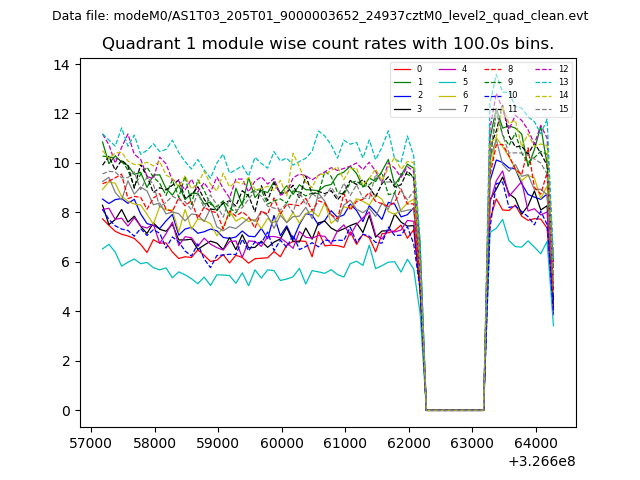
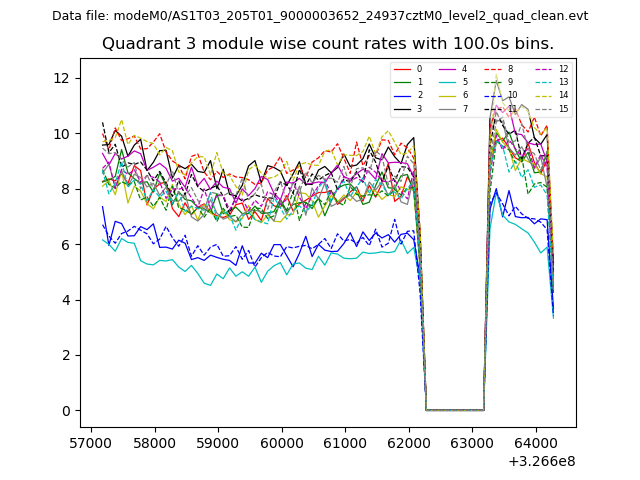
| Module-wise count rates for Quadrant A Data is divided into 100 sec bins |
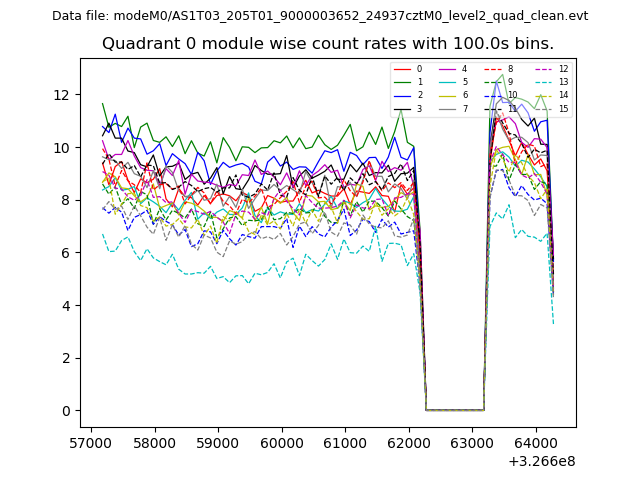 |
 |
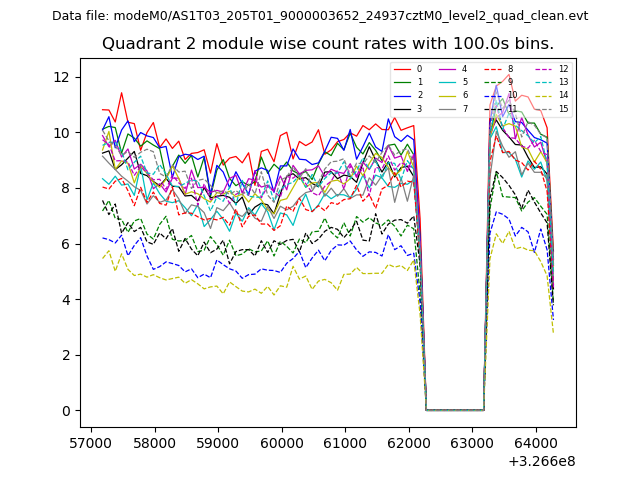
| Module-wise count rates for Quadrant B Data is divided into 100 sec bins |
 |
 |
| Module-wise count rates for Quadrant C Data is divided into 100 sec bins |
 |
 |
| Module-wise count rates for Quadrant D Data is divided into 100 sec bins |
 |
 |
| Parameter | Plot |
|---|---|
| CZT HV Monitor |  |
| D_VDD | 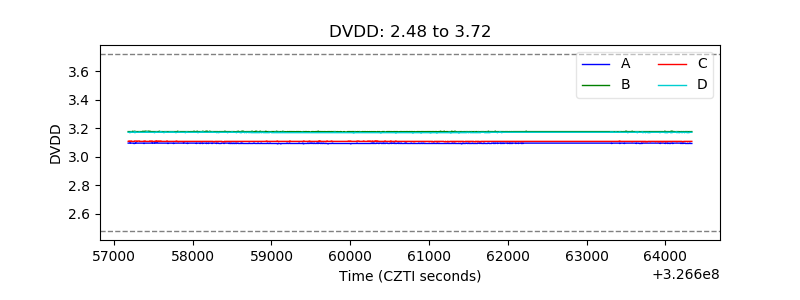 |
| Temperature 1 | 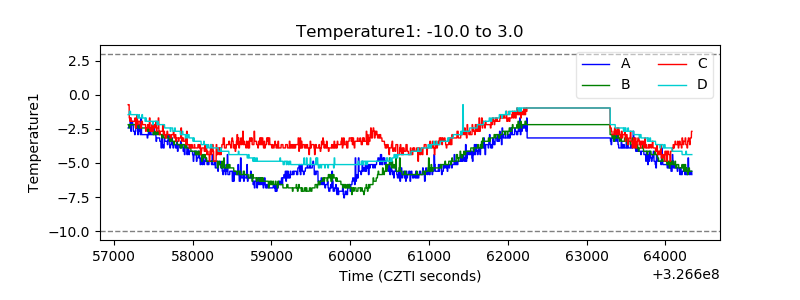 |
| Veto HV Monitor | 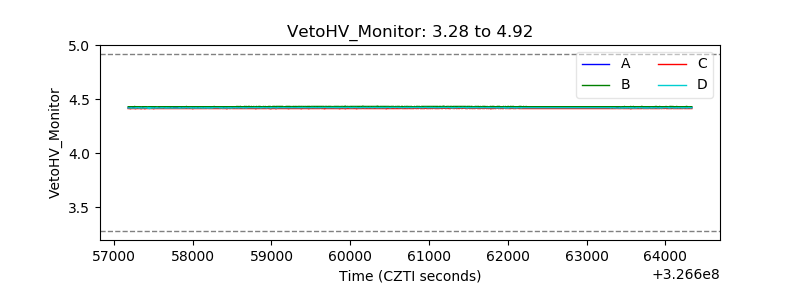 |
| Veto LLD | 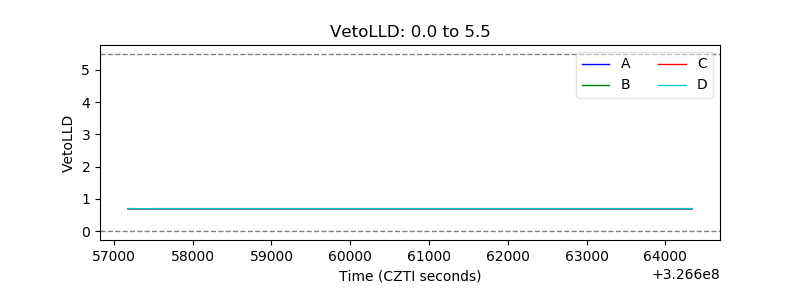 |
| Alpha Counter | 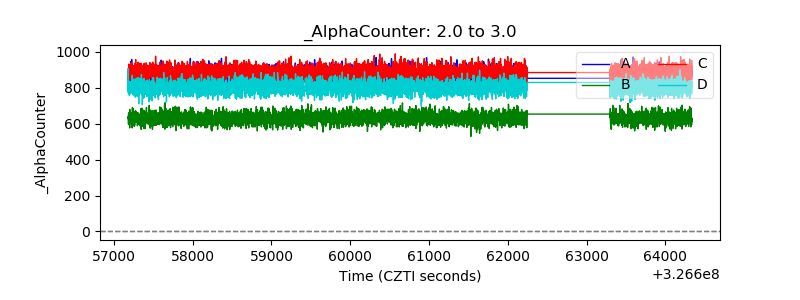 |
| _CPM_Rate | 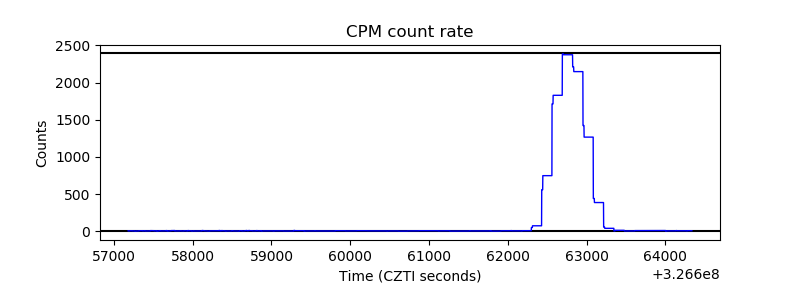 |
| CZT Counter |  |
| +2.5 Volts monitor |  |
| +5 Volts monitor |  |
| _ROLL_ROT | 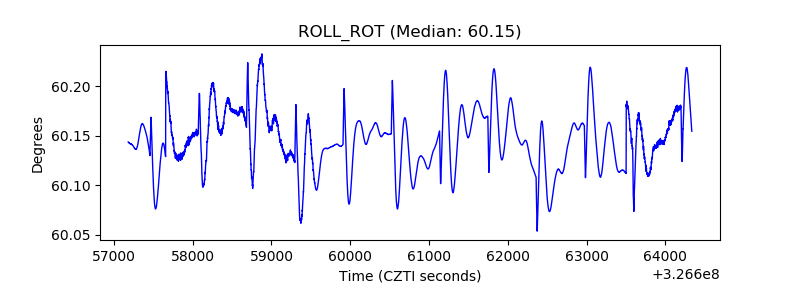 |
| _Roll_DEC |  |
| _Roll_RA | 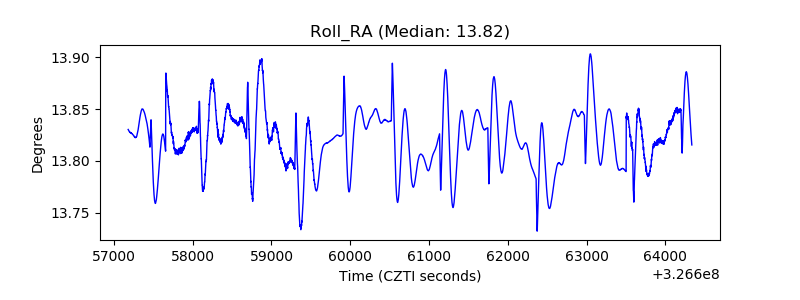 |
| Veto Counter | 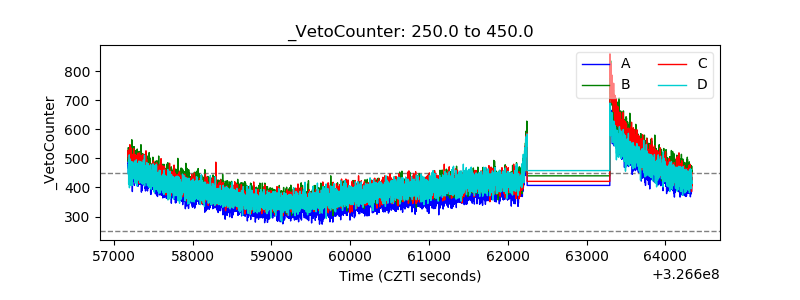 |